- Table of Content
- 1.Keep safe!
- 2.Heading for th...
- 3.Review of sola...
- 4.PROBA2 Observa...
- 5.The Internatio...
- 6.Review of geom...
- 7.Geomagnetic Ob...
- 8.The SIDC space...
- 9.Review of iono...
2. Heading for the solar cycle minimum
3. Review of solar activity
4. PROBA2 Observations (9 Mar 2020 - 15 Mar 2020)
5. The International Sunspot Number by SILSO
6. Review of geomagnetic activity
7. Geomagnetic Observations at Dourbes (9 Mar 2020 - 15 Mar 2020)
8. The SIDC space weather Briefing
9. Review of ionospheric activity (9 Mar 2020 - 15 Mar 2020)
Keep safe!
Remember, you are not alone. Keep safe!
Heading for the solar cycle minimum
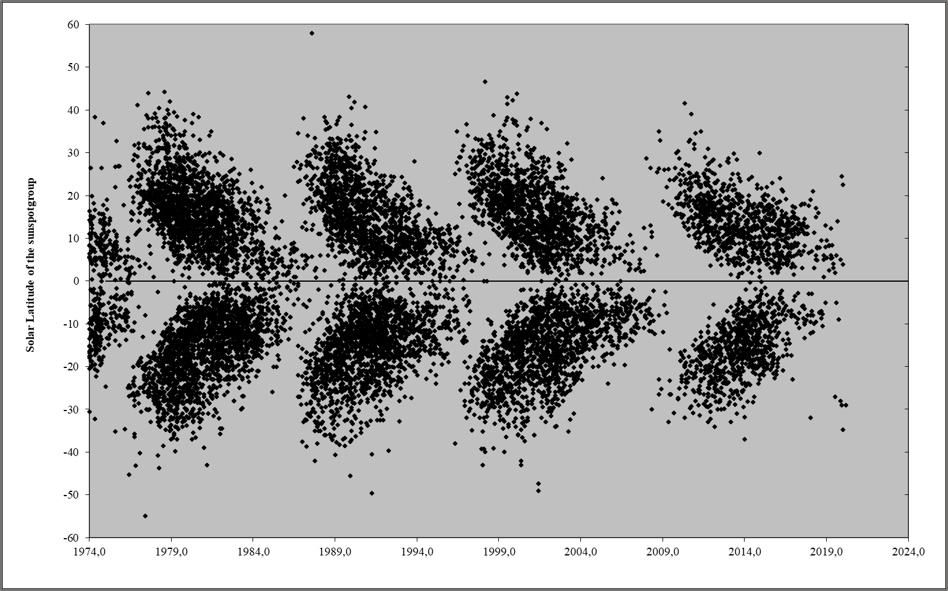
With the appearance of active region NOAA 2758 on 8-9 March, there are now 8 numbered sunspot groups of the new solar cycle. Two of these were located on the northern solar hemisphere, and 6 on the southern. This can be seen in the so-called butterfly diagram underneath, displaying for each month since 1974 the latitude of every individual sunspot group (NOAA number) that has appeared. It clearly shows that as a solar cycle is heading for the next minimum, the sunspot groups appear ever closer to the solar equator, gradually becoming smaller and disappearing while the sunspots of the new solar cycle manifest themselves again at high latitudes. As the pattern resembles the wings of a butterfly, it is called a butterfly diagram. The first such butterfly diagram was published by E. Walter Maunder in the Monthly Notices of the Royal Astronomical Society in 1904 (https://ui.adsabs.harvard.edu/abs/1904MNRAS..64..747M/abstract ). The sunspot groups from the new solar cycle that have appeared over the last few months start revealing the outer tips of the new butterfly's wings.
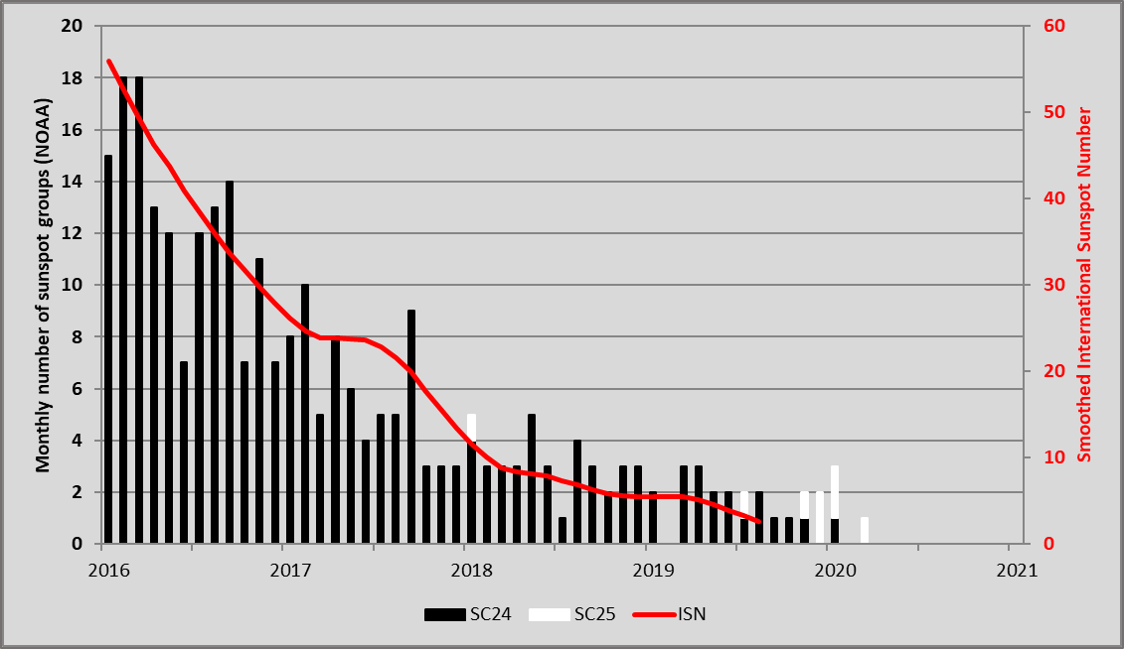
Putting these observations in a bar chart, and distinguishing the old from the new solar cycle groups (resp. black and white bars), one can see that the number of solar cycle 25 (SC25) groups has gradually increased during the second half of 2019. This evolution seems to continue into early 2020 (NOAA 2758 already included in the March data). Solar cycle minimum usually takes place within a few months of the break-even between the number of groups from the two cycles, i.e. the month where the number of SC25 groups becomes larger than that from SC24. This would hint at a minimum somewhere between September 2019 and January 2020.
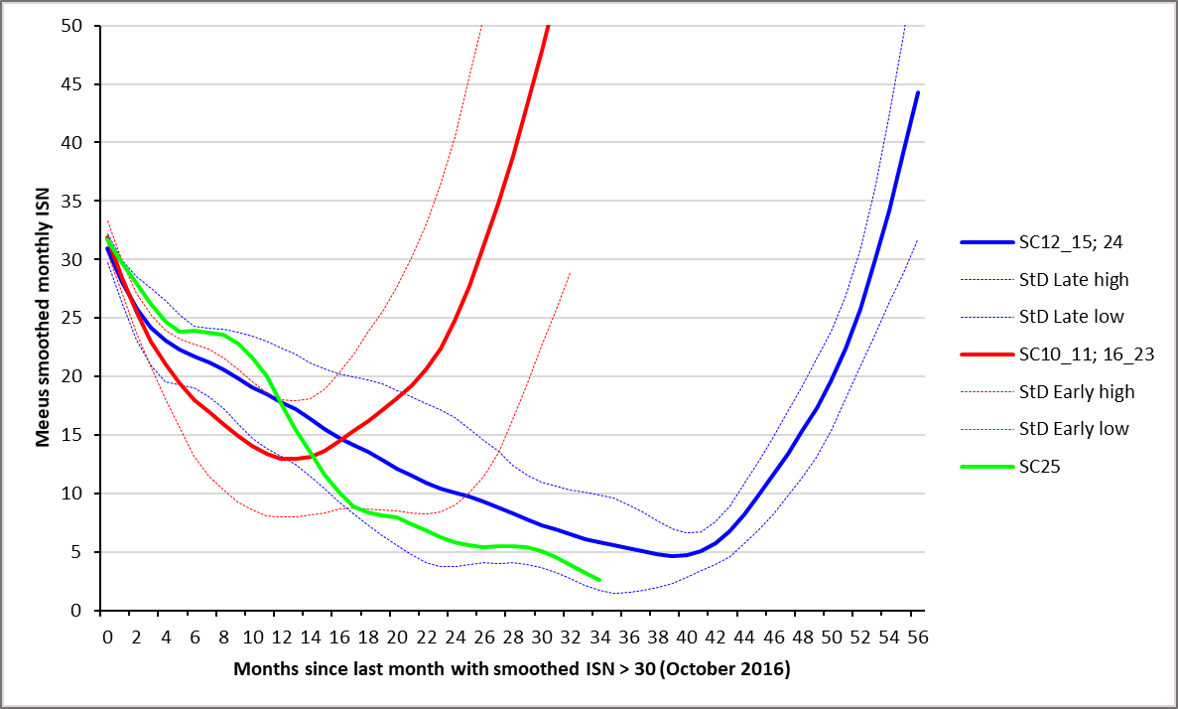
Meanwhile, sunspot numbers have continued their decrease, as shown in the graph underneath. The SC24-25 transit can be compared to previous solar cycles, which have been conveniently grouped into two bins: cycles 12-15 and 24 (blue curves), and cycles 10-11 and 16-23 (red curves). The dashed curves indicate the standard deviation from the average curve (thick lines). Point "0" is the last month with a smoothed sunspot number above 30. This value was arbitrarily chosen, but could not be much lower as some cycle minima had smoothed sunspot numbers around 18. Month "0" for the current minimum transit was in October 2016. For the "red" group of solar cycles, a minimum occured on the average 13 months later. However, for the other group (blue curves) this minimum took place only after 39 months. The final timing is mostly determined by the strength of the new cycle: more active cycles tend to start their rise earlier (after 8-15 months; "red" group), though there have been 2 notable exceptions: SC17 and SC22. The smoothed sunspot number currently traces the low activity cycle curves (blue group), with a smoothed minimum possibly somewhere between September 2019 and February 2020.
In view of the aforementioned results, and because we are already in March, it might well be that the solar cycle minimum is already behind us. We will only know for sure pending the evolution of the smoothed monthly sunspot number over the next few months. At any rate, solar cycle minimum really seems to be knocking on our door now!
Review of solar activity
Solar flaring activity was low. One B-class flare reported. The B2.3 flare (peaked at 05:56 UT, on March 11) originated from Catania group 29, (NOAA AR 2758), the only sunspot group observed this week.
There was no Earth-directed CMEs observed this week.
The solar protons remained at the background level during the whole week.
Two negative polarity coronal holes were present on the side of the solar disk facing Earth. One was a small equatorial coronal hole that reached central meridian on March 8. At that time, a low latitude extension of the southern polar coronal hole was also visible.
The other coronal hole was a large, but rather patchy equatorial coronal hole that reached central meridian on March 15.
PROBA2 Observations (9 Mar 2020 - 15 Mar 2020)
Solar Activity
Solar flare activity was very low during the week.
In order to view the activity of this week in more detail, we suggest to go to the following website from which all the daily (normal and difference) movies can be accessed: https://proba2.oma.be/ssa
This page also lists the recorded flaring events.
A weekly overview movie can be found here (SWAP week 520): https://proba2.sidc.be/swap/data/mpg/movies/weekly_movies/weekly_movie_2020_03_09.mp4
Details about some of this week's events can be found further below.
If any of the linked movies are unavailable they can be found in the P2SC movie repository here: https://proba2.oma.be/swap/data/mpg/movies/
Wednesday Mar 11
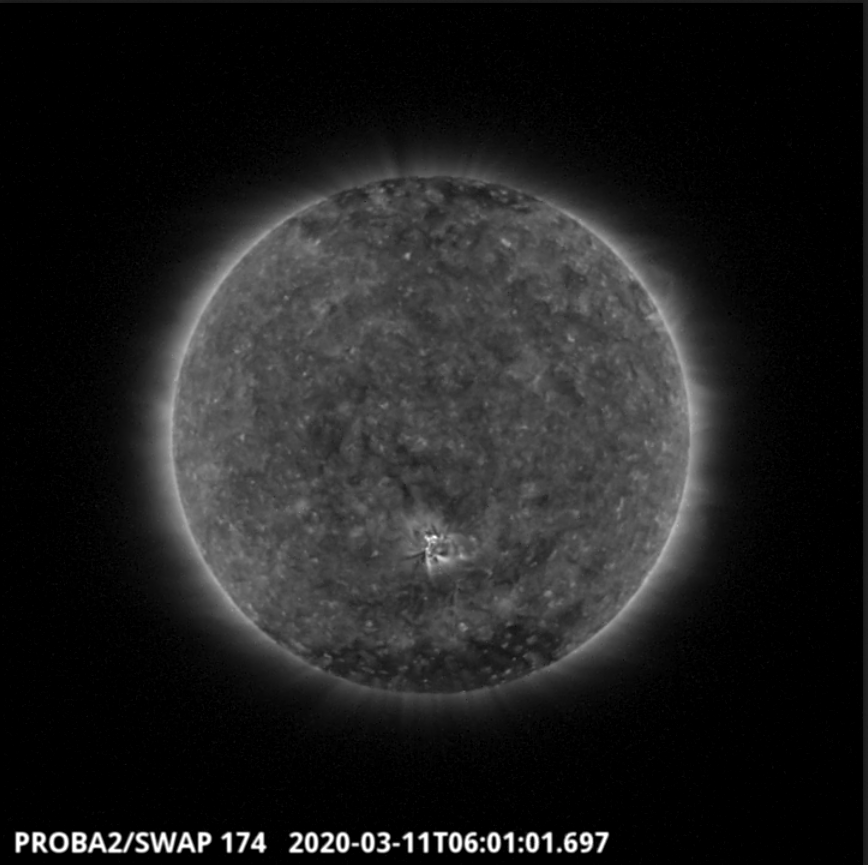
A flare (B2.3) was observed by SWAP and LYRA on 2020-Mar-11 as shown in the SWAP image above taken at 06:01 UT.
Find a movie of the event here (SWAP movie): https://proba2.sidc.be/swap/movies/20200311_swap_movie.mp4
The International Sunspot Number by SILSO
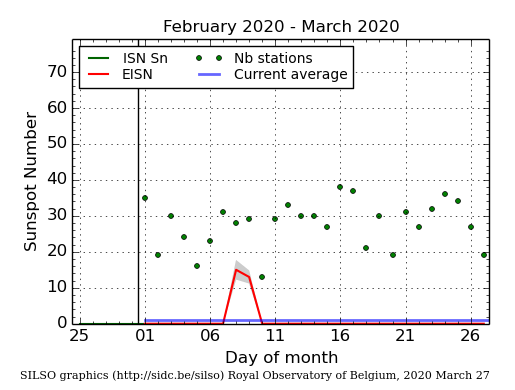
The daily Estimated International Sunspot Number (EISN, red curve with shaded error) derived by a simplified method from real-time data from the worldwide SILSO network. It extends the official Sunspot Number from the full processing of the preceding month (green line). The plot shows the last 30 days (about one solar rotation). The horizontal blue line shows the current monthly average, while the green dots give the number of stations included in the calculation of the EISN for each day.
Review of geomagnetic activity
Earth was most of the time inside a slow solar wind with speed between 290 and 450 km/s. The interplanetary magnetic field magnitude stayed between 3 to 7 nT.
The solar wind density increased on March 12. At the same time, the interplanetary magnetic field fluctuated strongly. Following this change of parameters, the temperature and solar wind speed increased, indicating possibly the arrival of the solar wind from either the negative polarity coronal hole that reached central meridian on March 8, or the low latitude extension of the southern polar coronal hole.
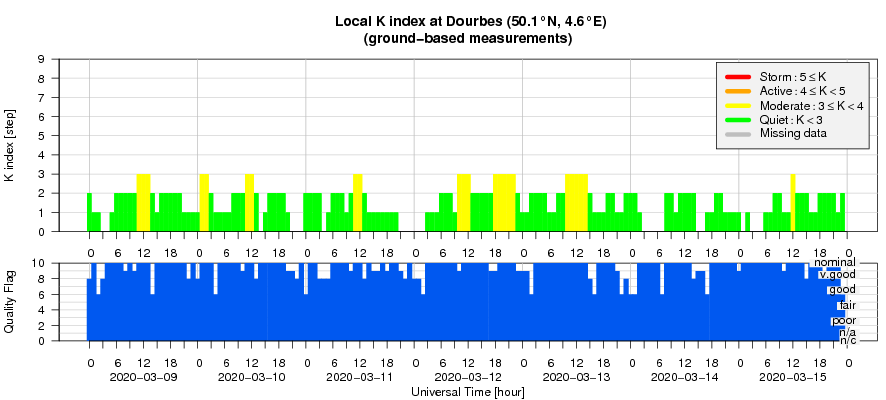
The geomagnetic conditions were quiet with few unsettled intervals, i.e. both Dourbes and NOAA reported a K(Kp) index of 3.
Geomagnetic Observations at Dourbes (9 Mar 2020 - 15 Mar 2020)
The SIDC space weather Briefing
The Space Weather Briefing presented by the forecaster on duty from March 8 to 15. It reflects in images and graphs what is written in the Solar and Geomagnetic Activity report.
The pdf-version: http://www.stce.be/briefings/20200316_SWbriefing.pdf
The automatically running presentation: http://www.stce.be/briefings/20200316_SWbriefing.ppsm
Review of ionospheric activity (9 Mar 2020 - 15 Mar 2020)
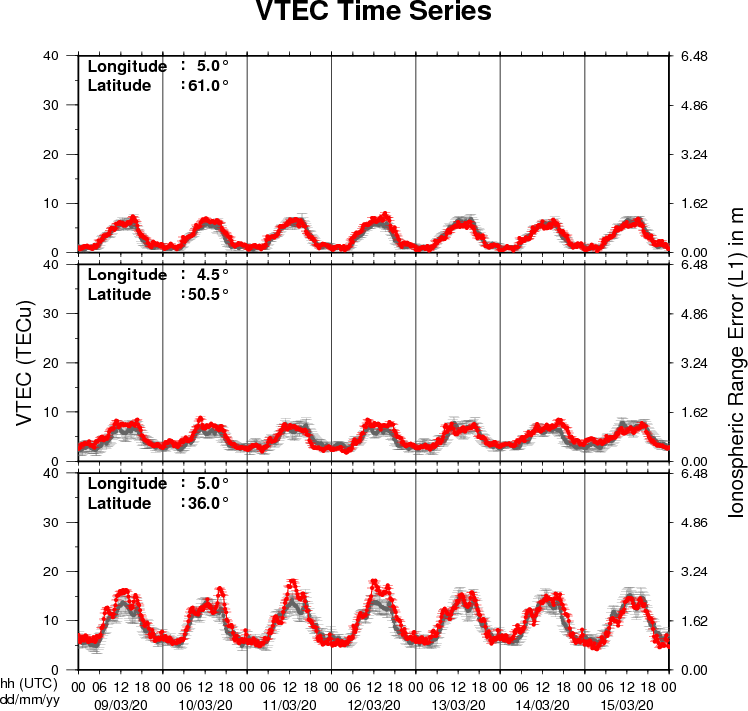
The figure shows the time evolution of the Vertical Total Electron Content (VTEC) (in red) during the last week at three locations:
a) in the northern part of Europe(N61°, 5°E)
b) above Brussels(N50.5°, 4.5°E)
c) in the southern part of Europe(N36°, 5°E)
This figure also shows (in grey) the normal ionospheric behaviour expected based on the median VTEC from the 15 previous days.
The VTEC is expressed in TECu (with TECu=10^16 electrons per square meter) and is directly related to the signal propagation delay due to the ionosphere (in figure: delay on GPS L1 frequency).
The Sun's radiation ionizes the Earth's upper atmosphere, the ionosphere, located from about 60km to 1000km above the Earth's surface.The ionization process in the ionosphere produces ions and free electrons. These electrons perturb the propagation of the GNSS (Global Navigation Satellite System) signals by inducing a so-called ionospheric delay.
See http://stce.be/newsletter/GNSS_final.pdf for some more explanations ; for detailed information, see http://gnss.be/ionosphere_tutorial.php