- Table of Content
- 1.Corona infecte...
- 2.Review of sola...
- 3.PROBA2 Observa...
- 4.The Internatio...
- 5.Geomagnetic Ob...
- 6.The SIDC space...
- 7.Review of iono...
2. Review of solar and geomagnetic activity
3. PROBA2 Observations
4. The International Sunspot Number by SILSO
5. Geomagnetic Observations at Dourbes
6. The SIDC space weather Briefing
7. Review of ionospheric activity
Corona infected astronomy!
Staying with the buzzword of our times, the word "corona" is being used very often in astronomy too. So we are just going to skip the beer, cake, and cigar brands, as well as the locations, arts, satellites and many other domains where the word appears. Even then, containing ourselves as such, the topics where the term pops up are still very varied. A brief overview.
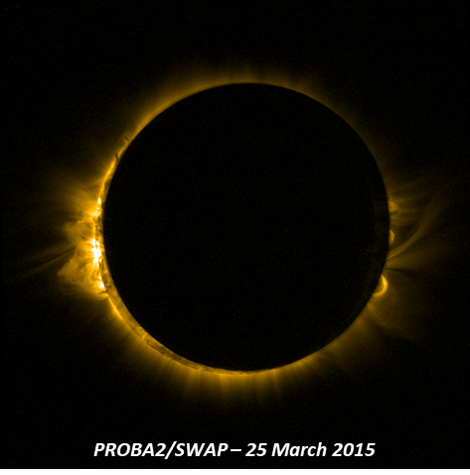
Starting in the solar-terrestrial domain, corona refers of course to the outer atmosphere of the Sun and the other stars. For solar physicists and space weather experts it is an important research topic, and to the general public it is best known as the white glow surrounding the Sun during a total solar eclipse. There are quite a few derivatives too, such as coronal mass ejection, coronal hole, coronagraph,...
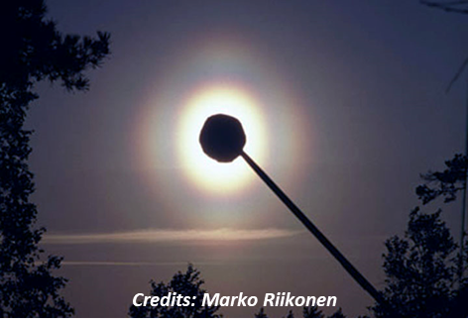
There exists a second type of solar corona, but that has nothing to do with solar physics. In fact, it's a meteorological phenomenon that is produced by the diffraction of light by tiny cloud droplets, small ice crystals or pollen in the earth's atmosphere. One or more coloured rings can then be seen around a very bright center. The rings are more like ovals in case of a pollen corona, as the pollen are not so nicely spherical as water droplets. The corona is much smaller than the typical halo that can be seen around the Sun (another meteorological phenomenon). Please make sure never to gaze directly at the Sun, but try to observe it in a reflection e.g. in a pool of water or a mirror of plain glass. Of course, in this respect, also the Moon can have a corona!
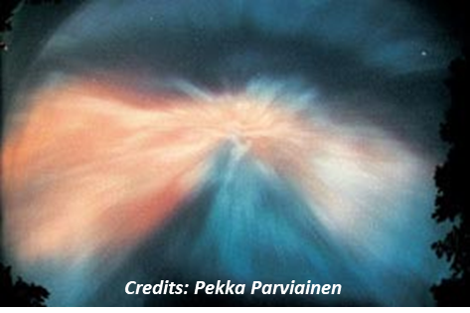
Polar lights have their corona too. In this context, it pertains to the shape that the aurora assumes when it passes overhead an observer's location on the ground. Then, the observer looks directly up along a bundle of parallel magnetic field lines. As a result of this perspective, the auroral features seem to fan out from a central point in the sky, giving it a towering, crown-like outlook. Therefore, it is sometimes called a polar light crown.
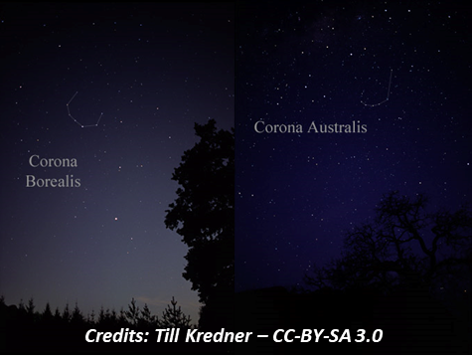
Corona is also the name given to two small star constellations. In the northern hemisphere, there's Corona Borealis (Northern Crown), located between Hercules and Bootis. Its main star has a luminosity 75 times that of the Sun. In the southern hemisphere, Corona Australis (Southern Crown) borders the constellations of Sagittarius and Scorpius. Both constellations have a distinctive crown-like shape. They contain a number of multiple-star systems as well as some giant stars. Note the main stars of the constellations as we see them in the sky do not have any physical connection, they just happen to stand in our line-of-sight.
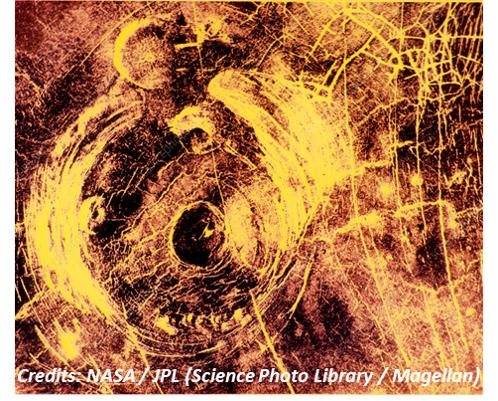
Planetary geologists joined the corona club in the 1980s when the Russian Venera-15 and -16 spacecraft produced radar images of the Venus surface, revealing oval-shaped features of several hundred kilometers in diameter showing concentrical fractures. Called corona, it is believed that they are formed when plumes of rising hot material in the mantle push the crust upwards into a dome shape, which then collapses in the centre as the molten magma cools and leaks out at the sides, leaving a crown-like structure. The Magellan spacecraft imaged these features extensively in the 1990s, and coronae were also discovered on Miranda, a moon of the planet Uranus.
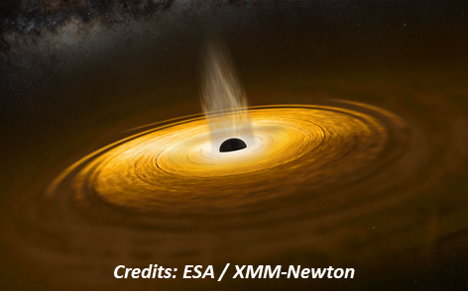
In the end, corona propelled itself all the way into stardom. Indeed, there seems to exist something what is called a galactic corona. Galactic coronas are huge, invisible regions of hot gas that surround a galaxy's visible bulk, forming a spheroidal shape. Coronas are so hot that they can be detected by their x-ray emission, far beyond the optical radius of the galaxy. Because they are so wispy, these coronas are extremely difficult to detect. Galactic coronas have been and are currently being studied extensively, in the hope of gaining a further understanding of galaxy formation. By the way, also black holes have a feature that is called a corona. This corona is a region hovering over the black hole, changing in size and brightness, and (maybe) forming the base of the black hole jets. The corona concerns a region of very hot electrons – with temperatures of around a billion degrees (no, it's not a typo) – producing high-energy x-rays that stream out into space.
If you know of any other use of "corona" in the astronomical or space weather related domain, please let us know and we'll be very happy to add it here in the online newsitem!
References:
- Sky and Telescope - Bob King (2017): https://skyandtelescope.org/observing/sneezing-at-the-full-moon/
- Les Cowley - Atmospheric Optics: http://www.atoptics.co.uk/droplets/corona.htm
- Sky and Telescope - R.H. Eather (2006): https://skyandtelescope.org/observing/celestial-objects-to-watch/an-aurora-watchers-guide/
- Neil Bone - Aurora (2007): https://tinyurl.com/utxffbq
- NASA/JPL - Venus / Aine Corona (1996): https://www.jpl.nasa.gov/spaceimages/details.php?id=PIA00202
- NASA - Karl Hille (2017): https://www.nasa.gov/image-feature/goddard/2017/hubbles-cool-galaxy-with-a-hot-corona
- Wang et al. - ApJL (2001): https://iopscience.iop.org/article/10.1086/323179/fulltext/
- ESA - Black hole corona (2020): https://www.esa.int/ESA_Multimedia/Images/2020/01/The_dynamic_behaviour_of_a_black_hole_corona
- NASA - Black hole corona (2014): https://www.nasa.gov/press/2014/august/nasas-nustar-sees-rare-blurring-of-black-hole-light
Review of solar and geomagnetic activity
SOLAR ACTIVITY
The Sun was quiet. The visible solar disc was spotless. The X-ray flux remained below B-level.
No earth-directed coronal mass ejections (CMEs) have been observed in the available coronagraphic imagery.
The greater than 10 MeV proton flux was at nominal values. The greater than 2 MeV electron flux became enhanced from March 23 to 26.
An extension of the southern polar coronal hole reached the central meridian on March 26.
GEOMAGNETIC ACTIVITY
The solar wind speed near Earth fluctuated between 350 and 530 km/s (DSCOVR). The Interplanetary Magnetic Field (IMF) remained below 5 nT and its Bz component ranged between -5 and +5 nT.
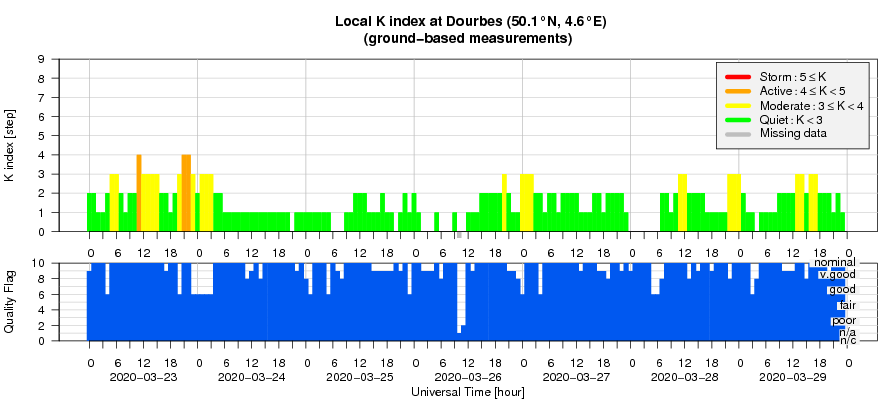
Quiet to unsettled geomagnetic conditions were registered for the majority of the week (K Dourbes and NOAA Kp recorded values between 0 and 3) with two short active intervals on March 23, where K Dourbes reached 4. This was associated with the peak values of the solar wind speed.
PROBA2 Observations
Solar Activity
Solar flare activity was very low during the week.
In order to view the activity of this week in more detail, we suggest to go to the following website from which all the daily (normal and difference) movies can be accessed: https://proba2.oma.be/ssa
This page also lists the recorded flaring events.
A weekly overview movie can be found here (SWAP week 522): http://proba2.oma.be/swap/data/mpg/movies/weekly_movies/weekly_movie_2020_03_23.mp4
Details about some of this week's events can be found further below.
If any of the linked movies are unavailable they can be found in the P2SC movie repository here: https://proba2.oma.be/swap/data/mpg/movies/
Thursday Mar 26
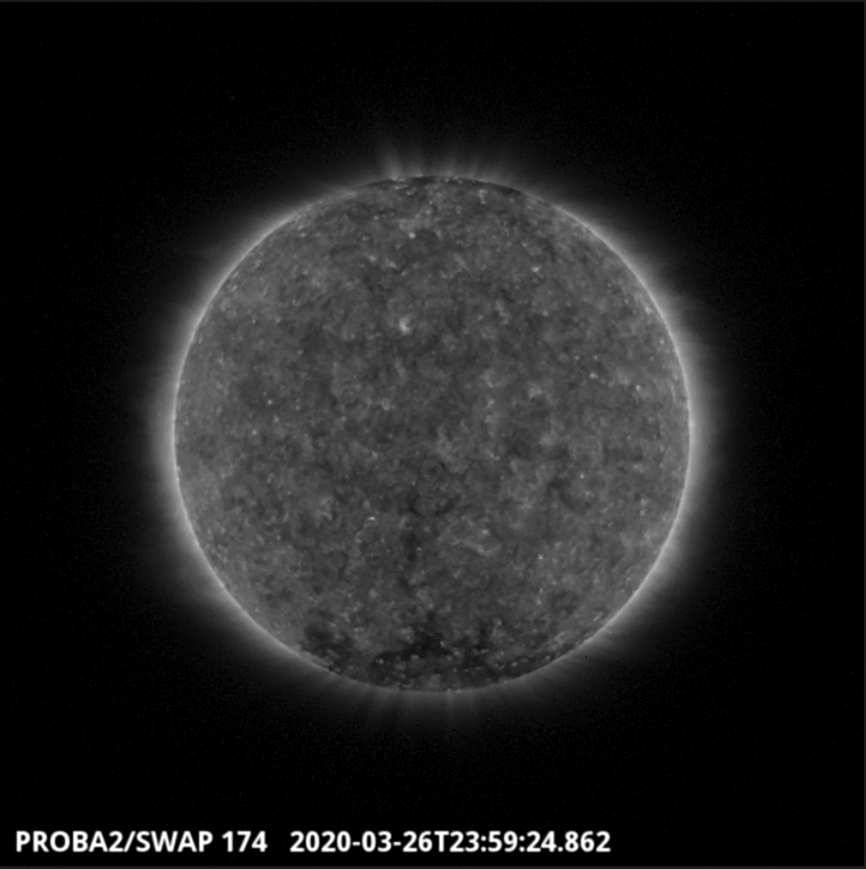
An extension to the southern polar coronal hole began to transit the central meridian on 2020-Mar-26 as shown in the SWAP image above.
Find a movie of the day here (SWAP movie): https://proba2.sidc.be/swap/movies/20200326_swap_movie.mp4
The International Sunspot Number by SILSO
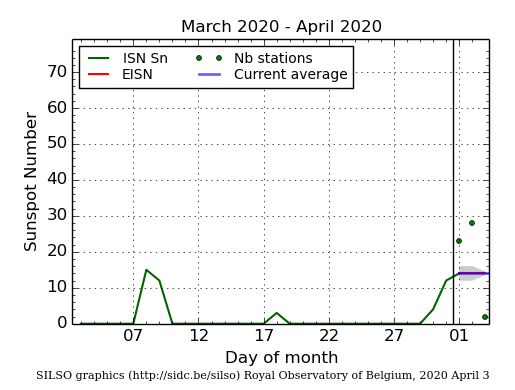
The daily Estimated International Sunspot Number (EISN, red curve with shaded error) derived by a simplified method from real-time data from the worldwide SILSO network. It extends the official Sunspot Number from the full processing of the preceding month (green line). The plot shows the last 30 days (about one solar rotation). The horizontal blue line shows the current monthly average, while the green dots give the number of stations included in the calculation of the EISN for each day.
Geomagnetic Observations at Dourbes
The SIDC space weather Briefing
The Space Weather Briefing presented by the forecaster on duty from March 22 to 29. It reflects in images and graphs what is written in the Solar and Geomagnetic Activity report.
The pdf-version: http://www.stce.be/briefings/20200330_SWbriefing.pdf
The automatically running presentation: http://www.stce.be/briefings/20200330_SWbriefing.ppsm
Review of ionospheric activity
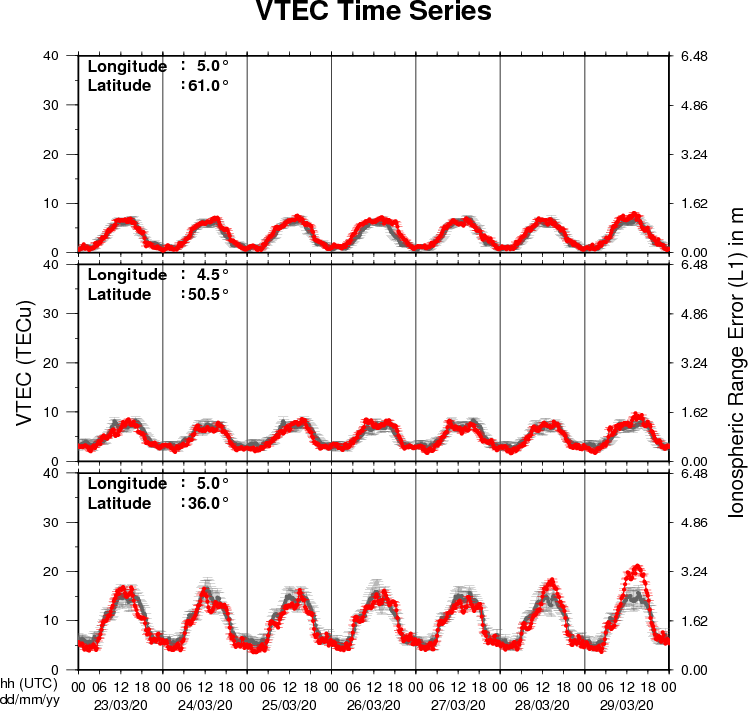
The figure shows the time evolution of the Vertical Total Electron Content (VTEC) (in red) during the last week at three locations:
a) in the northern part of Europe(N61°, 5°E)
b) above Brussels(N50.5°, 4.5°E)
c) in the southern part of Europe(N36°, 5°E)
This figure also shows (in grey) the normal ionospheric behaviour expected based on the median VTEC from the 15 previous days.
The VTEC is expressed in TECu (with TECu=10^16 electrons per square meter) and is directly related to the signal propagation delay due to the ionosphere (in figure: delay on GPS L1 frequency).
The Sun's radiation ionizes the Earth's upper atmosphere, the ionosphere, located from about 60km to 1000km above the Earth's surface.The ionization process in the ionosphere produces ions and free electrons. These electrons perturb the propagation of the GNSS (Global Navigation Satellite System) signals by inducing a so-called ionospheric delay.
See http://stce.be/newsletter/GNSS_final.pdf for some more explanations ; for detailed information, see http://gnss.be/ionosphere_tutorial.php