- Table of Content
- 1.News from the ...
- 2.PhD defence in...
- 3.Review of sola...
- 4.PROBA2 Observa...
- 5.The Internatio...
- 6.Geomagnetic Ob...
- 7.The SIDC space...
- 8.Review of iono...
2. PhD defence in times of corona
3. Review of solar and geomagnetic activity
4. PROBA2 Observations (13 Apr 2020 - 19 Apr 2020)
5. The International Sunspot Number by SILSO
6. Geomagnetic Observations at Dourbes (13 Apr 2020 - 19 Apr 2020)
7. The SIDC space weather Briefing
8. Review of ionospheric activity (13 Apr 2020 - 19 Apr 2020)
News from the North
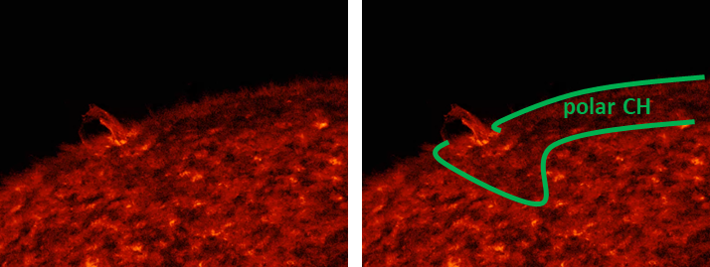
The Sun has been spotless since 5 April (SILSO), and solar activity has been very low. Nonetheless, a small eruption took place early on 13 April. This eruption was not located in the usual sunspot belt region (about 30 degrees on each side of the solar equator), but much farther to the north, in fact it bordered the edge of the northern polar coronal hole (see annotated image underneath - movies created with JHV and available at http://www.stce.be/news/478/welcome.html ). Most likely, a small (spotless) bipolar region emerged and then reconnected with the existing magnetic field from this polar coronal hole.
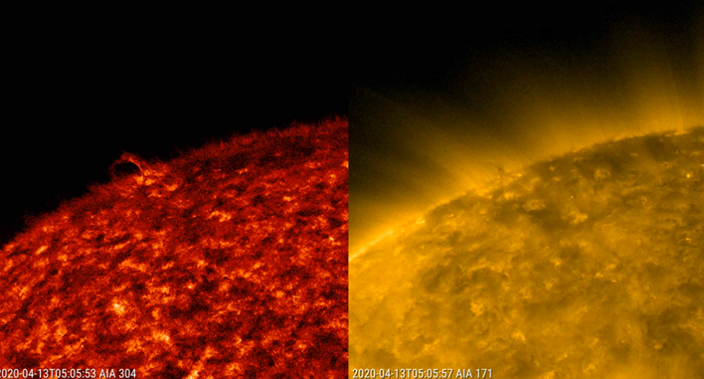
As shown in the extreme ultraviolet (EUV) imagery underneath, the eruption was very compact but also quite violent releasing part of the material into space. A comparison between SDO/AIA 304 (temperatures around 80.000 degrees) and SDO/AIA 171 (temperatures around 700.000 degrees) reveals that the material taking part in the eruption was quite cool. Indeed, in the "hot" AIA 171 filter, the material looks a lot darker ("colder") than in the "cool" AIA 304 filter, where the material is quite bright.
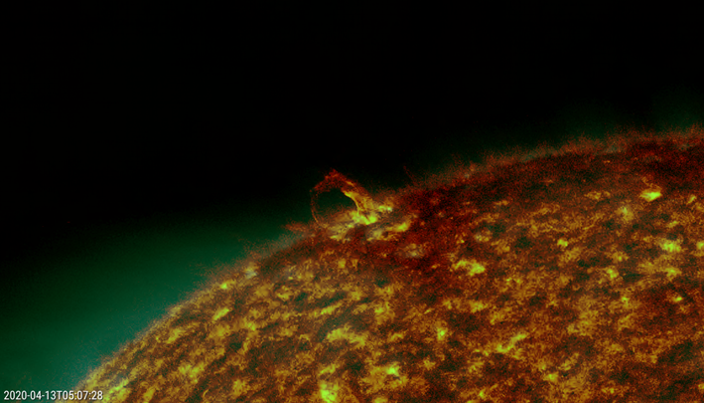
The picture underneath is a combination (one image laid op top of the other) of 2 different EUV filters: SDO/AIA 304, and 193 (green and blue channel only). The entire event didn't last 30 minutes and left no x-ray signature.
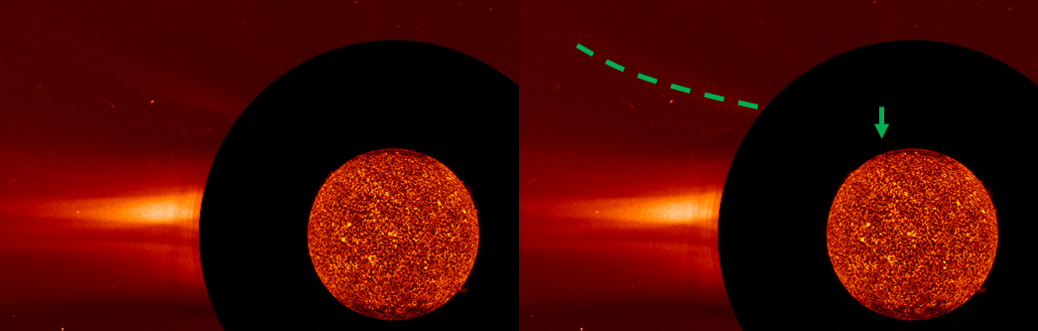
The eruption was associated with a fast and narrow coronal mass ejection (CME). The CACTus tool revealed that the CME was very narrow: only 6 degrees, whereas the average CME width is about 60 degrees. The CME was also very fast, with a speed of at least 1400 km/s (470 km/s is a typical value for a CME). The CME (annotated in the imagery underneath) was not directed to Earth.
PhD defence in times of corona
Scientists didn't stop working. Research continues, also PhD defences.
Camilla Scolini did her preliminary PhD defence following the corona-regulations. The jury and she met on Skype. Nobody had to travel or fly, leaving more time to go into the details of her work on magnetised coronal mass ejections (CME). Camilla submitted CMEs to a thoroughly theoretical investigation while they move from the Sun to Earth and finally cause a geomagnetic storm.
Her public PhD defence is scheduled for May 29. It will probably be an online defence as well. She is not a doctor yet. But, she is already selected as a 2020 NASA Jack Eddy Fellow. If Covid-19 allows, she will join from September the University of New Hampshire to work on a 2-year postdoctoral project funded by the NASA Living With a Star program.
Luciano Rodiguez, CME-expert at the STCE, is her proud co-supervisor.
This is Camilla, just before the preliminary PhD defence began.

Well done Camilla!
Review of solar and geomagnetic activity
SOLAR ACTIVITY
Solar activity was at very low levels. The Sun was spotless all week.
The 10.7cm solar radio flux ranged between 68 and 70 sfu.
Some patchy coronal holes (CHs) were visible throughout the week, with a more prominent extension of the southern polar coronal hole (CH) transiting the central meridian on 16 April.
The greater than 10 MeV proton flux and the greater than 2 MeV electron flux were at nominal values.
STEREO-A/COR2 and SOHO/LASCO C2 coronagraphic imagery showed a weak coronal mass ejection (CME) departing from their respective solar west limb late on 14 April. No obvious solar disk source was detected. This slow CME (+/- 200 km/s) probably did not have an earth-directed component, but data gaps add uncertainty to this conclusion.
No other earth-directed coronal mass ejections (CMEs) have been observed in available coronagraphic imagery.
GEOMAGNETIC ACTIVITY
Solar wind speed was somewhat enhanced from 13-16 April with values up to 450 km/s, then settling for a steady 300-350 km/s for the remainder of the week. Bz varied between -6 and +7 nT, with some stretches of mildly negatice Bz throughout the period.
Geomagnetic activity was quiet to unsettled, the unsettled intervals occurring during 13-16 April.
PROBA2 Observations (13 Apr 2020 - 19 Apr 2020)
Solar Activity
Solar flare activity was very low during the week.
In order to view the activity of this week in more detail, we suggest to go to the following website from which all the daily (normal and difference) movies can be accessed: https://proba2.oma.be/ssa
This page also lists the recorded flaring events.
A weekly overview movie can be found here (SWAP week 525). http://proba2.oma.be/swap/data/mpg/movies/weekly_movies/weekly_movie_2020_04_13.mp4
Details about some of this week's events can be found further below.
If any of the linked movies are unavailable they can be found in the P2SC movie repository here https://proba2.oma.be/swap/data/mpg/movies/
The International Sunspot Number by SILSO
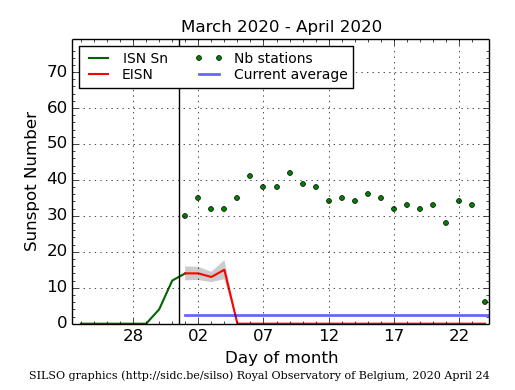
The daily Estimated International Sunspot Number (EISN, red curve with shaded error) derived by a simplified method from real-time data from the worldwide SILSO network. It extends the official Sunspot Number from the full processing of the preceding month (green line). The plot shows the last 30 days (about one solar rotation). The horizontal blue line shows the current monthly average, while the green dots give the number of stations included in the calculation of the EISN for each day.
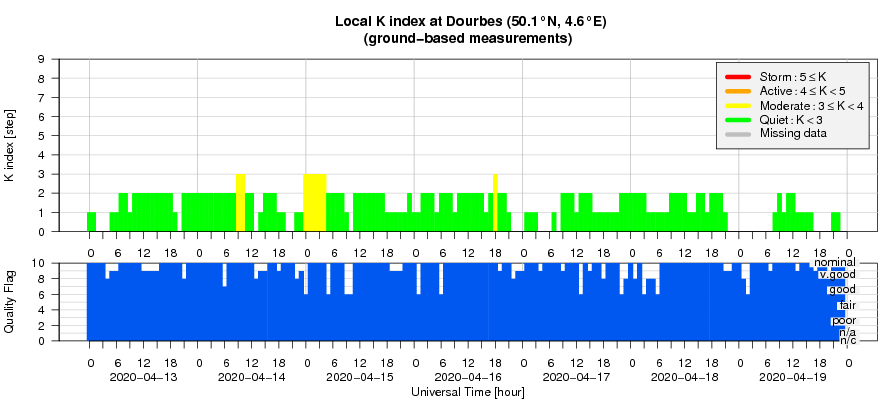
Geomagnetic Observations at Dourbes (13 Apr 2020 - 19 Apr 2020)
The SIDC space weather Briefing
The Space Weather Briefing presented by the forecaster on duty from April 12 to 19. It reflects in images and graphs what is written in the Solar and Geomagnetic Activity report.
The pdf-version: http://www.stce.be/briefings/20200420_SWbriefing.pdf
The automatically running presentation: http://www.stce.be/briefings/20200420_SWbriefing.ppsm
Review of ionospheric activity (13 Apr 2020 - 19 Apr 2020)
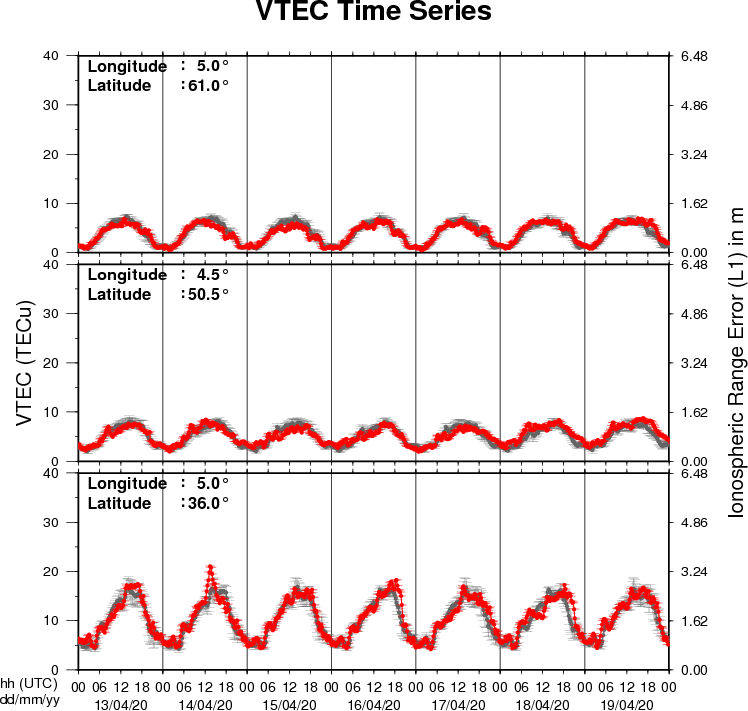
The figure shows the time evolution of the Vertical Total Electron Content (VTEC) (in red) during the last week at three locations:
a) in the northern part of Europe(N61°, 5°E)
b) above Brussels(N50.5°, 4.5°E)
c) in the southern part of Europe(N36°, 5°E)
This figure also shows (in grey) the normal ionospheric behaviour expected based on the median VTEC from the 15 previous days.
The VTEC is expressed in TECu (with TECu=10^16 electrons per square meter) and is directly related to the signal propagation delay due to the ionosphere (in figure: delay on GPS L1 frequency).
The Sun's radiation ionizes the Earth's upper atmosphere, the ionosphere, located from about 60km to 1000km above the Earth's surface.The ionization process in the ionosphere produces ions and free electrons. These electrons perturb the propagation of the GNSS (Global Navigation Satellite System) signals by inducing a so-called ionospheric delay.
See http://stce.be/newsletter/GNSS_final.pdf for some more explanations ; for detailed information, see http://gnss.be/ionosphere_tutorial.php