- Table of Content
- 1.Out of the blu...
- 2.Short message ...
- 3.Review of sola...
- 4.PROBA2 Observa...
- 5.The internatio...
- 6.Geomagnetic Ob...
- 7.The SIDC space...
- 8.Review of iono...
2. Short message on EUI
3. Review of solar and geomagnetic activity
4. PROBA2 Observations (20 Apr 2020 - 26 Apr 2020)
5. The international Sunspot Number by SILSO
6. Geomagnetic Observations at Dourbes (20 Apr 2020 - 26 Apr 2020)
7. The SIDC space weather Briefing
8. Review of ionospheric activity (20 Apr 2020 - 26 Apr 2020)
Out of the blue
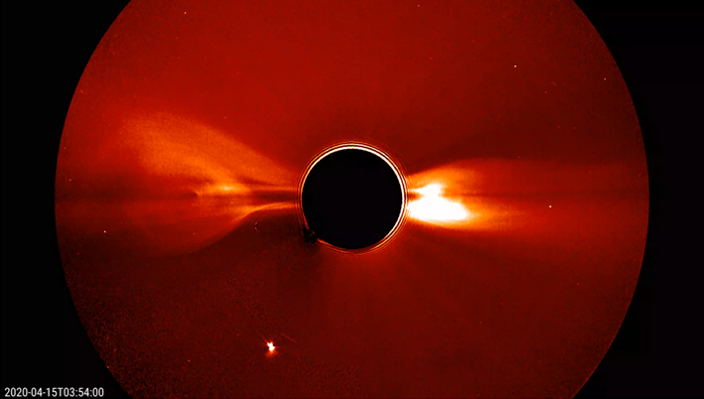
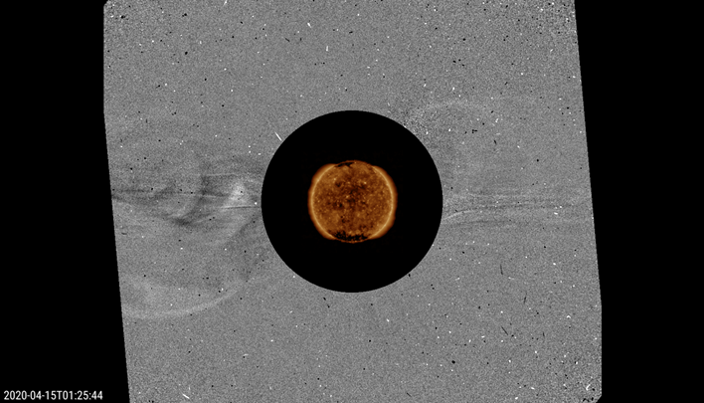
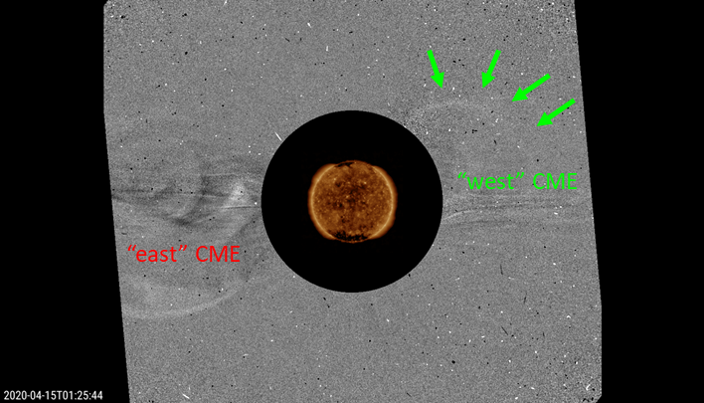
The Sun got the space weather forecasters' attention last week when during the afternoon and evening of 14 April almost simultaneously 2 coronal mass ejections (CMEs) became visible in STEREO-A imagery, one at the east limb and one at the west limb. Due to a large datagap in SOHO/LASCO imagery from about 15 till 24UT, only the final stages of these CMEs could be seen in SOHO's coronagraphic imagery early on 15 April. However, also here, there was one at the east limb and a weak CME at the west-north west limb. This can be seen in the images underneath, with top: STEREO-A, and bottom: SOHO (movies available at http://www.stce.be/news/479/welcome.html ). This meant that one CME was on the farside of the Sun (the one which was at the east limb for both SOHO and STEREO-A), and one was on the earth-facing side (the "west" CME). But was this "west" CME also truly directed to Earth?
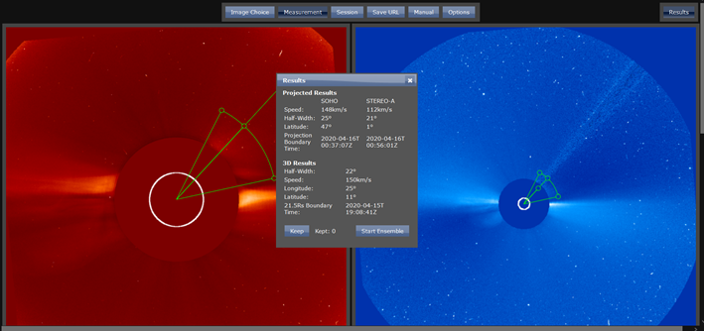
In extreme ultraviolet (EUV) imagery taken by both satellites, no obvious on-disk source could be found for the two CMEs. There was the daily dynamics in the solar atmosphere, and a small reconnection event near the border of the southern polar coronal hole between 19-21UT, but nothing out of the ordinary. With the usual suspects (coronal dimming, post-eruption coronal loops) lacking, forecasters turned to their models combining coronagraphic imagery from both STEREO-A and SOHO to get a more accurate idea on the propagation of this CME. Applying StereoCat (a NASA/GSFC model - https://ccmc.gsfc.nasa.gov/analysis/stereo/ - see underneath for a screenshot) on the limited available imagery (there was also a datagap in STEREO-A images from 07-21UT on 15 April...), it was determined that this weak CME had a width of about 44 degrees, a longitude of about 25 degrees, and a slow speed somewhere between 150 and 200 km/s. This meant the CME was not earth-directed, but being such a weak event, the possible interaction with coronal hole wind streams, and with all the datagaps, it was still a close call whether or not it had an earth-directed component. But even if Earth would suffer a glancing blow (somewhere around 20 April), this weak CME would not stir much of geomagnetic activity, right? Nothing worth to mention, or so it seemed.
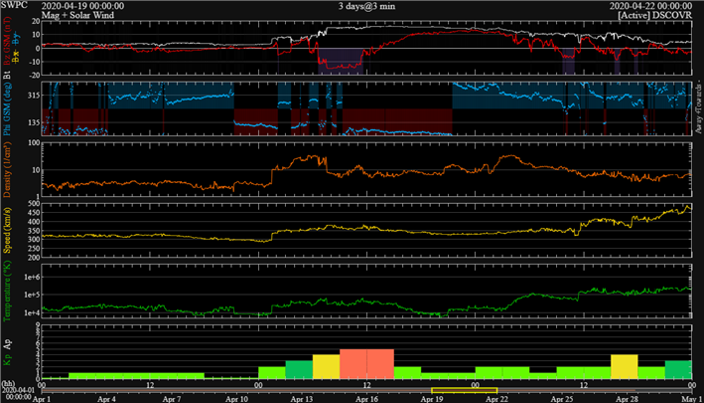
Solar wind parameters had been very low the days prior to 20 April, with the solar wind speed (yellow curve in chart underneath) even occasionally dropping below 300 km/s. Geomagnetic activity was obviously at quiet levels. Then, at 01:30UT on 20 April (DSCOVR), a shock was observed with solar wind speed jumping from 296 to 333 km/s. Bz (red curve), indicating the north- or southward orientation of the magnetic field, first oscillated somewhat until around 06:30UT, before turning strongly southward (negative) reaching -15 nT (!) during a 4-hour period (07-11UT). Wind speed then reached a maximum near 380 km/s, Bz turned to positive values, and all magnetic parameters showed a smooth rotation. The entire evolution was a clear indication of an interplanetary CME passing the earth environment, most likely the "west" CME from 14-15 April. Geomagnetic activity picked up under the influence of this unexpectedly strong disturbance, and reached minor storming levels (Kp=5) during the 09-12 and 12-15UT intervals. This was the first geomagnetic storm since 18-19 February 2020. The storm before that, on 25-26 October 2019, even reached moderate geomagnetic conditions (Kp=6). No doubt this solar event is going to be the topic of discussion at many future space weather conferences.
Short message on EUI
EUI first light is planned for May 12. EUI is the extreme ultraviolet imager onboard of the spacecraft Solar Orbiter. End of short message.
Review of solar and geomagnetic activity
SOLAR ACTIVITY
Solar X-ray flux remained below B level. By the end of the week, active region NOAA 2760 developed as a small bipolar region.
No Earth directed Coronal Mass Ejections (CMEs) were observed.
The greater than 10 MeV proton flux was at nominal levels.
The greater than 2 MeV electron flux have been just slightly enhanced following the elevated Solar wind conditions, but returned to background values by the end of the week.
GEOMAGNETIC ACTIVITY
The week was dominated by and started with the somewhat unexpected arrival of an Interplanetary CME related to the CME that left the Sun on April 15. Midnight 19/20 April, the magnetic cloud passed the L1 point. It had a total magnetic field reaching 16nT. In the morning of April 20, the z-component of the magnetic field of the cloud went down to -15nT. The solar wind speed remained below 400 km/s during the ICME passage. From noon April 21, the solar wind became faster, as expected, due to the extension of the southern polar coronal hole. A maximum of 500 km/s was reached around midnight 21/22, this was before gradually declining to near nominal conditions in the second half of the week.
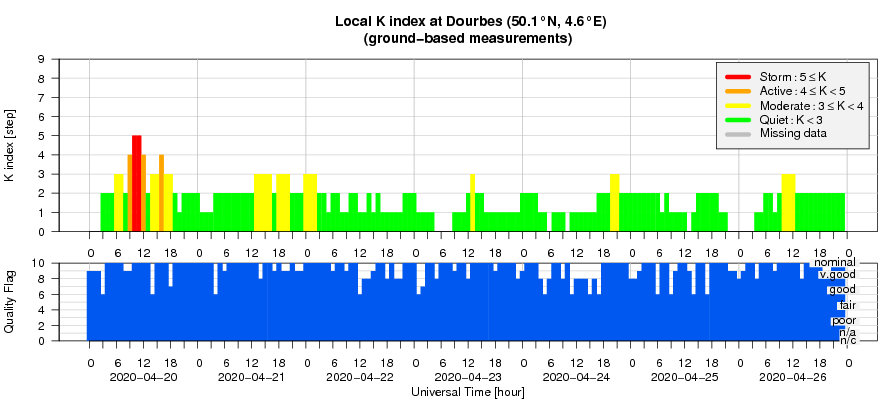
Geomagnetic conditions reached minor storm levels (local K Dourbes and NOAA Kp reaching 5) associated to the CME passage. Geomagnetic conditions were quiet to unsettled for the remainder of the week.
PROBA2 Observations (20 Apr 2020 - 26 Apr 2020)
Solar Activity
Solar flare activity was very low during the week.
In order to view the activity of this week in more detail, we suggest to go to the following website from which all the daily (normal and difference) movies can be accessed: https://proba2.oma.be/ssa
This page also lists the recorded flaring events.
A weekly overview movie can be found here (SWAP week 526): https://proba2.sidc.be/swap/data/mpg/movies/weekly_movies/weekly_movie_2020_04_20.mp4
Details about some of this week's events can be found further below.
If any of the linked movies are unavailable they can be found in the P2SC movie repository here: https://proba2.oma.be/swap/data/mpg/movies/
Sunday Apr 26
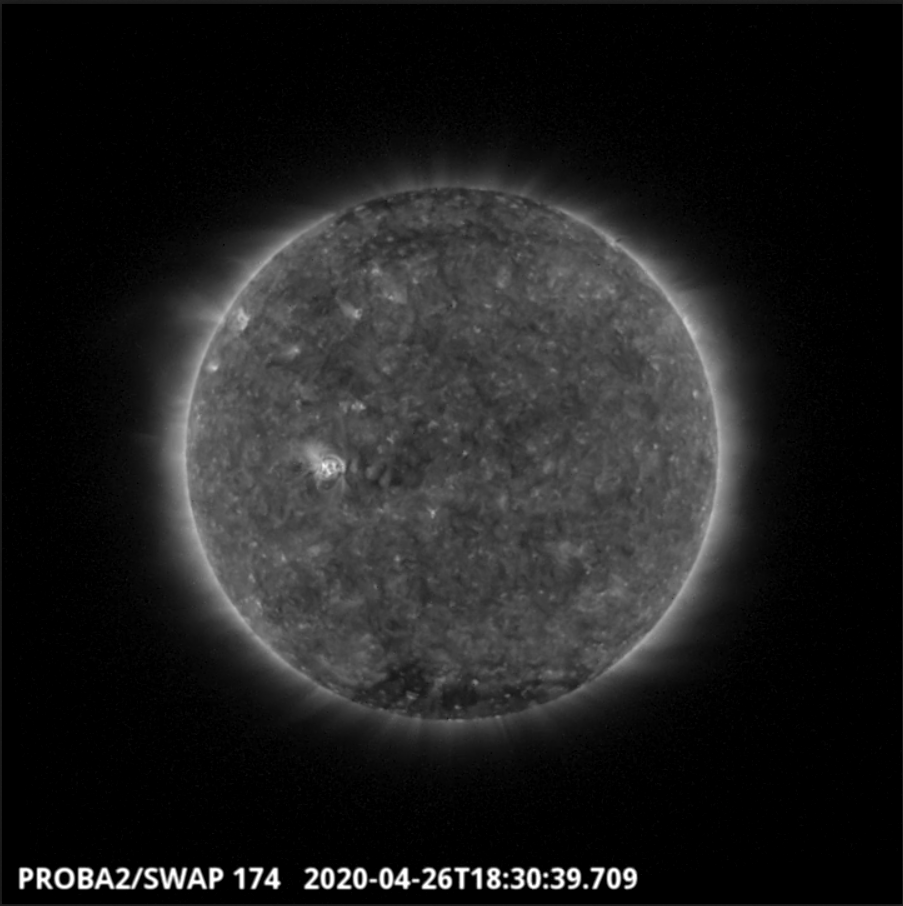
NOAA Active Region 2760 emerged on 2020-Apr-26, as shown in the east of the solar disk in the SWAP image above taken at 18:30 UT, although it has not produced any significant flares.
Find a movie of the day here (SWAP movie): https://proba2.sidc.be/swap/movies/20200426_swap_movie.mp4
The international Sunspot Number by SILSO
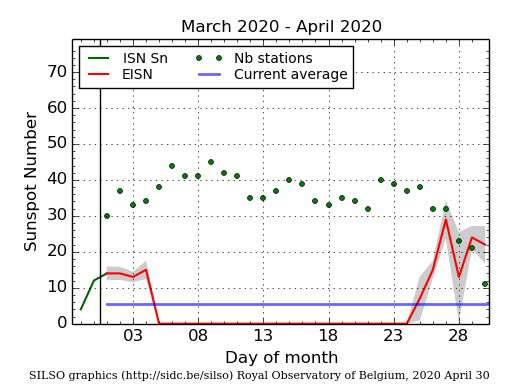
The daily Estimated International Sunspot Number (EISN, red curve with shaded error) derived by a simplified method from real-time data from the worldwide SILSO network. It extends the official Sunspot Number from the full processing of the preceding month (green line). The plot shows the last 30 days (about one solar rotation). The horizontal blue line shows the current monthly average, while the green dots give the number of stations included in the calculation of the EISN for each day.
Geomagnetic Observations at Dourbes (20 Apr 2020 - 26 Apr 2020)
The SIDC space weather Briefing
The Space Weather Briefing presented by the forecaster on duty from April 19 to 26. It reflects in images and graphs what is written in the Solar and Geomagnetic Activity report.
The pdf-version: http://www.stce.be/briefings/20200427_SWbriefing.pdf
The automatically running presentation: http://www.stce.be/briefings/20200427_SWbriefing.ppsm
Review of ionospheric activity (20 Apr 2020 - 26 Apr 2020)
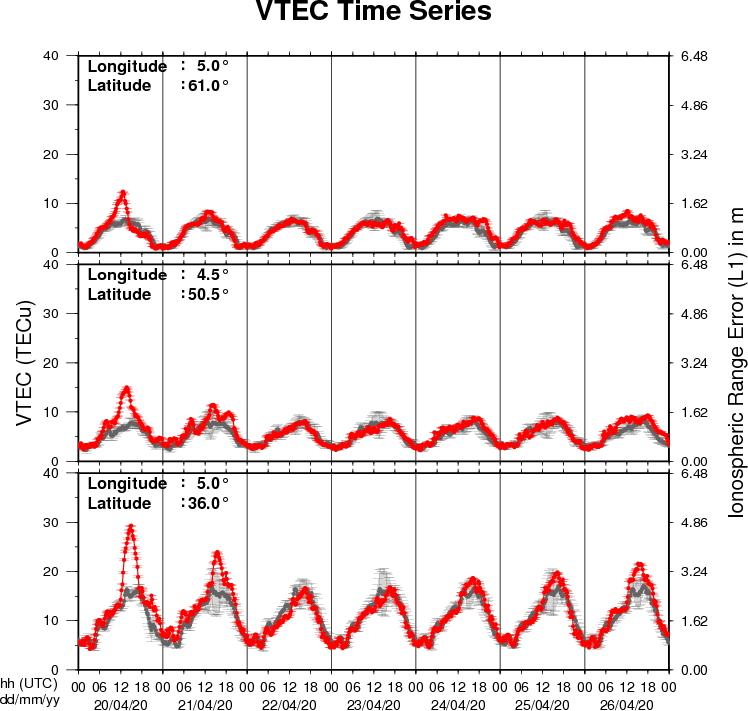
The figure shows the time evolution of the Vertical Total Electron Content (VTEC) (in red) during the last week at three locations:
a) in the northern part of Europe(N61°, 5°E)
b) above Brussels(N50.5°, 4.5°E)
c) in the southern part of Europe(N36°, 5°E)
This figure also shows (in grey) the normal ionospheric behaviour expected based on the median VTEC from the 15 previous days.
The VTEC is expressed in TECu (with TECu=10^16 electrons per square meter) and is directly related to the signal propagation delay due to the ionosphere (in figure: delay on GPS L1 frequency).
The Sun's radiation ionizes the Earth's upper atmosphere, the ionosphere, located from about 60km to 1000km above the Earth's surface.The ionization process in the ionosphere produces ions and free electrons. These electrons perturb the propagation of the GNSS (Global Navigation Satellite System) signals by inducing a so-called ionospheric delay.
See http://stce.be/newsletter/GNSS_final.pdf for some more explanations ; for detailed information, see http://gnss.be/ionosphere_tutorial.php