- Table of Content
- 1.EUI onboard So...
- 2.Active promine...
- 3.Review of sola...
- 4.The SIDC space...
- 5.The Internatio...
- 6.PROBA2 Observa...
- 7.Geomagnetic Ob...
- 8.Review of iono...
2. Active prominences
3. Review of solar and geomagnetic activity
4. The SIDC space weather Briefing
5. The International Sunspot Number by SILSO - new representation
6. PROBA2 Observations
7. Geomagnetic Observations at Dourbes (4 May 2020 - 10 May 2020)
8. Review of ionospheric activity (4 May 2020 - 10 May 2020)
EUI onboard Solar Orbiter ready to observe the Sun, despite COVID-19
The telescopes of the Extreme Ultraviolet Imager (EUI) onboard Solar Orbiter opened their doors on May 12, 2020 to photograph the Sun. This 'First Light' is a milestone, but also a critical step where many things can go wrong. The teams of scientists and operators are forced to work and communicate remotely.
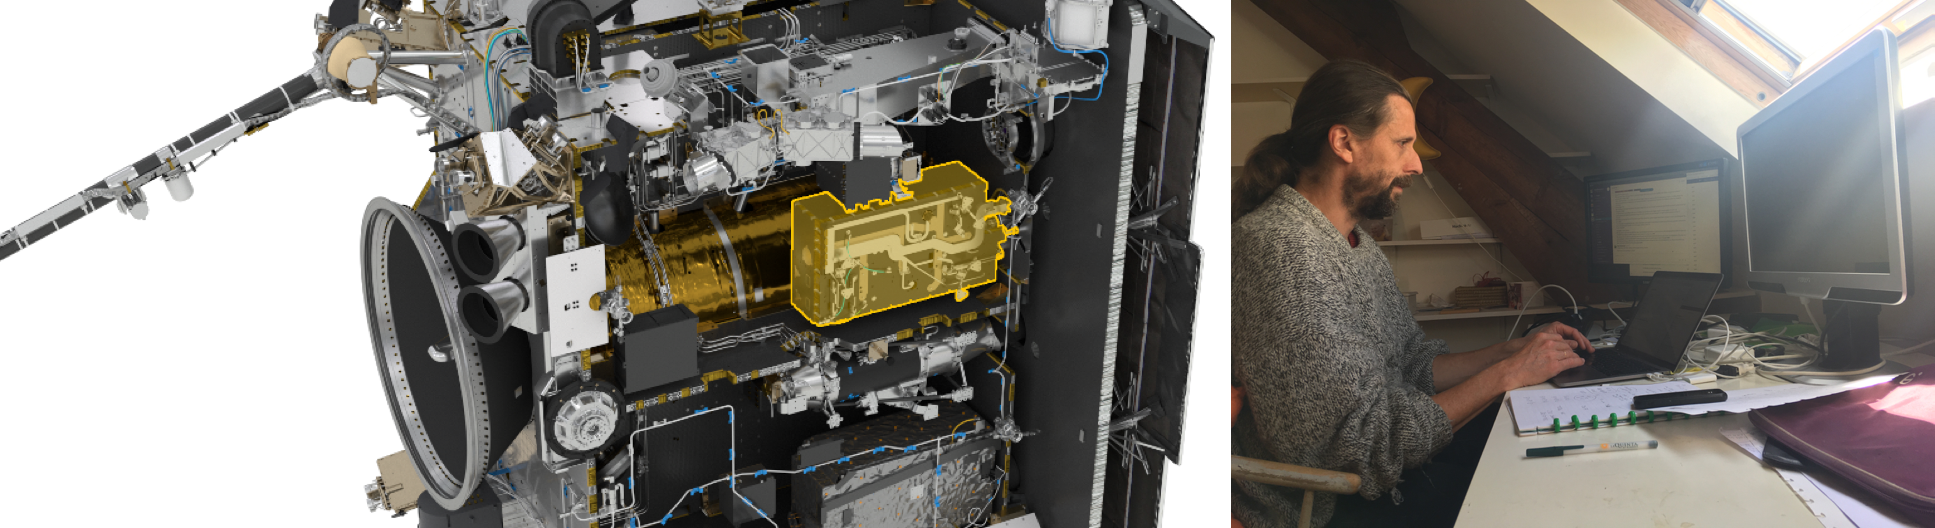
Left: the location of EUI on the space craft. Right: David Berghmans, EUI scientist, working from his remote home office.
EUI observes in the extreme ultraviolet (EUV), a part of the solar light that is blocked by the Earth’s atmosphere. Only telescopes in space can make images in this sort of light. EUV shows us the outer part of the solar atmosphere. But observing in the EUV is not that simple. EUV interacts with contaminants on and in the telescopes, leading to images of less quality. The telescope and the satellite were therefore built in a clean room. When the doors of the EUI telescopes open, it will be checked if the tiny particles of dust that are possibly present can escape and evaporate. Another problem is that the filters that keep the visible light and heat outside and allow the EUV to enter, can easily break.
Hoping for a good ending
When we receive the first image, we will know whether the filters and the cameras are healthy or not. The EUI team is working hard on this, each from his own home office. The EUI team hopes to report next week that everything went fine.
View behind the scenes
The process is interactive: an operator 'talks' continuously with EUI. A message takes now 2,5 minutes from Earth to EUI. The answer of EUI takes also 2,5 minutes.
Normally, EUI operators and scientists are physically present in the ‘Mission Operations’ room in Darmstadt, Germany, where ESA operators are in direct contact with the spacecraft. Because of COVID-19 this is not possible. Everything happens through simultaneous live teleconferences: between the ESA operator and the EUI operator at home, between the EUI operator at home and the EUI scientists at home.
EUI is developed by the 'Centre Spatial de Liège' and the Royal Observatory of Belgium (ROB). 10 people of the ROB have been working non-stop on EUI since the beginning of March. Since March 16, everybody has been working from home. The team continuously discusses with colleagues in other countries. The spirit is good, despite COVID-19.
Following ESA rules, the first light will be shown when the teams of the other instruments onboard Solar Orbiter are ready.
The nerves are tied and we are notified that the caffeine consumption has increased exponentially.
Check out the EUI website: https://wwwbis.sidc.be/EUI/
Active prominences
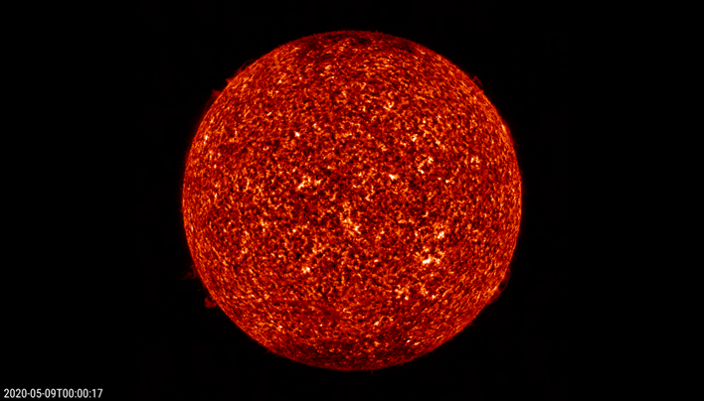
Some interesting and dynamic prominences appeared at the solar limb from 8 till 10 May. Prominences are relatively cool and dense structures reaching all the way up into the corona, i.e. the Sun's hot outer atmosphere. They are clouds of ionized gas above the solar surface squeezed between magnetic regions of opposite polarity. In dedicated filters such as Hydrogen-alpha (H-alpha, 656.3 nm) or in EUV (extreme ultraviolet) such as observed by SDO/AIA 304 at a temperature of about 80,000 degrees, they appear as bright structures hovering over the solar limb. The imagery underneath (AIA 304) shows the most significant prominences, in particular along the northeast (top left) and southeast (bottom left) limb from 8 till 10 May. The dark patches near the Sun's poles are polar coronal holes.
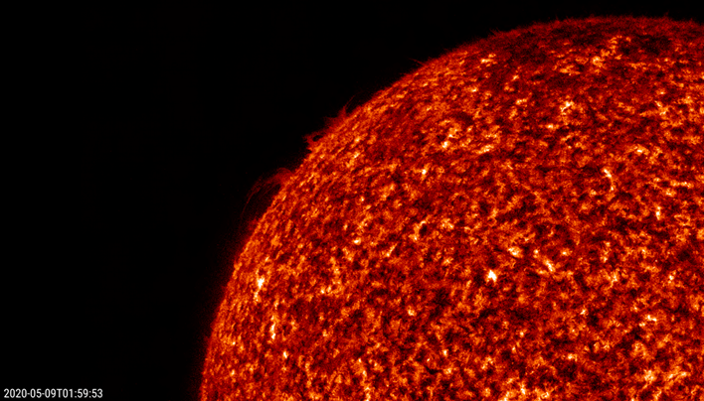
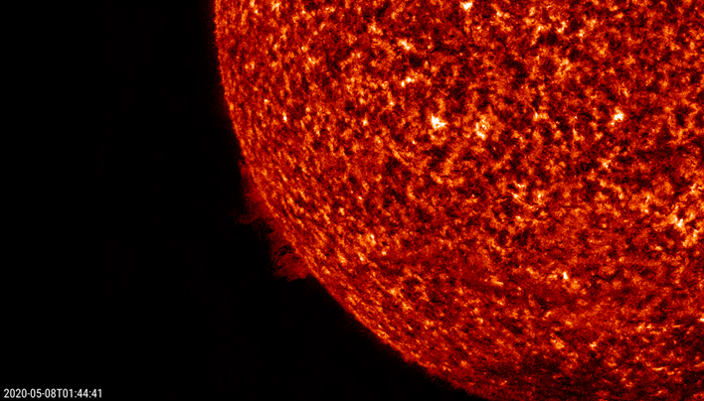
Underneath a zoom of the two largest prominences, with movies (created with JHV) available at http://www.stce.be/news/481/welcome.html . The prominences cover latitudes from around 20 to 50 degrees, partially overlapping with and slightly poleward of the main sunspot belts (in general zero to about 35 degrees). The appearance of more and more dynamic prominences may be another indication we are leaving solar cycle minimum behind us.
Review of solar and geomagnetic activity
SOLAR ACTIVITY
The solar activity was quiet. No sunspot was visible and the X-ray flux was below the B-class level.
No Earth directed Coronal Mass Ejections (CMEs) were observed.
The greater than 10 MeV proton flux was at nominal levels.
The greater than 2 MeV electron flux was nominal to moderate.
GEOMAGNETIC ACTIVITY
The Earth was under the influence of a slow solar wind. The solar wind parameters by DSCOVR were at nominal values. The speed was around 283-340 km/s. The total interplanetary magnetic field was below 7 nT and the Bz component fluctuated between -4 nT and +6 nT.
Geomagnetic conditions were quiet with short periods of unsettled conditions in response to the mild influence of the solar wind associated with the coronal holes.
The SIDC space weather Briefing
The Space Weather Briefing presented by the forecaster on duty from May 3 to 10. It reflects in images and graphs what is written in the Solar and Geomagnetic Activity report.
The pdf-version: http://www.stce.be/briefings/20200511_SWbriefing.pdf
The automatically running presentation: http://www.stce.be/briefings/20200511_SWbriefing.ppsm
The International Sunspot Number by SILSO - new representation
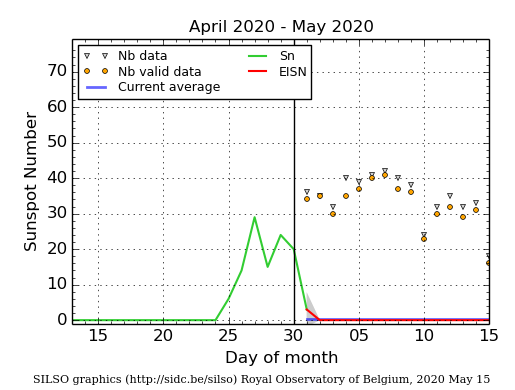
The daily Estimated International Sunspot Number (EISN, red curve with shaded error) derived by a simplified method from real-time data from the worldwide SILSO network. It extends the official Sunspot Number from the full processing of the preceding month (green line). The plot shows the last 30 days (about one solar rotation). The horizontal blue line shows the current monthly average. The yellow dots gives the number of stations that provided valid data. Valid data are used to calculate the EISN. The triangle gives the number of stations providing data. When a triangle and a yellow dot coincide, it means that all the data is used to calculate the EISN of that day.
PROBA2 Observations
Solar Activity
Solar flare activity was very low during the week.
In order to view the activity of this week in more detail, we suggest to go to the following website from which all the daily (normal and difference) movies can be accessed: https://proba2.oma.be/ssa
This page also lists the recorded flaring events.
A weekly overview movie can be found here (SWAP week 528): https://proba2.sidc.be/swap/data/mpg/movies/weekly_movies/weekly_movie_2020_05_04.mp4
Details about some of this week's events can be found further below.
If any of the linked movies are unavailable they can be found in the P2SC movie repository here: https://proba2.oma.be/swap/data/mpg/movies/
Saturday May 09
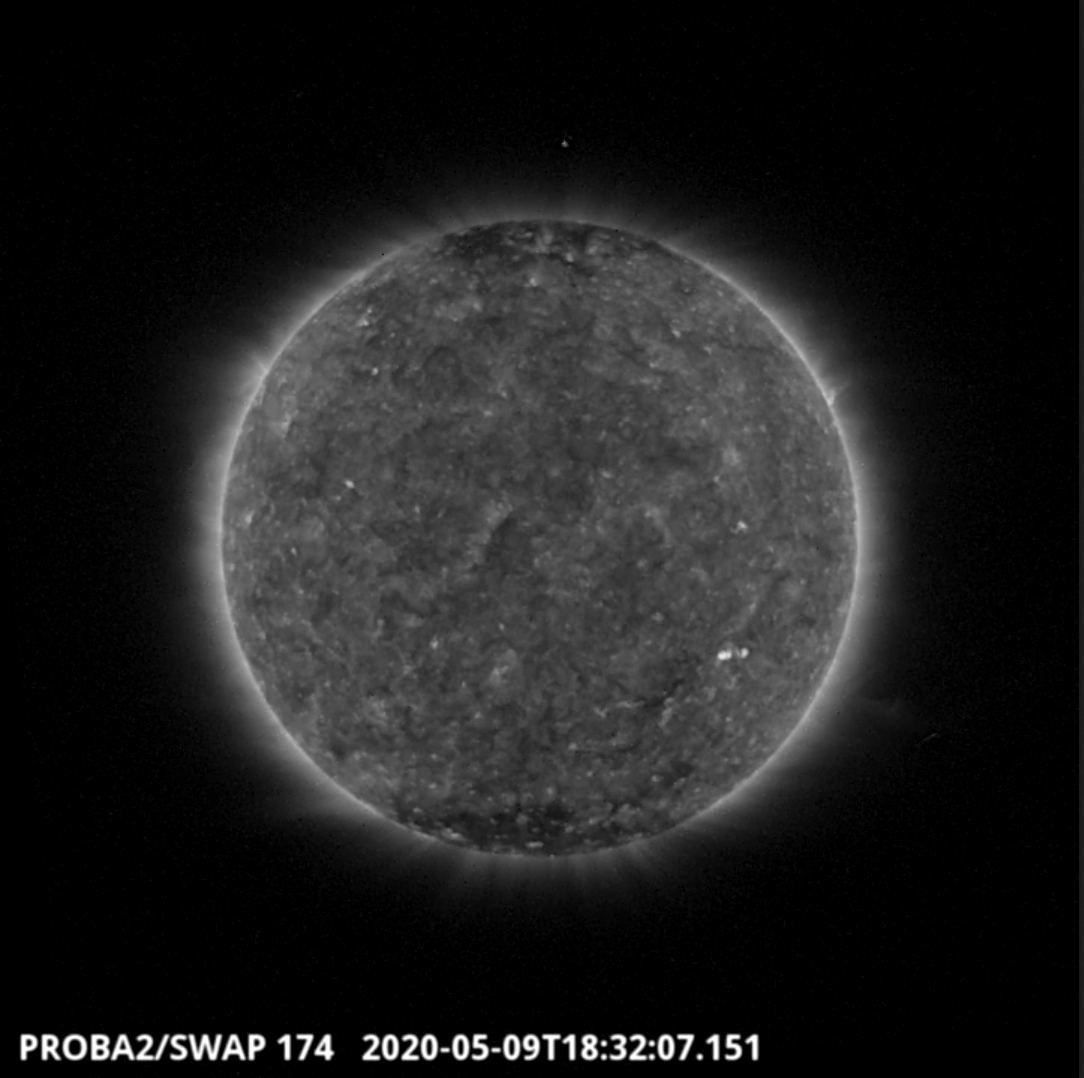
An eruption was observed by SWAP on the south-west limb of the Sun on 2020-May-09 as shown in the SWAP image above taken at 18:32 UT.
Find a movie of the event here (SWAP movie): https://proba2.sidc.be/swap/movies/20200509_swap_movie.mp4
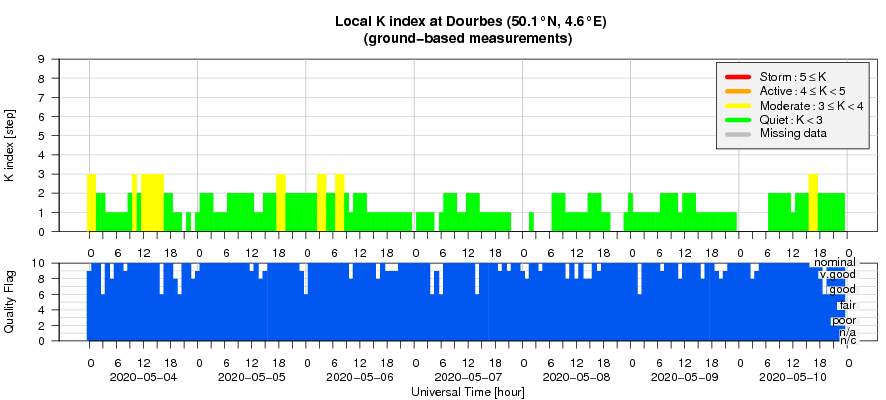
Geomagnetic Observations at Dourbes (4 May 2020 - 10 May 2020)
Review of ionospheric activity (4 May 2020 - 10 May 2020)

The figure shows the time evolution of the Vertical Total Electron Content (VTEC) (in red) during the last week at three locations:
a) in the northern part of Europe(N61°, 5°E)
b) above Brussels(N50.5°, 4.5°E)
c) in the southern part of Europe(N36°, 5°E)
This figure also shows (in grey) the normal ionospheric behaviour expected based on the median VTEC from the 15 previous days.
The VTEC is expressed in TECu (with TECu=10^16 electrons per square meter) and is directly related to the signal propagation delay due to the ionosphere (in figure: delay on GPS L1 frequency).
The Sun's radiation ionizes the Earth's upper atmosphere, the ionosphere, located from about 60km to 1000km above the Earth's surface.The ionization process in the ionosphere produces ions and free electrons. These electrons perturb the propagation of the GNSS (Global Navigation Satellite System) signals by inducing a so-called ionospheric delay.
See http://stce.be/newsletter/GNSS_final.pdf for some more explanations ; for detailed information, see http://gnss.be/ionosphere_tutorial.php