- Table of Content
- 1.A burst in fla...
- 2.Review of sola...
- 3.PROBA2 Observa...
- 4.Noticeable Sol...
- 5.The Internatio...
- 6.Review of geom...
- 7.Geomagnetic Ob...
- 8.Review of iono...
2. Review of solar activity
3. PROBA2 Observations
4. Noticeable Solar Event
5. The International Sunspot Number by SILSO - new representation
6. Review of geomagnetic activity
7. Geomagnetic Observations at Dourbes
8. Review of ionospheric activity
A burst in flaring activity
During the last months, solar cycle 25 (SC25) has been giving us already a few signs of its gradual awakening, with some small sunspot groups and low-level flaring activity (B-class). So nothing unusual seemed to be in the offing when a new active region well behind the northeastern solar limb started producing some minor flares during the afternoon of 27 May. The location of the bright EUV (extreme ultraviolet) patch near +35 degrees latitude indicated it belonged to the new solar cycle.
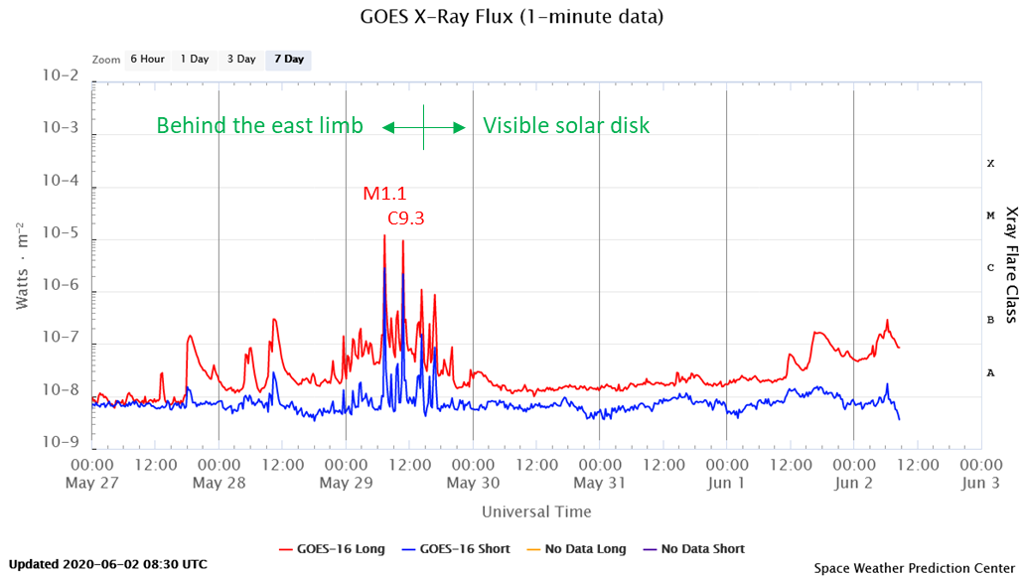
Then on 29 May the region, while still behind the solar limb, shifted its activity into a higher gear producing an M1.1 flare at 07:24UT and a C9.3 flare near 10:46UT (see the annotated GOES-16 x-ray flux curve above). This was the first M-class (M as in "moderate") event since 20 October 2017. The eruptions were associated with some weak radio-bursts, as detected by the radioastronomy station in Humain (http://www.sidc.be/humain/ ).
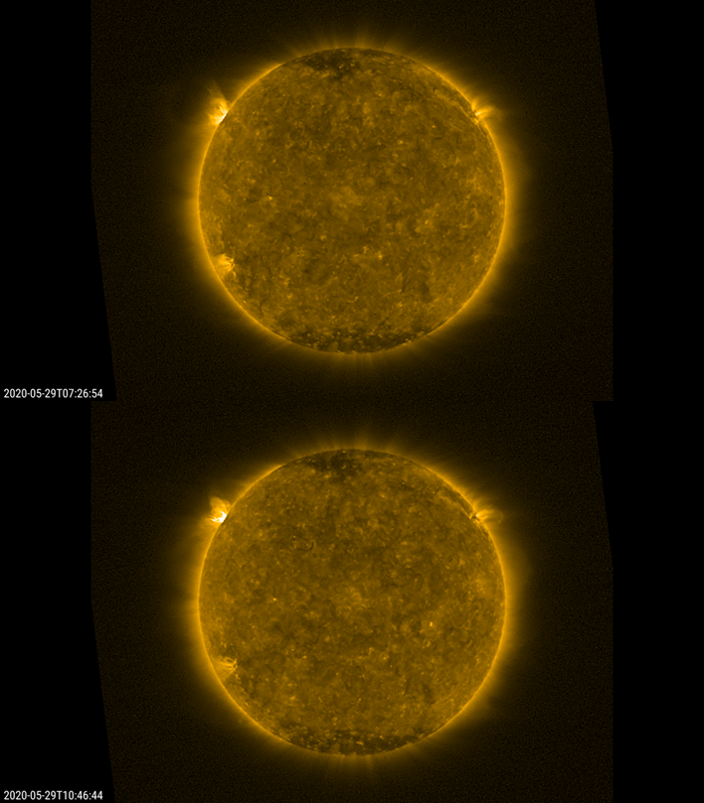
A view on the M1 (top) and C9 (bottom) flare as seen by PROBA2/SWAP.
The PROBA2/SWAP camera revealed some EIT waves moving along the eastern limb mainly to the south. These are bright wave fronts that can be seen propagating through the corona (Sun's hot atmosphere) and are associated with coronal mass ejections (CMEs). This STCE newsitem http://www.stce.be/news/241/welcome.html provides more info on these waves. STEREO-A had the best view on the eruptions and in particular these EIT waves, as its current location is very near the solar east limb as seen from Earth. From the point of view of STEREO-A, it means that the active region was close to its central meridian (see imagery below). The dynamic and relatively bright fronts of the EIT waves can easily be seen in imagery by STEREO-A's EUVI instrument - also an EUV camera.
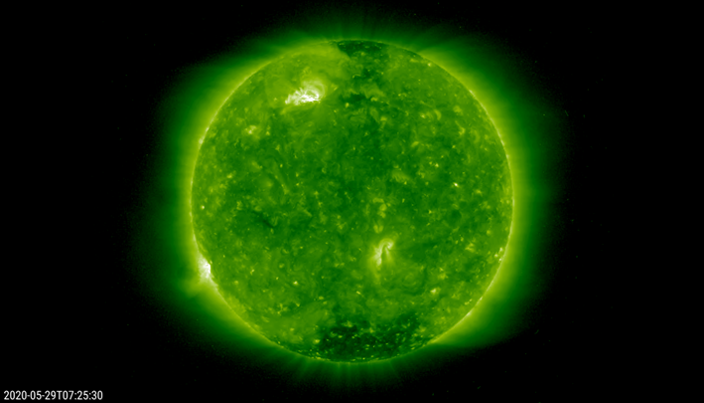
A view on the M1 flare as seen by STEREO-A/EUVI. The source is the bright region in the northern solar hemisphere very close to the central meridian.
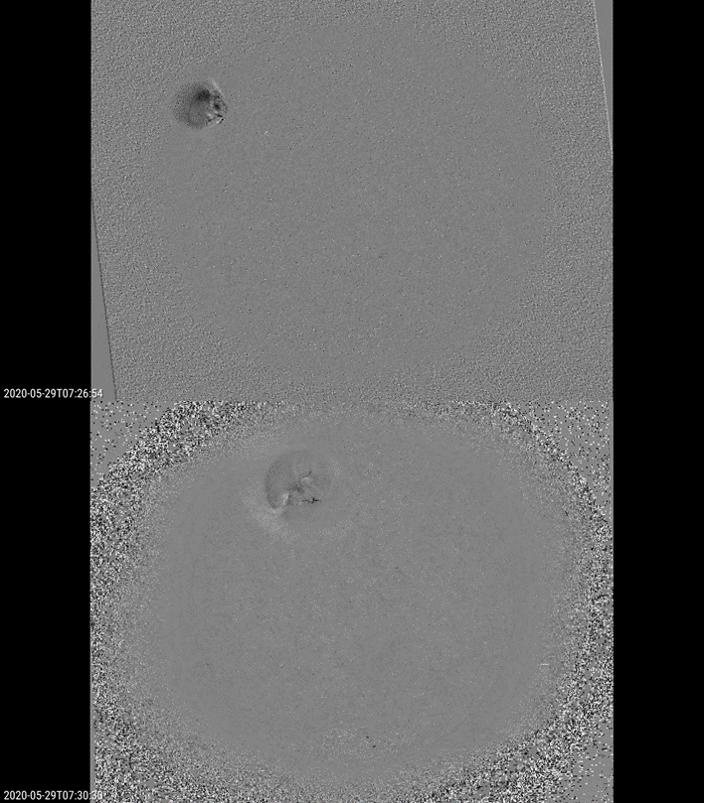
A view on the EIT wave shortly after the M1 flare as seen by by PROBA2 (top) and STEREO-A (bottom). The difference in size is from image handling and a 4 minute delay between the two images. These concern difference images, i.e. one image subtracted from the other.
Not only the strength of the two flaring events are very similar, also the outlook of both eruptions was a close match. The SUVI instrument (Solar Ultraviolet Imager) onboard the GOES-16 satellite (https://www.swpc.noaa.gov/products/goes-solar-ultraviolet-imager-suvi ) recorded some impressive images from these eruptions (below). In both instances, the event starts out as the typical balloon-like eruption billowing away from the Sun. The imagery then clearly shows how the northern part seems to bump into the fanning, overarching magnetic field of the Sun's northern polar coronal hole, getting deflected towards the east ("left") as if it had hit a brick wall. Consequently also the resulting CMEs had a very similar (and very deformed) outlook, as can be seen in the SOHO/LASCO C2 images.
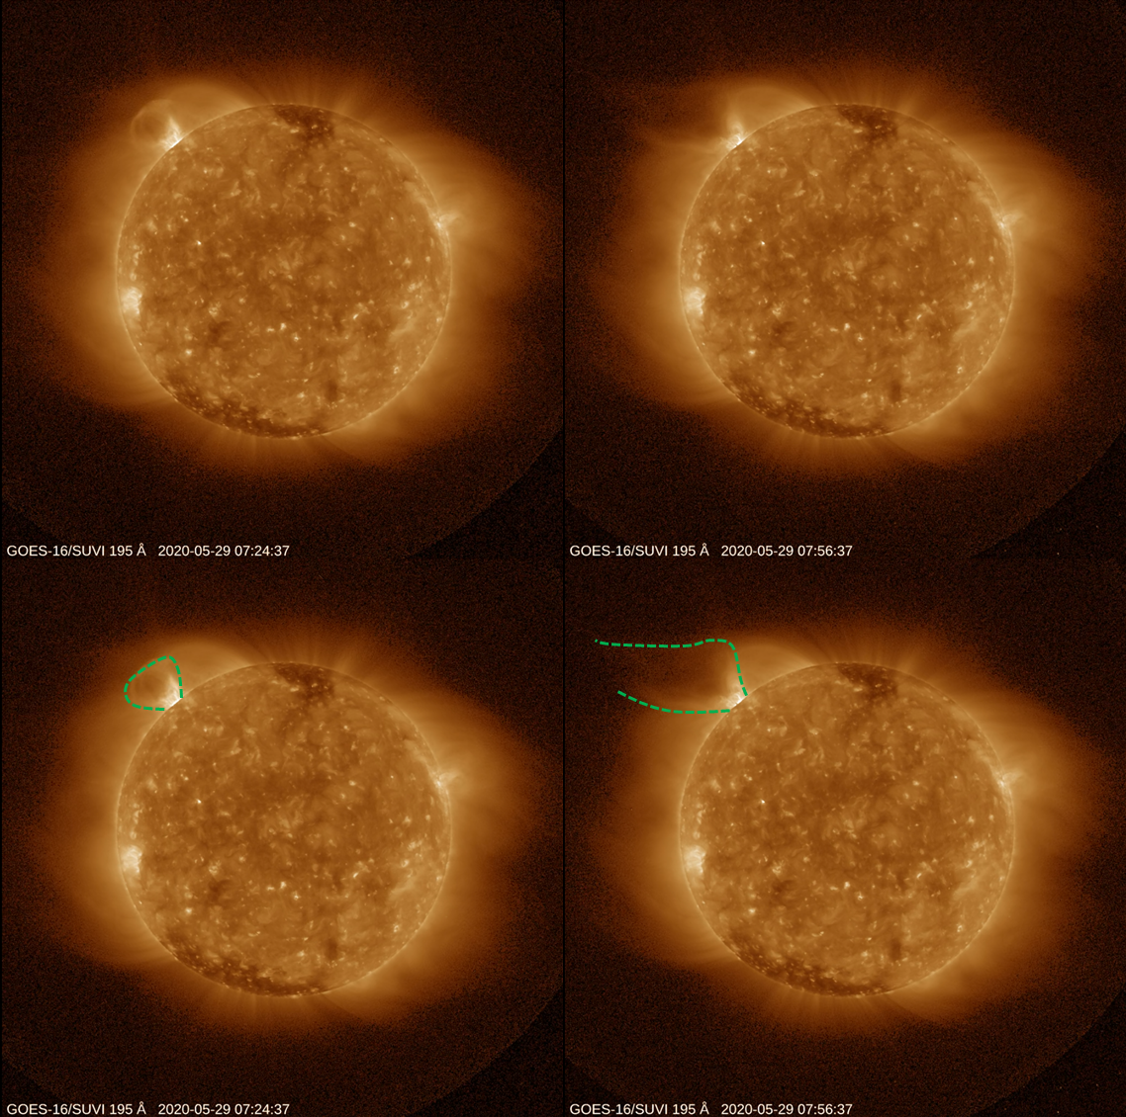
The initial ejection and the deflected stage associated with the M1 flare as seen by the GOES-16/SUVI instrument.
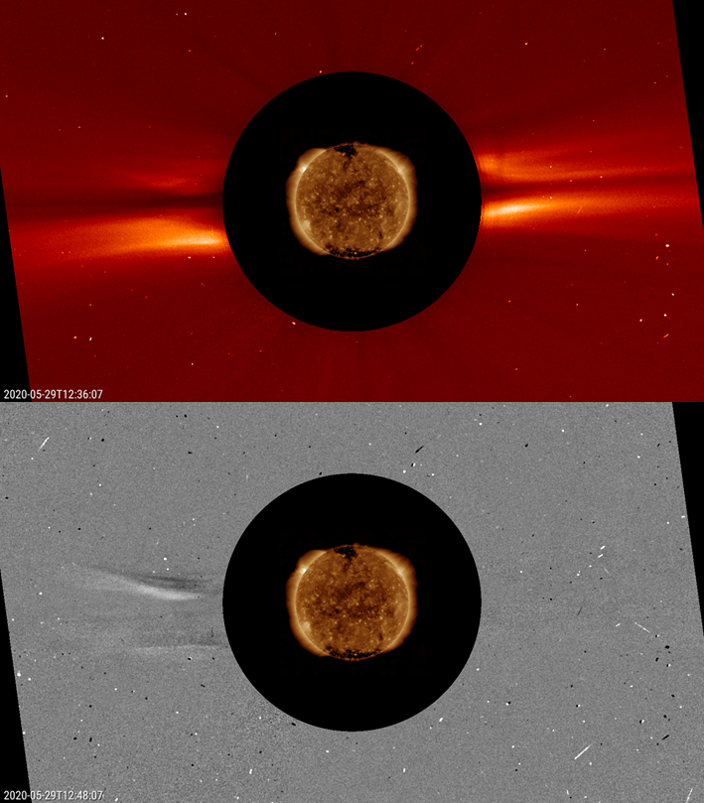
Coronagraphic image (top) and difference image (bottom) of the CME associated with the C9 flare as seen by SOHO/LASCO C2.
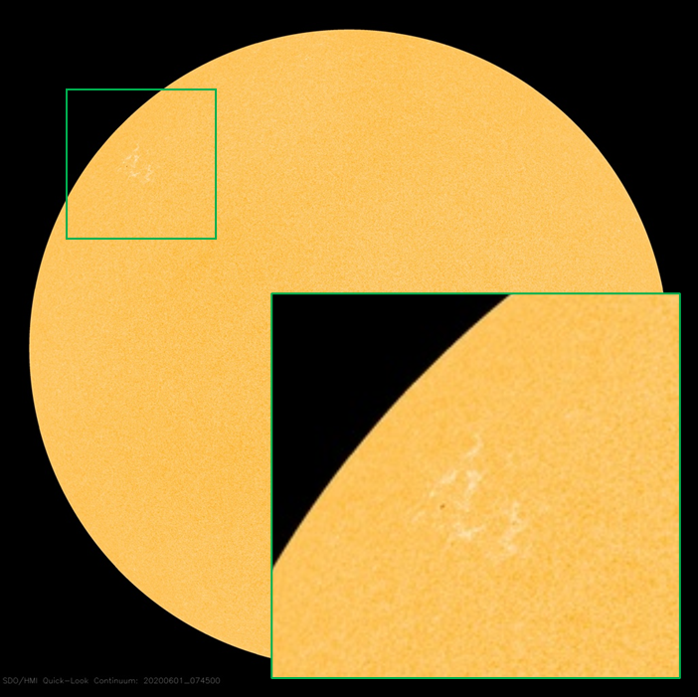
When the region had finally rotated over the east limb, only a very small spot was remaining, barely visible even in larger telescopes (see SDO/HMI imagery and inset below). The region got finally numberered on 1 June as NOAA 2764. As can be seen in the GOES-16 x-ray flux curve, all activity had died down by then.
Movies associated with this newsitem can be found online at http://www.stce.be/news/484/welcome.html
Review of solar activity
During this week 16 B-class, 2 C-class flares and 1 M-class flare were reported. These flares were observed in the time interval May 27 to May 29, when the not-numbered source region rotated from the behind of the North-East solar limb to the visible side of the Sun. The M 1.1 flare peak at 07:24 UT on May 29, and was accompanied by a narrow CME.
Several CMEs were observed, but the majority of them was narrow and slow, including the CMEs associated with the flares from the not-numbered active region. The CME observed above the west solar limb early on May 26 was considered as possibly Earth directed, although its solar source was not completely clear.
The solar protons remained at the background level.
Two negative polarity coronal holes were observed. The low latitude extension of the southern polar coronal hole reached the central on May 25. The second small equatorial coronal hole reached the central meridian on May 27.
PROBA2 Observations
Solar Activity
Solar flare activity fluctuated between very low and moderate during the week.
In order to view the activity of this week in more detail, we suggest to go to the following website from which all the daily (normal and difference) movies can be accessed: https://proba2.oma.be/ssa
This page also lists the recorded flaring events.
A weekly overview movie can be found here (SWAP week 531) http://proba2.oma.be/swap/data/mpg/movies/weekly_movies/weekly_movie_2020_05_25.mp4
Details about some of this week's events can be found further below.
If any of the linked movies are unavailable they can be found in the P2SC movie repository here https://proba2.oma.be/swap/data/mpg/movies/
Monday May 25
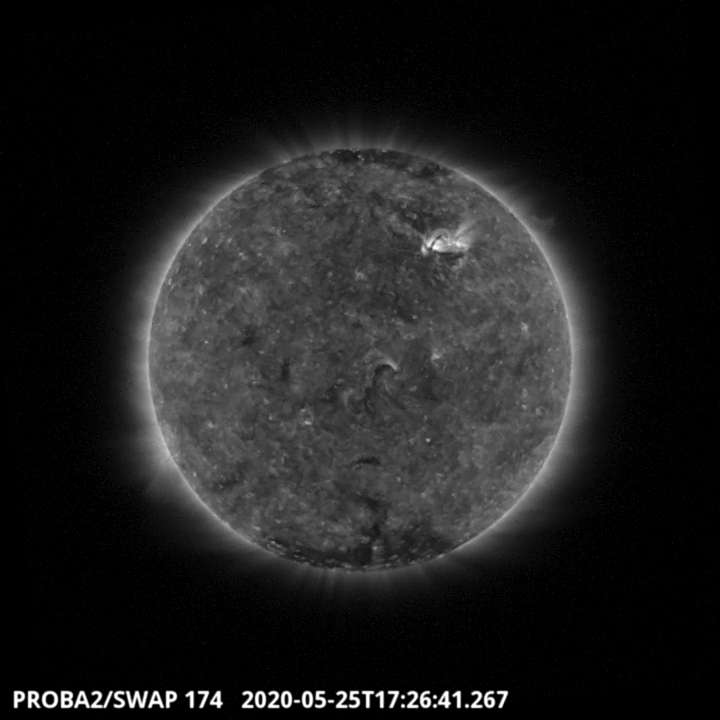
A large southern polar coronal hole was seen extending to central latitudes at the beginning of last week. This can be seen in the SWAP image above on 2020-May-25. Find a movie of the events here (SWAP movie) http://proba2.oma.be/swap/data/mpg/movies/20200525_swap_movie.mp4
Thursday May 28
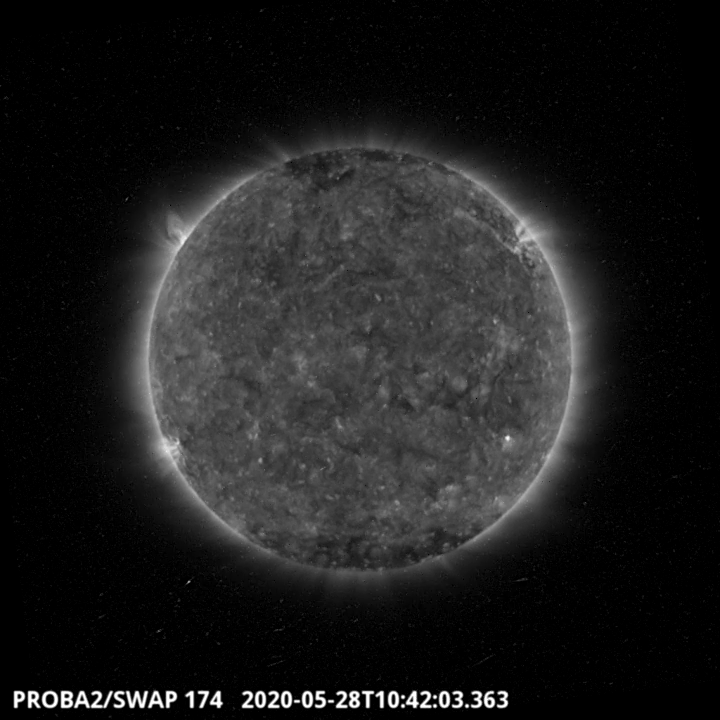
On the North East solar limb an active region emerged on Wednesday, the region produced B flares, one of them was visible around 10:42 UT, as seen in the SWAP image above. Find a movie of the events here (SWAP movie) http://proba2.oma.be/swap/data/mpg/movies/20200528_swap_movie.mp4
Friday May 29
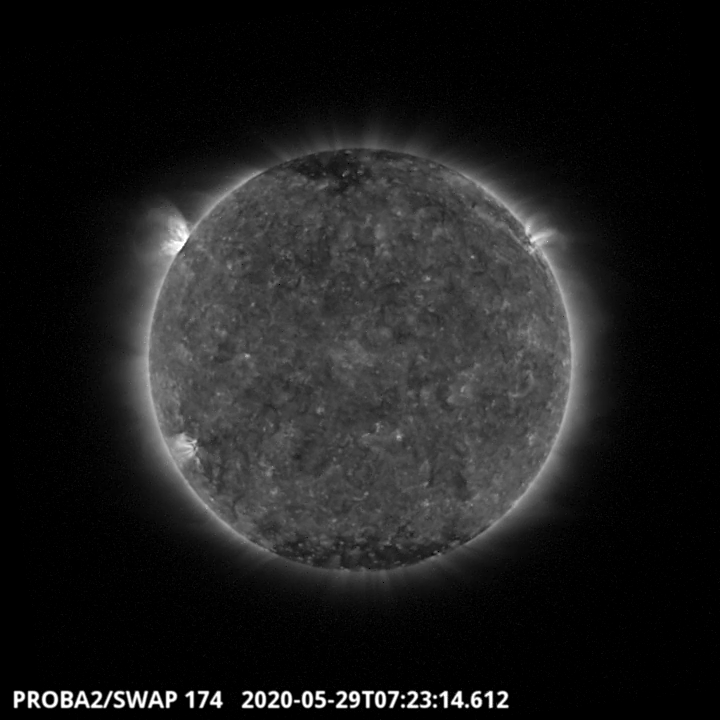
An Active region, observed just beyond the North East solar limb, produced an eruption and an M1.1 class flare on 2020-May-29, as can be seen in the above image from 07:23 UT. Find a movie of the events here (SWAP movie) http://proba2.oma.be/swap/data/mpg/movies/20200529_swap_movie.mp4
Noticeable Solar Event
X-ray flare class: M1.1
29 May 2020 - BEGIN 07:13 UT - MAX 07:24 UT - END 07:28 UT
Radio Burst TYPE III/2
No Catania sunspot group number - No NOAA active region number - No heliographic location
The International Sunspot Number by SILSO - new representation
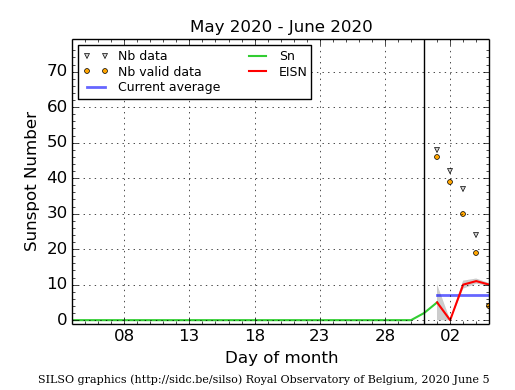
The daily Estimated International Sunspot Number (EISN, red curve with shaded error) derived by a simplified method from real-time data from the worldwide SILSO network. It extends the official Sunspot Number from the full processing of the preceding month (green line). The plot shows the last 30 days (about one solar rotation). The horizontal blue line shows the current monthly average. The yellow dots gives the number of stations that provided valid data. Valid data are used to calculate the EISN. The triangle gives the number of stations providing data. When a triangle and a yellow dot coincide, it means that all the data is used to calculate the EISN of that day.
Review of geomagnetic activity
Earth was most of the time inside a slow solar wind with a speed between 290 and 340 km/s. The interplanetary magnetic field (IMF) ranged between 3 to 5 nT.
Around 19:20 UT on May 29, the IMF increased slowly simultaneously with the solar wind speed, temperature and density. The IMF reached 14 nT, its Bz component went down to -12 nT. On May 30, the IMF in the ecliptic plane switched from the positive (out of the Sun) to the negative (in to the Sun) sector. These changes in the L1 point, indicated the arrival of the solar wind from the negative polarity coronal hole. Although it is difficult to clearly distinguish between the extension of the southern polar coronal hole or the small equatorial coronal hole as the source of this solar wind (they both have negative polarity), it is more probable that the wind originated from the extension of the southern polar coronal hole that crossed central meridian earlier.
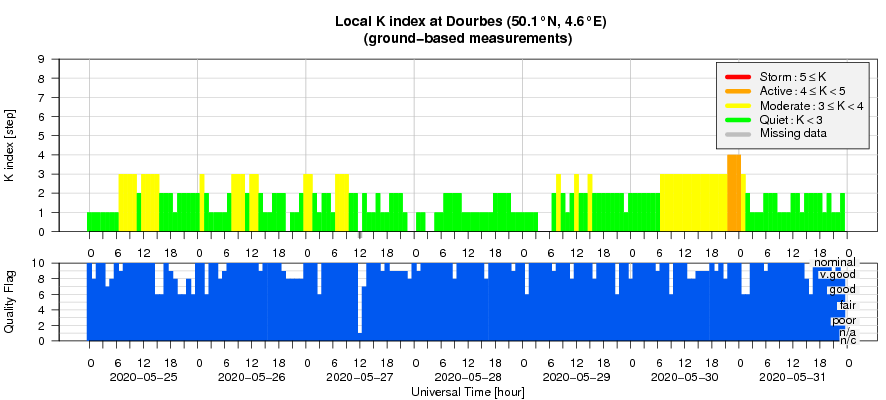
The geomagnetic conditions were quiet with a few intervals of unsettled conditions. One active interval (K=4) was reported by the local station at Dourbes (from about 21:00 UT until the 24:00 UT on May 30).
Geomagnetic Observations at Dourbes
Review of ionospheric activity
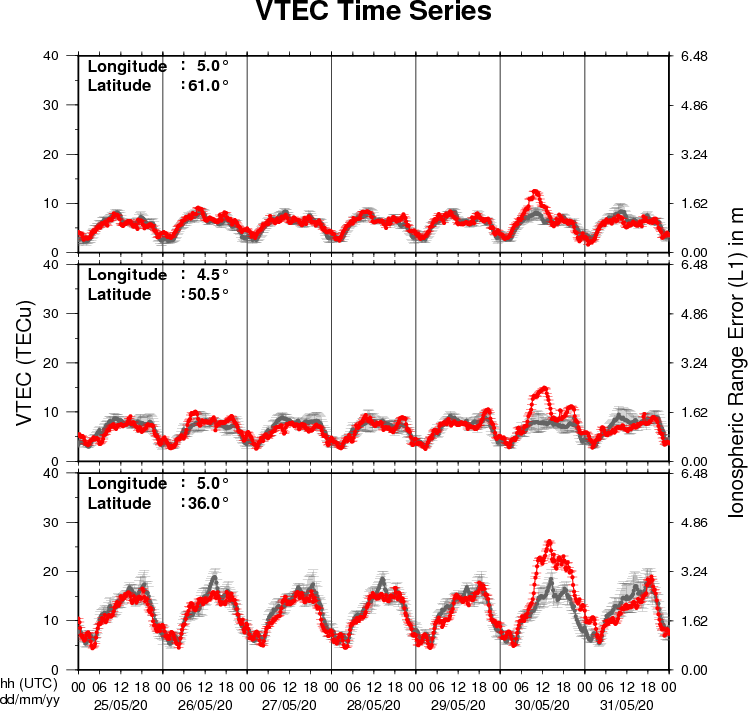
The figure shows the time evolution of the Vertical Total Electron Content (VTEC) (in red) during the last week at three locations:
a) in the northern part of Europe(N61°, 5°E)
b) above Brussels(N50.5°, 4.5°E)
c) in the southern part of Europe(N36°, 5°E)
This figure also shows (in grey) the normal ionospheric behaviour expected based on the median VTEC from the 15 previous days.
The VTEC is expressed in TECu (with TECu=10^16 electrons per square meter) and is directly related to the signal propagation delay due to the ionosphere (in figure: delay on GPS L1 frequency).
The Sun's radiation ionizes the Earth's upper atmosphere, the ionosphere, located from about 60km to 1000km above the Earth's surface.The ionization process in the ionosphere produces ions and free electrons. These electrons perturb the propagation of the GNSS (Global Navigation Satellite System) signals by inducing a so-called ionospheric delay.
See http://stce.be/newsletter/GNSS_final.pdf for some more explanations ; for detailed information, see http://gnss.be/ionosphere_tutorial.php