- Table of Content
- 1.ISS transits t...
- 2.Review of sola...
- 3.The internatio...
- 4.PROBA2 Observa...
- 5.Review of geom...
- 6.Geomagnetic Ob...
- 7.The SIDC space...
- 8.Review of iono...
2. Review of solar activity
3. The international Sunspot Number by SILSO
4. PROBA2 Observations (1 Jun 2020 - 7 Jun 2020)
5. Review of geomagnetic activity
6. Geomagnetic Observations at Dourbes (1 Jun 2020 - 7 Jun 2020)
7. The SIDC space weather Briefing
8. Review of ionospheric activity (1 Jun 2020 - 7 Jun 2020)
ISS transits the Sun
On Saturday at 14:02:16 UTC, the USET solar telescopes (USET: Uccle Solar Equatorial Table - http://www.sidc.be/uset/ ) of the Royal Observatory of Belgium (ROB) imaged a transit of the International Space Station (ISS). ISS is the largest artificial object in space and it flies in a low Earth orbit at about 400 km altitude. Hence, this satellite can be seen with the naked eye as a moving bright point from the Earth's surface at night.
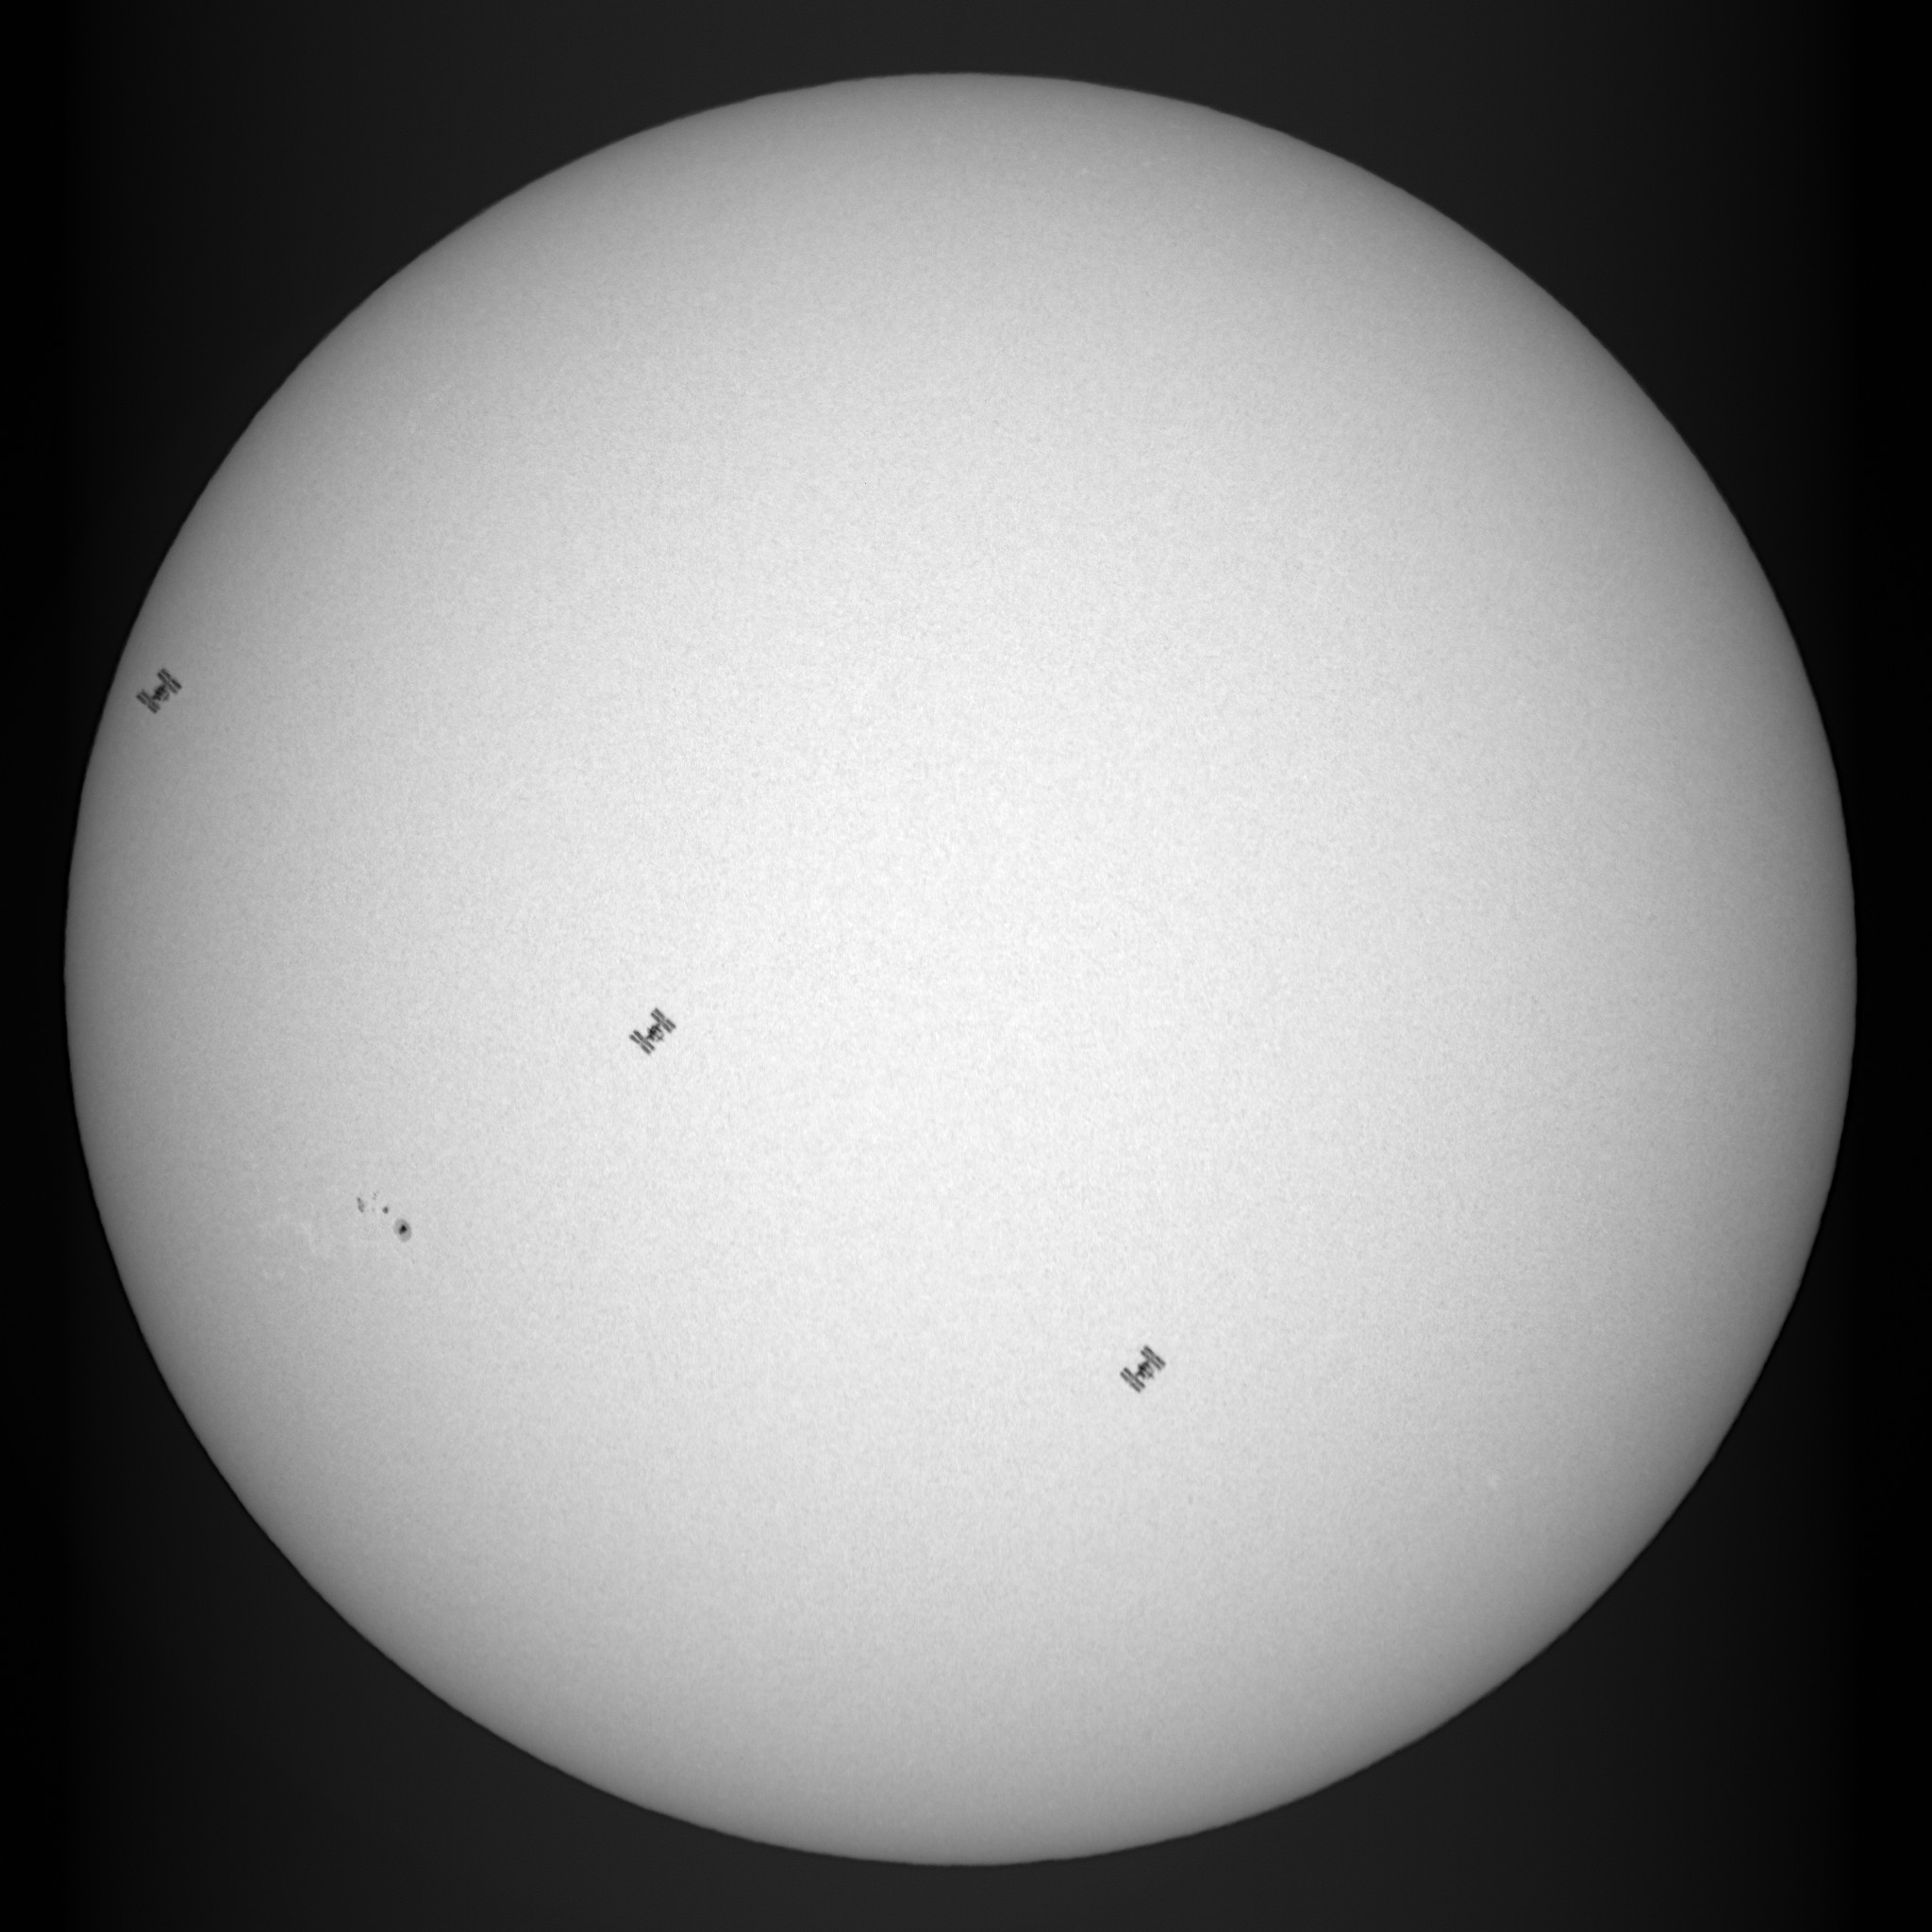
In the image above, the ISS appears as three successive black structures taken at around 250 milliseconds interval each. The striking feature of the ISS -its large solar panels- are nicely resolved with the white-light telescope at ROB. As the ISS moves fast (about 8 km/s), the total transit duration is very short, being only a fraction of a second (0.8 seconds for this event), hence it needs a fast recording camera to be caught.
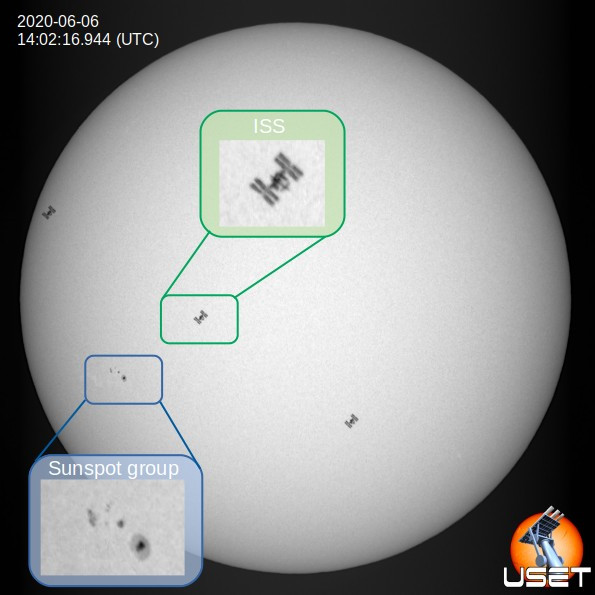
One of the prime goals of USET is to monitor the solar activity by the observation of groups of dark spots covering the solar surface. A nice illustration of such sunspot group can be seen on the left side of the solar disk (see annotated image above). While being of medium size, this active region is very interesting as it is one of the first sunspot groups of the new solar cycle (see also the STCE Newsitem at http://www.stce.be/news/422/welcome.html ).
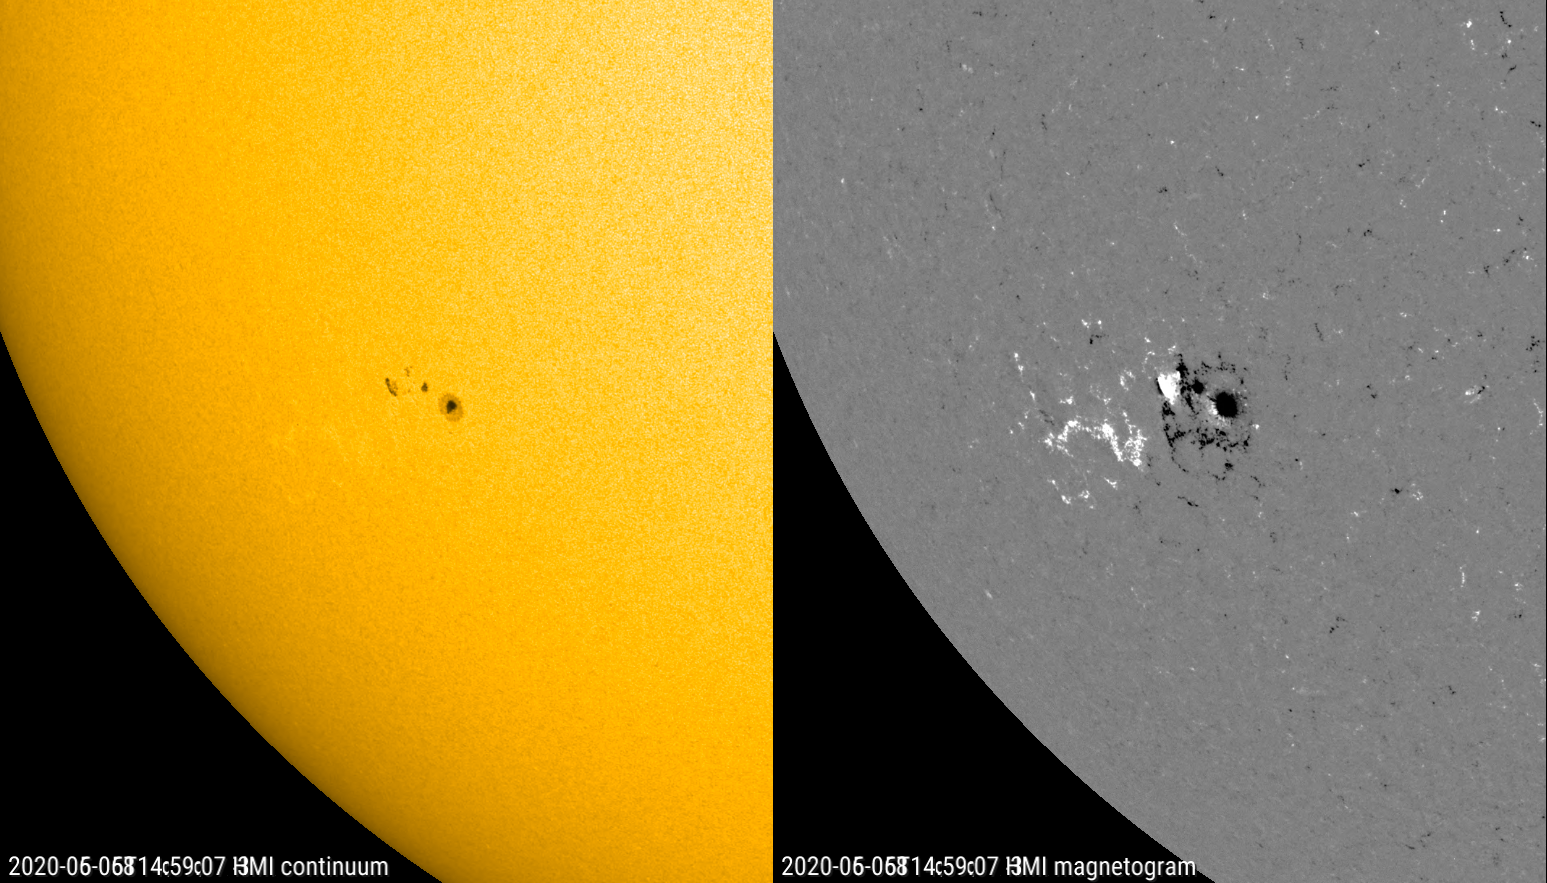
NOAA 2765 actually consisted of the initial single sunspot that rotated over the east limb early on 3 June, and a new small bipolar region that emerged on 5 June close to and to the northeast of this original sunspot. This can be seen in the SDO/HMI white light and magnetogram imagery above, with the white patches indicating where the magnetic field is coming out of the solar surface, and the black color indicates where the magnetic field is returning to the solar interior. Only where the magnetic field is sufficiently concentrated, sunspots can appear. The observed evolution of the sunspots explains the somewhat peculiar outlook of the sunspot group -as remarked by a number of amateur and professional solar observers-, with the main leading spot being oriented away from the equator compared to the trailing spots. Usually, it's just the other way around: the leading spot is tilted more to the solar equator than the trailing spot. Of course, being so close together (separation of only about 2-3 degrees), the spots have to be classified as a single region. This is because sunspot grouping and group classification has to be done based on visual observations only, to remain consistent with historical observations when magnetograms were not available. NOAA 2765 was one of the largest sunspot regions of the new solar cycle so far, but it has remained flare inactive (flaring level below C-class).
Review of solar activity
Solar X-ray flux remained below C level. Several B flares were reported. These were all related to NOAA region 2765, even before it rotated on the solar disk. The region evolved from a unipolar region as it turned into view, into a bipolar region.
NOAA region 2764, which was the region responsible for the M flare last week, decayed into a plage.
There were no Earth directed Coronal Mass Ejections (CMEs) observed in coronagraph data.
The greater than 10 MeV proton flux levels were at background values.
The greater than 2 MeV electron flux has been nominal.
Faint low latitude positive polarity coronal hole parches were visible, apparently connected to the northern polar coronal hole. The in situ solar wind effects related to this, was difficult to forecast but did eventually occur.
The international Sunspot Number by SILSO
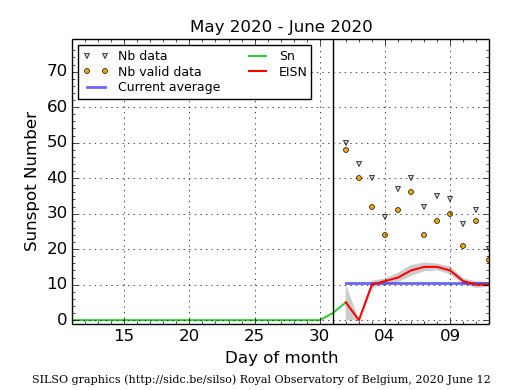
The daily Estimated International Sunspot Number (EISN, red curve with shaded error) derived by a simplified method from real-time data from the worldwide SILSO network. It extends the official Sunspot Number from the full processing of the preceding month (green line). The plot shows the last 30 days (about one solar rotation). The horizontal blue line shows the current monthly average. The yellow dots gives the number of stations that provided valid data. Valid data are used to calculate the EISN. The triangle gives the number of stations providing data. When a triangle and a yellow dot coincide, it means that all the data is used to calculate the EISN of that day.
PROBA2 Observations (1 Jun 2020 - 7 Jun 2020)
Solar Activity
Solar flare activity was very low during the week.
In order to view the activity of this week in more detail, we suggest to go to the following website from which all the daily (normal and difference) movies can be accessed: https://proba2.oma.be/ssa
This page also lists the recorded flaring events.
A weekly overview movie can be found here (SWAP week 532): https://proba2.sidc.be/swap/data/mpg/movies/weekly_movies/weekly_movie_2020_06_01.mp4
Details about some of this week's events can be found further below.
If any of the linked movies are unavailable they can be found in the P2SC movie repository here: https://proba2.oma.be/swap/data/mpg/movies/
Monday Jun 01
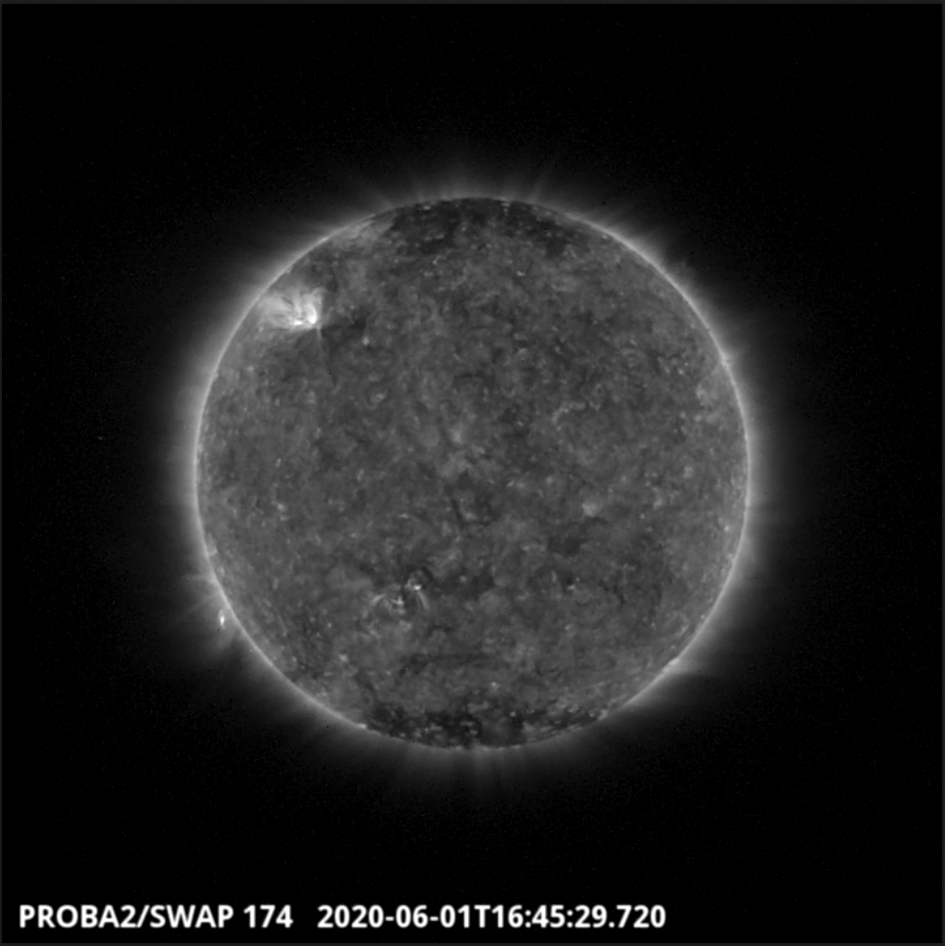
An eruption was observed by SWAP on the south-east limb of the Sun on 2020-Jun-01 as shown in the SWAP image above taken at 16:45 UT.
Find a movie of the event here (SWAP movie): https://proba2.sidc.be/swap/movies/20200601_swap_movie.mp4
Sunday Jun 07
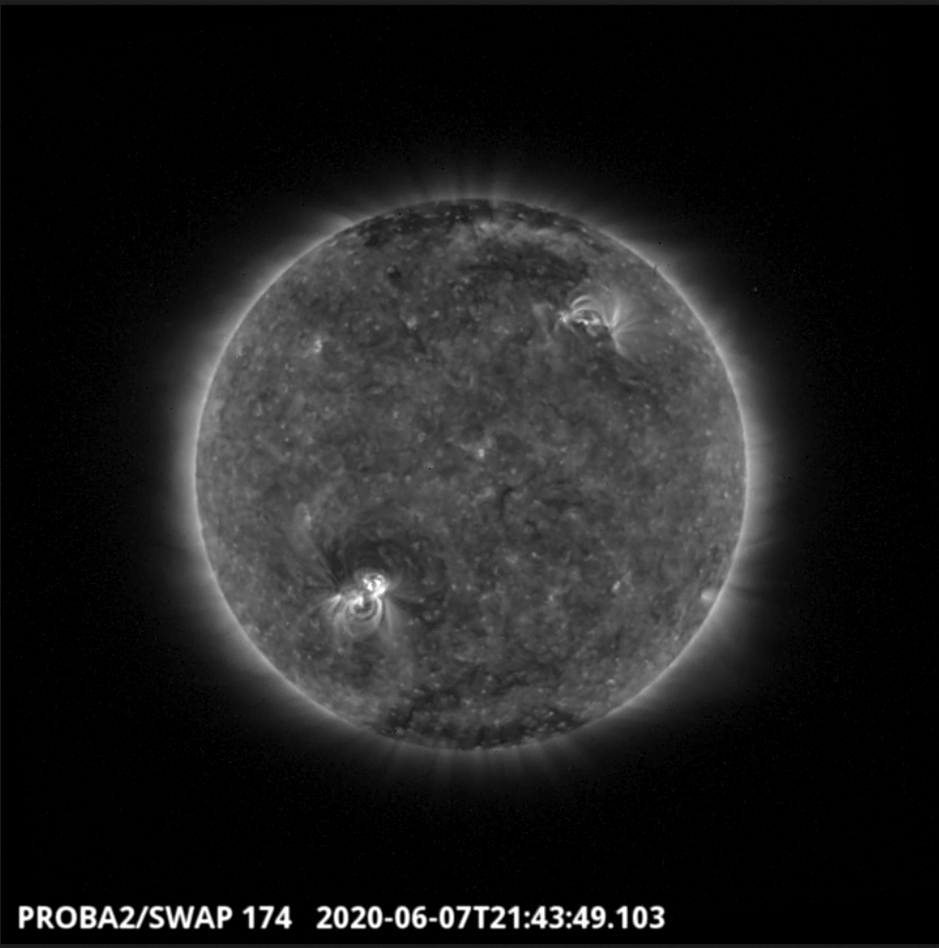
The largest flare of the week (B6.4), which was associated with NOAA AR 2765, was observed by SWAP on 2020-Jun-07 and is visible in the south-east of the solar disk in the SWAP image above taken at 21:43 UT.
Find a movie of the event here (SWAP movie): https://proba2.sidc.be/swap/movies/20200607_swap_movie.mp4
Review of geomagnetic activity
The solar wind was predominantly in a close to nominal regime. The wind showed a general decaying trend from around 400 km/s to around 300 km/s in the morning of June 7. The total magnetic field was in that period mostly around or below 5nT apart from a period on June 1-2 when total magnetic field reached 7nT and Bz was consistently negative. The magnetic field phi angle fluctuated throughout the week. In the morning of June 7, the situation changed and the solar wind speed increased. This increase was associated with the patchy coronal hole regions on disk. The associated compression region reached 12.5nT and the phi angle switched to the positive sector.
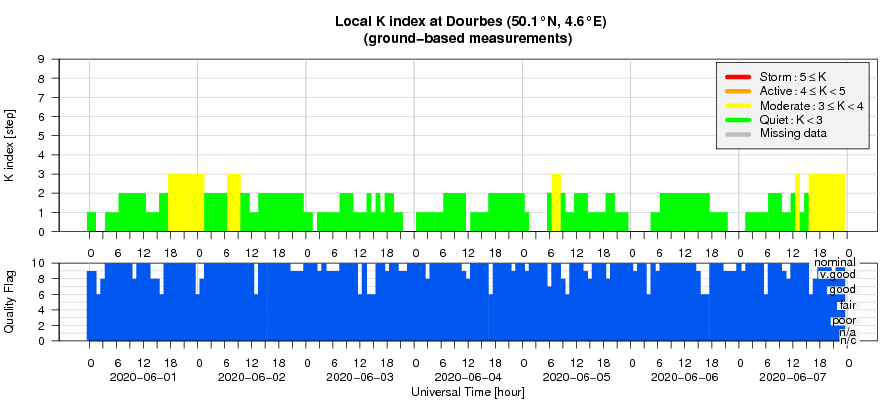
Geomagnetic conditions were quiet with some unsettled (K=3) periods on June 1 and 2 and in the afternoon of June 7. That day, an isolated active (K=4) periode was measured.
Geomagnetic Observations at Dourbes (1 Jun 2020 - 7 Jun 2020)
The SIDC space weather Briefing
The Space Weather Briefing presented by the forecaster on duty from May 31 to June 7. It reflects in images and graphs what is written in the Solar and Geomagnetic Activity report.
The pdf-version: http://www.stce.be/briefings/20200608_SWbriefing.pdf
The automatically running presentation: http://www.stce.be/briefings/20200608_SWbriefing.ppsm
Review of ionospheric activity (1 Jun 2020 - 7 Jun 2020)
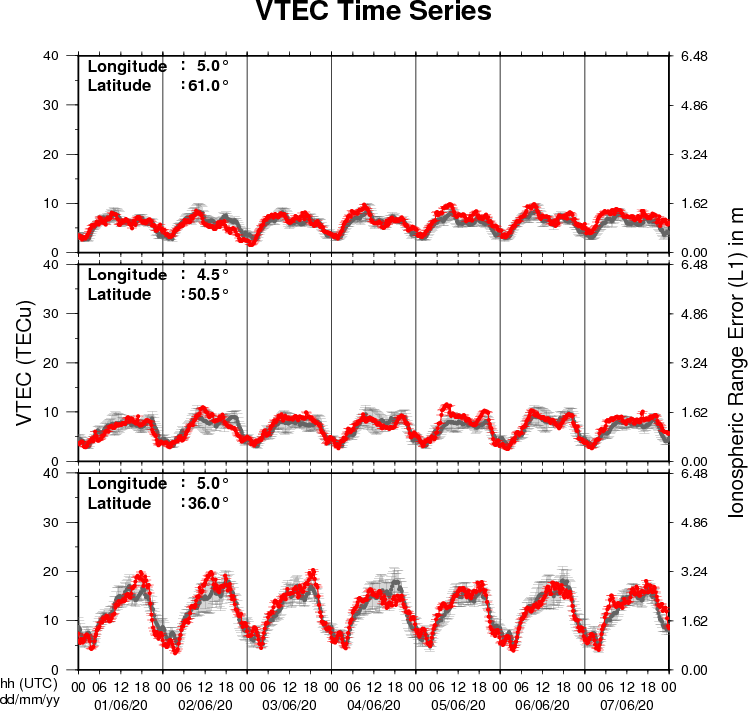
The figure shows the time evolution of the Vertical Total Electron Content (VTEC) (in red) during the last week at three locations:
a) in the northern part of Europe(N61°, 5°E)
b) above Brussels(N50.5°, 4.5°E)
c) in the southern part of Europe(N36°, 5°E)
This figure also shows (in grey) the normal ionospheric behaviour expected based on the median VTEC from the 15 previous days.
The VTEC is expressed in TECu (with TECu=10^16 electrons per square meter) and is directly related to the signal propagation delay due to the ionosphere (in figure: delay on GPS L1 frequency).
The Sun's radiation ionizes the Earth's upper atmosphere, the ionosphere, located from about 60km to 1000km above the Earth's surface.The ionization process in the ionosphere produces ions and free electrons. These electrons perturb the propagation of the GNSS (Global Navigation Satellite System) signals by inducing a so-called ionospheric delay.
See http://stce.be/newsletter/GNSS_final.pdf for some more explanations ; for detailed information, see http://gnss.be/ionosphere_tutorial.php