- Table of Content
- 1.Solstice Eclip...
- 2.Review of sola...
- 3.PROBA2 Observa...
- 4.The Internatio...
- 5.Geomagnetic Ob...
- 6.The SIDC Space...
- 7.Review of iono...
2. Review of solar and geomagnetic activity
3. PROBA2 Observations (15 Jun 2020 - 21 Jun 2020)
4. The International Sunspot Number by Silso
5. Geomagnetic Observations at Dourbes (15 Jun 2020 - 21 Jun 2020)
6. The SIDC Space Weather Briefing
7. Review of ionospheric activity (15 Jun 2020 - 21 Jun 2020)
Solstice Eclipse
On June 21, 2020 an annular eclipse took place, reaching its maximum at 06:40 UTC. The annular phase of this solar eclipse was visible from parts of Africa (including the Central African Republic, Congo, and Ethiopia), south of Pakistan and northern India, and China. Given nice weather, observers in these areas saw the characteristic ring of fire. Indeed, eclipses come in a variety of types, including total eclipses where the Moon completely blocks the Sun's disk and partial eclipses where the Moon only covers part of the Sun. During an annular eclipse the Moon's disk covers the Sun, but a significant portion of the Sun's edge remains visible around the Moon, forming a bright annulus or ring.

Due to its observing position in Earth's orbit, PROBA2 did see an annular eclipse, but a more common partial eclipse. The movies below simulate the view of the SWAP instrument and show the actual observations. They illustrate very clearly that during this eclipse the Moon appeared no less then 5 times in the SWAP field of view! During some of these passages the Moon was only visible at the edge of the images (instead of covering the solar surface) and, due to the poor signal at the edge of the detector, it was very hard to see. The multiple appearances of the Moon are caused by the fact that while the Moon eclipses the Sun, PROBA2 is orbiting the Earth very quickly and can thus observe the spectacle several times. During one of these passages, more that 70% of the Sun's surface was covered by the Moon's disk (as seen from the perspective of PROBA2).
Check the movie of the event: https://proba2.sidc.be/Events/2020-Jun-21-SolarEclipse/movies/swap_eclipse_2020_06_21_logos_lossless.mp4
Check a simulation: https://proba2.sidc.be/Events/2020-Jun-21-SolarEclipse/eclipse_2020-06-21.mov
LYRA Observations
For the occasion, LYRA activated its least used backup unit (unit 1), which acquired in parallel with the nominal unit. The instrument showed the progressive extinction of the solar light in its channels that look in the ultraviolet and extreme ultraviolet.
LYRA observations are available here: https://proba2.sidc.be/Events/2020-Jun-21-SolarEclipse/
SWAP Observations
We made high cadence observations of this eclipse with SWAP and produced our typical sets of calibrated PNG images (with logos and timestamp, with timestamp only, and without logos or timestamp), as well as movies of the event. All the movies and images of the eclipse are collected in dedicated directories on our webpages. This directory also contains a specially selected SWAP image to promote the eclipse. This is the image with the largest part of the Sun occulted by the Moon.
Review of solar and geomagnetic activity
SOLAR ACTIVITY
One active region, NOAA 2765, was visible. It had an alpha magnetic field configuration. It did not produce any B flare or larger. NOAA 2765 rotated over the western limb by 16 June (Wednesday).
There were no obvious Earth-directed CMEs and the greater than 10 MeV proton flux was at nominal levels.
GEOMAGNETIC ACTIVITY
The solar wind close to the Earth was between 300 and 350 km/s. The interplanetary magnetic field fluctuated between 0 and 7 nT. On June 16, DSCOVR measured a solar wind speed close to 450 km/s, but these were marked as bad data, so not real.
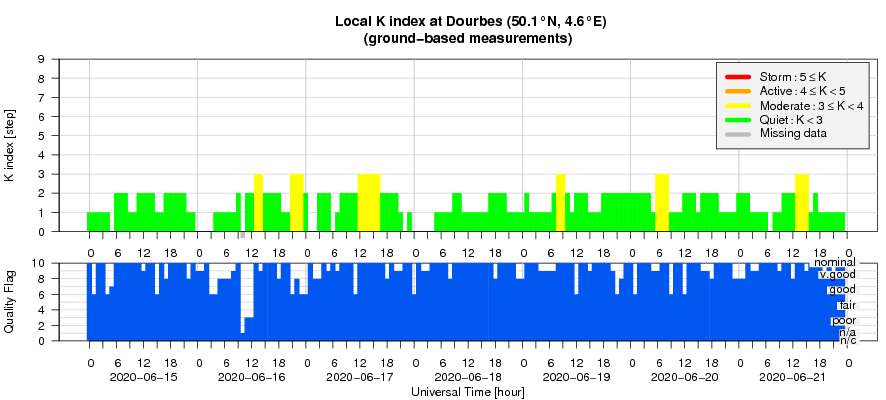
Geomagnetic activity was quiet: K Dourbes was 2, with some isolated periods with K Dourbes reaching 3, The planetary Kp was 2 or less.
PROBA2 Observations (15 Jun 2020 - 21 Jun 2020)
Solar Activity
Solar flare activity was very low during the week.
In order to view the activity of this week in more detail, we suggest to go to the following website from which all the daily (normal and difference) movies can be accessed: https://proba2.oma.be/ssa
This page also lists the recorded flaring events.
A weekly overview movie can be found here (SWAP week 534): https://proba2.sidc.be/swap/data/mpg/movies/weekly_movies/weekly_movie_2020_06_15.mp4
Details about some of this week's events can be found further below.
If any of the linked movies are unavailable they can be found in the P2SC movie repository here: https://proba2.oma.be/swap/data/mpg/movies/
Sunday Jun 21
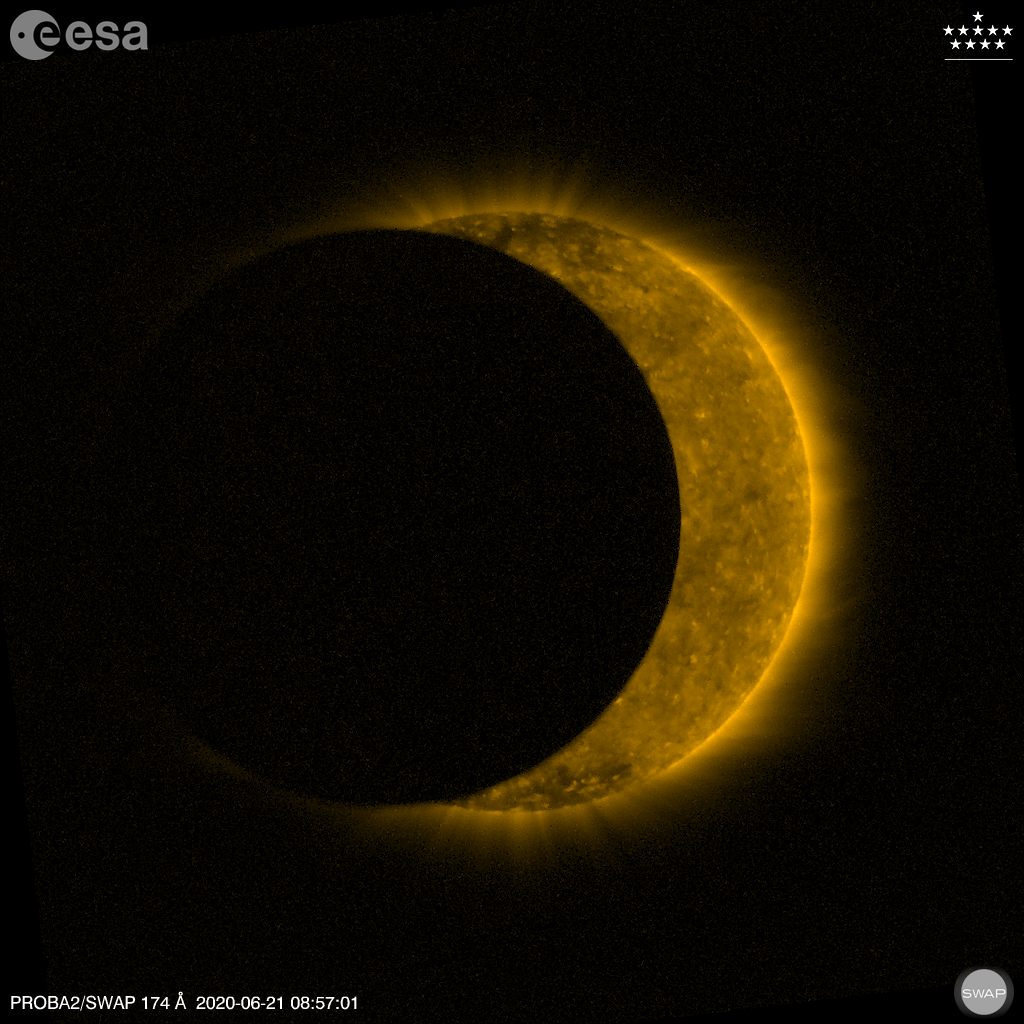
On 2020-Jun-21 an annular eclipse as seen from Earth was observed by SWAP and LYRA as two partial solar eclipses. The SWAP image above was taken during the second partial occultation.
Find a movie of the event here: https://proba2.sidc.be/Events/2020-Jun-21-SolarEclipse/movies/swap_eclipse_2020_06_21_logos_lossless.mp4 and further images available here: https://proba2.sidc.be/Events/2020-Jun-21-SolarEclipse/
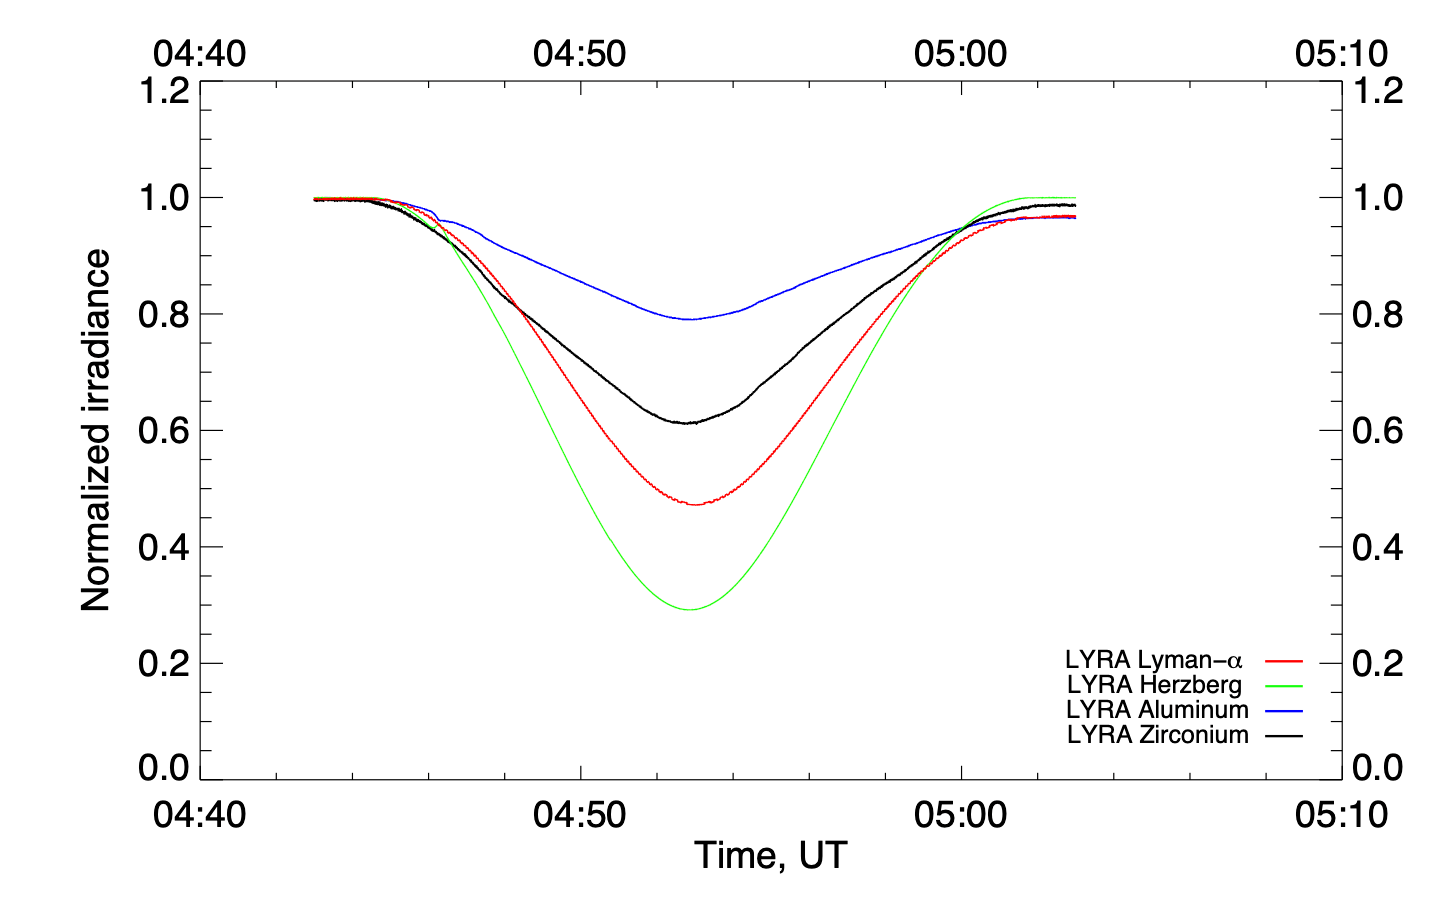
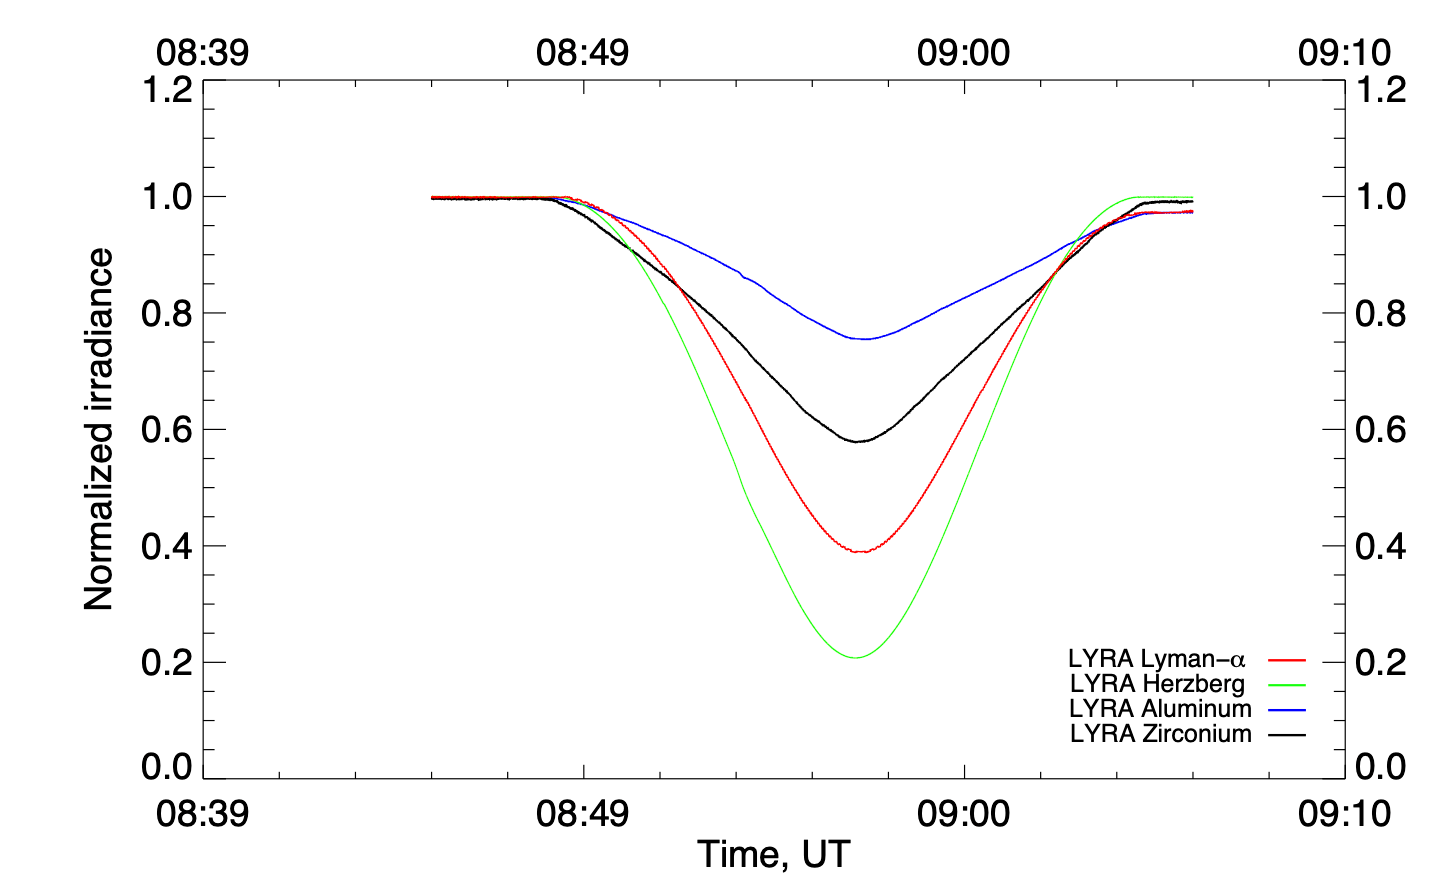
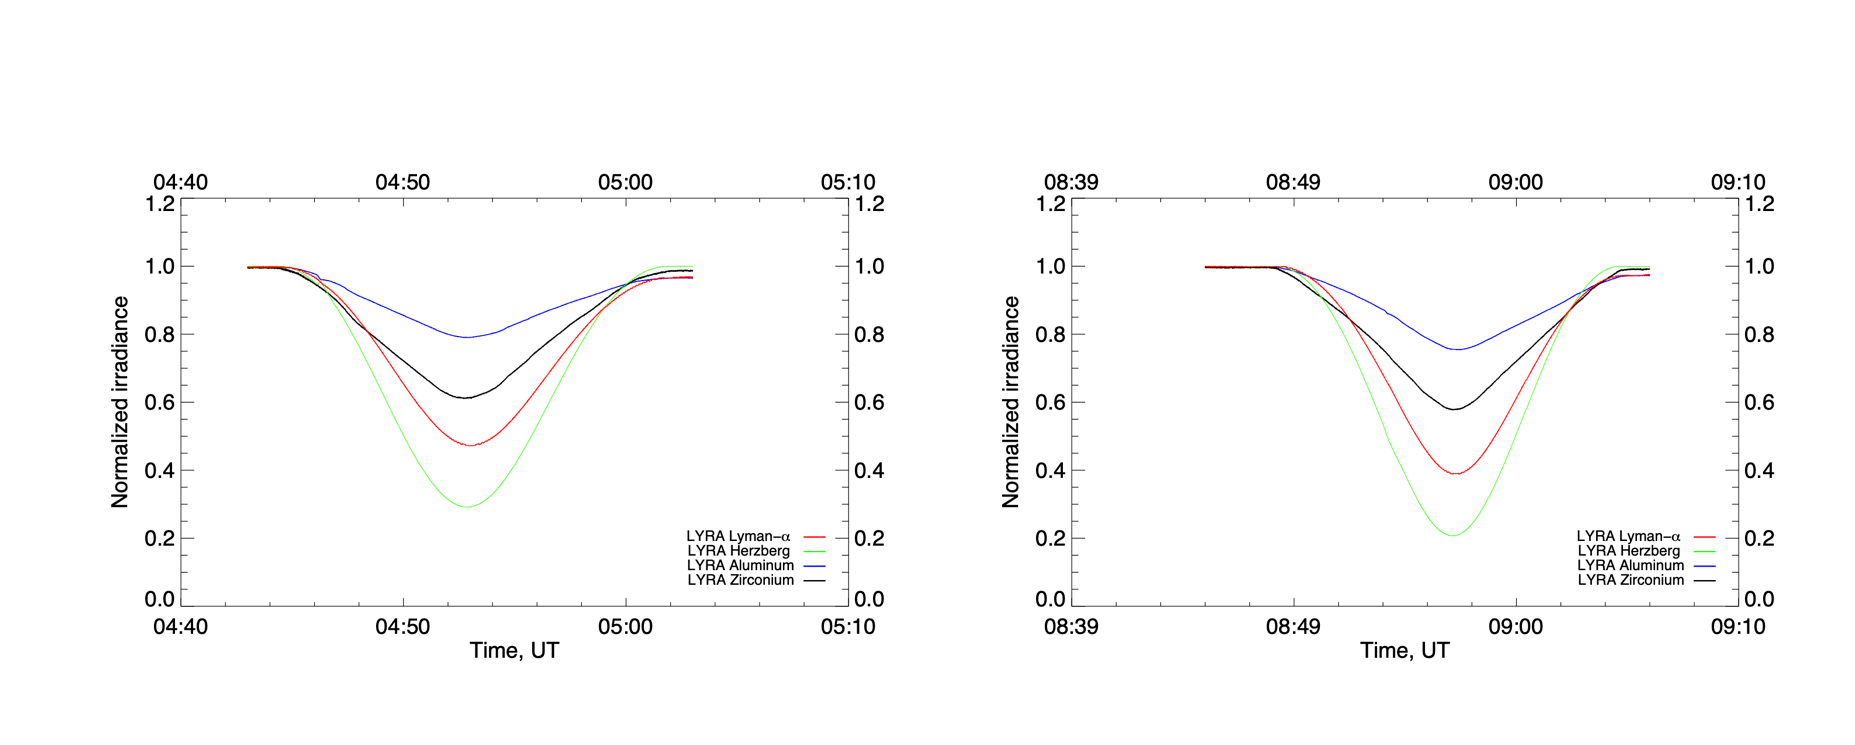
The two occultations were also observed by LYRA's "calibration unit" (unit 1) in addition to the
nominal one (unit 2). The plots above show normalized observations by LYRA during the two
passes in the eclipse zone. The colors correspond to the observations by the four channels of
LYRA: red = Lyman-alpha, green = Herzberg, blue = Aluminum, black = Zirconium.
The International Sunspot Number by Silso
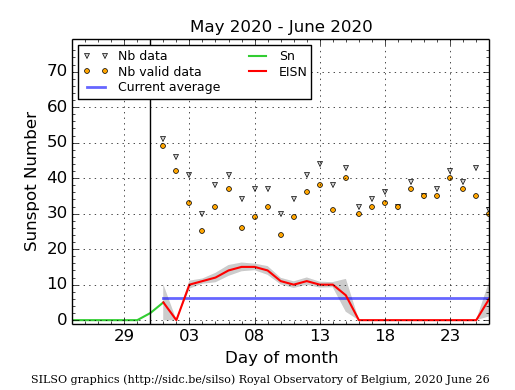
The daily Estimated International Sunspot Number (EISN, red curve with shaded error) derived by a simplified method from real-time data from the worldwide SILSO network. It extends the official Sunspot Number from the full processing of the preceding month (green line). The plot shows the last 30 days (about one solar rotation). The horizontal blue line shows the current monthly average. The yellow dots gives the number of stations that provided valid data. Valid data are used to calculate the EISN. The triangle gives the number of stations providing data. When a triangle and a yellow dot coincide, it means that all the data is used to calculate the EISN of that day.
Geomagnetic Observations at Dourbes (15 Jun 2020 - 21 Jun 2020)
The SIDC Space Weather Briefing
The Space Weather Briefing presented by the forecaster on duty from June 14 to 21. It reflects in images and graphs what is written in the Solar and Geomagnetic Activity report.
The pdf-version: http://www.stce.be/briefings/20200622_SWbriefing.pdf
The automatically running presentation: http://www.stce.be/briefings/20200622_SWbriefing.ppsm
Review of ionospheric activity (15 Jun 2020 - 21 Jun 2020)
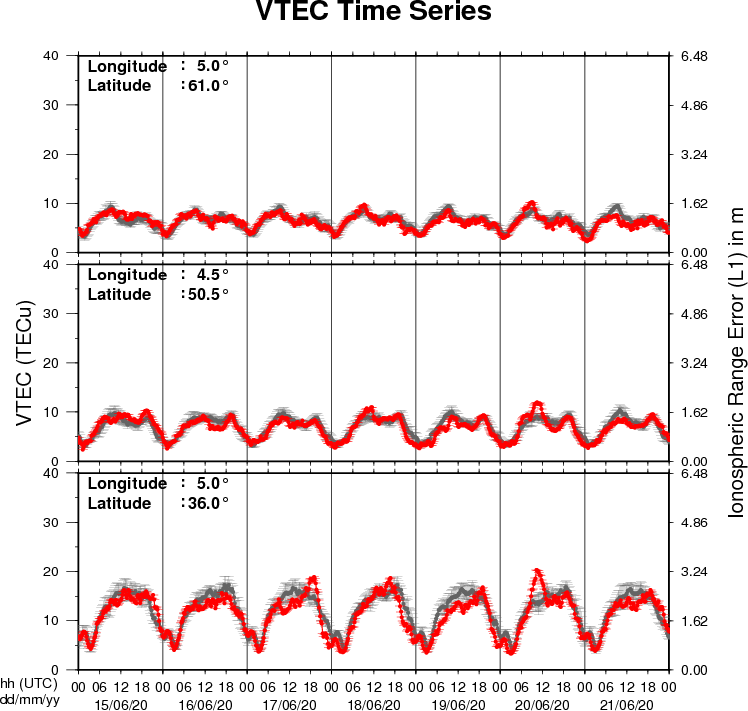
The figure shows the time evolution of the Vertical Total Electron Content (VTEC) (in red) during the last week at three locations:
a) in the northern part of Europe(N61°, 5°E)
b) above Brussels(N50.5°, 4.5°E)
c) in the southern part of Europe(N36°, 5°E)
This figure also shows (in grey) the normal ionospheric behaviour expected based on the median VTEC from the 15 previous days.
The VTEC is expressed in TECu (with TECu=10^16 electrons per square meter) and is directly related to the signal propagation delay due to the ionosphere (in figure: delay on GPS L1 frequency).
The Sun's radiation ionizes the Earth's upper atmosphere, the ionosphere, located from about 60km to 1000km above the Earth's surface.The ionization process in the ionosphere produces ions and free electrons. These electrons perturb the propagation of the GNSS (Global Navigation Satellite System) signals by inducing a so-called ionospheric delay.
See http://stce.be/newsletter/GNSS_final.pdf for some more explanations ; for detailed information, see http://gnss.be/ionosphere_tutorial.php