- Table of Content
- 1.An impressive ...
- 2.Review of sola...
- 3.PROBA2 Observa...
- 4.The Internatio...
- 5.Review of geom...
- 6.Geomagnetic Ob...
- 7.The SIDC Space...
- 8.Review of iono...
2. Review of solar activity
3. PROBA2 Observations (29 Jun 2020 - 5 Jul 2020)
4. The International Sunspot Number by SILSO
5. Review of geomagnetic activity
6. Geomagnetic Observations at Dourbes (29 Jun 2020 - 5 Jul 2020)
7. The SIDC Space Weather Briefing
8. Review of ionospheric activity (29 Jun 2020 - 5 Jul 2020)
An impressive solar corona picture
A solar eclipse occurs when the Moon passes exactly between the Sun and the Earth. The Moon then casts a shadow on the Earth's surface, fully or partially blocking the sunlight. As the Moon is about 400 times smaller than the Sun, but also about 400 times closer to the Earth than the Sun, the two have about the same apparent size and the Moon can occasionally obscure the entire Sun. This is called a total solar eclipse. When the Moon is a bit further from the Earth, it appears smaller than the Sun and a solar ring becomes visible around the Moon (an annular eclipse). When the alignment is not perfect, the Moon can only block a part of the Sun (a partial eclipse). During a total eclipse, the eclipse path can be several 1000 km long, but its width is on the average only about 150 km, very narrow indeed.
Hence, with only 2 to 5 solar eclipses (all types included) every year, these are very rare events. Moreover, as 70% of the Earth's surface consists of oceans, and taking into account that a large portion of the landmass consists of sparsely populated or uninhabitated regions (poles, deserts,...), it's quite unusual when a total eclipse passes over big cities. This does happen from time to time, such as on 11 August 1999 (Europe) or on 21 August 2017 (the "Great American Eclipse" over the entire contiguous United States). The odds that the path of totality passes right over a number of major solar observatories would seem even much smaller...
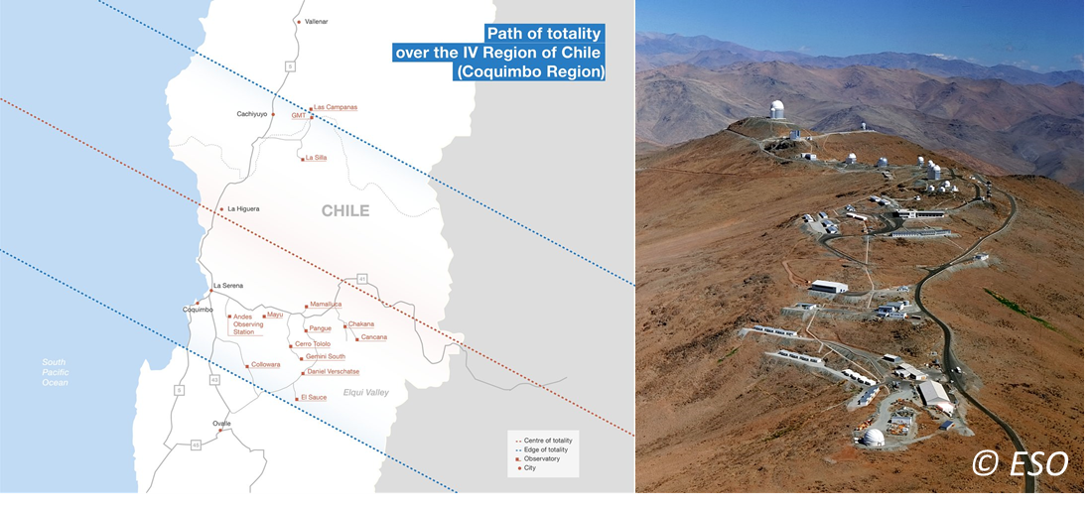
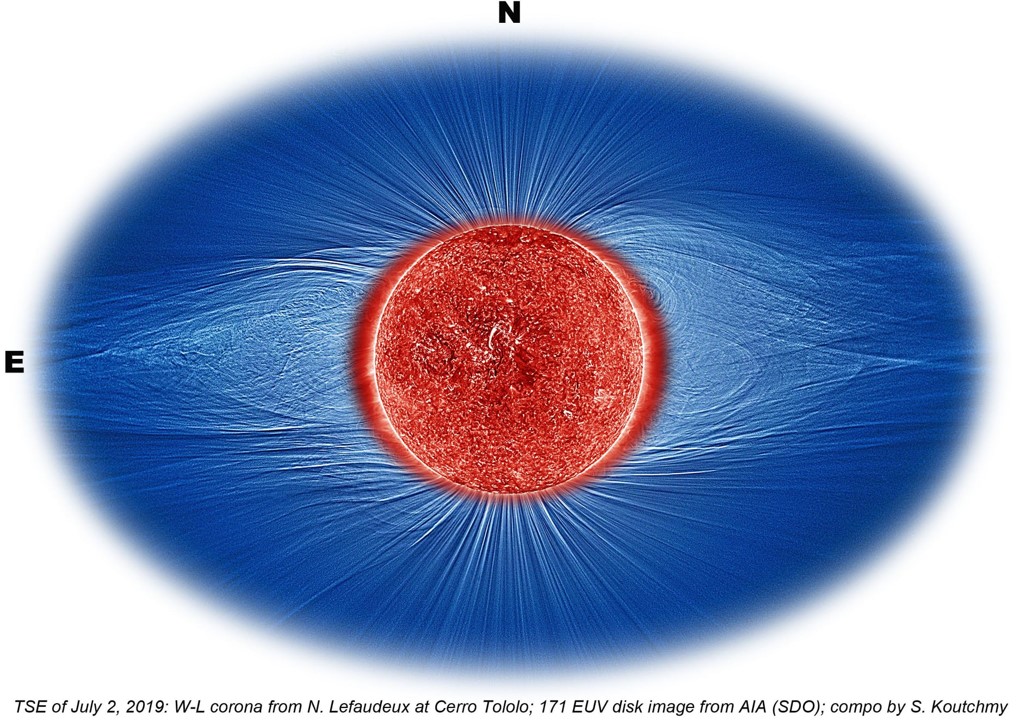
Nonetheless, this is what happened one year ago, on 2 July 2019, when a beautiful total solar eclipse was visble from Chile and Argentina and provided a good opportunity to study the solar corona around the solar disk. The corona is the outer atmosphere of the Sun, visible as a whitish glow surrounding the obscured Sun. Researchers there did not miss this golden opportunity and used the New Technology Telescope (NTT) of 3.6 m aperture at La Silla (ESO) to make unique spectra at high resolution (1 arcsec wide slit). At the same time, Nicolas Lefaudeux at Cerro-Tololo produced excellent coronal images in white light. These images were processed using the so-called unsharp masking technique to enhance small scale details. The composite underneath was created by Serge Koutchmy and combines the white light imagery taken by Nicolas (blue) with simultaneous images (summed over 5 minutes) taken with the AIA instrument of the Solar Dynamics Observatory (SDO) satellite (reddish). Its 171A filter shows extreme ultraviolet (EUV) emission from the Sun's corona at a temperature of around 1 million Kelvin of both the disk and immediately above the limb in the bright coronal ring. Also these images were slightly enhanced to bring out small scale details.
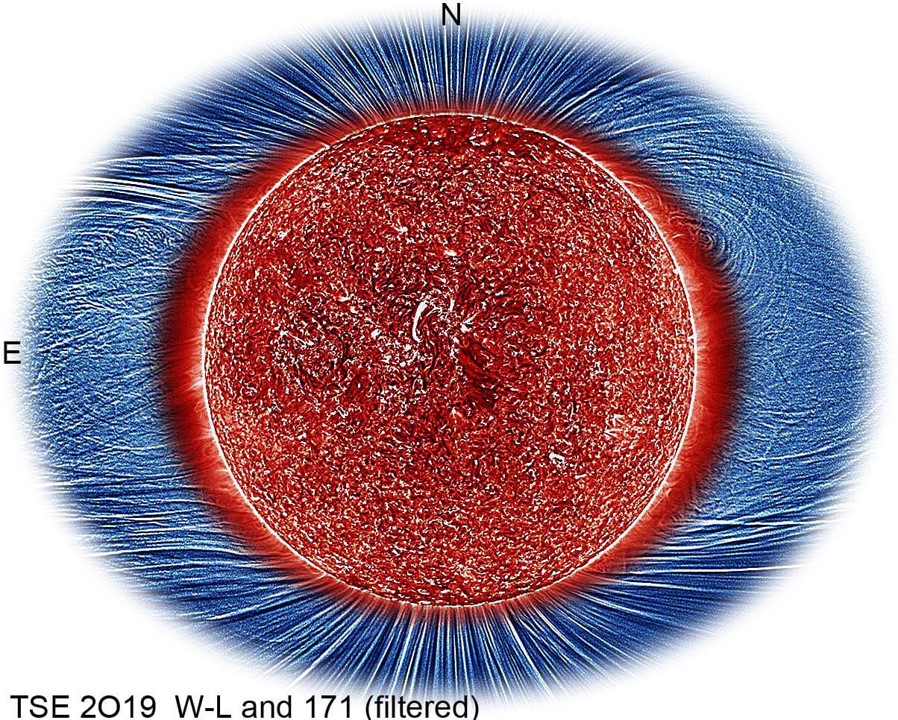
The result is an awesome, incredibly detailed picture of the Sun's corona, with a very good correspondence between the white light and the EUV imagery, in particular at the poles. Underneath is also a zoomed out image clearly showing the typical shape of the corona during a solar cycle minimum such as the one we are going through now.
Review of solar activity
During this week there were only two numbered active regions (AR) observed on the visible side of the solar disk: Catania sunspot group 33 (not numbered by NOAA) and NOAA AR 2766 (not numbered by Catania). Solar flaring activity was very low with no C-class flares, and not even B-class flares reported. Several narrow and slow coronal mass ejections (CMEs) were observed, associated mostly with A-class flares from Catania sunspot group 33 and NOAA AR 2766, and one with a prominence eruption. There were no wide or Earth-directed CMEs observed, and the solar protons remained at the background level during the whole week. The greater than 2 MeV electron flux was at nominal to low levels.
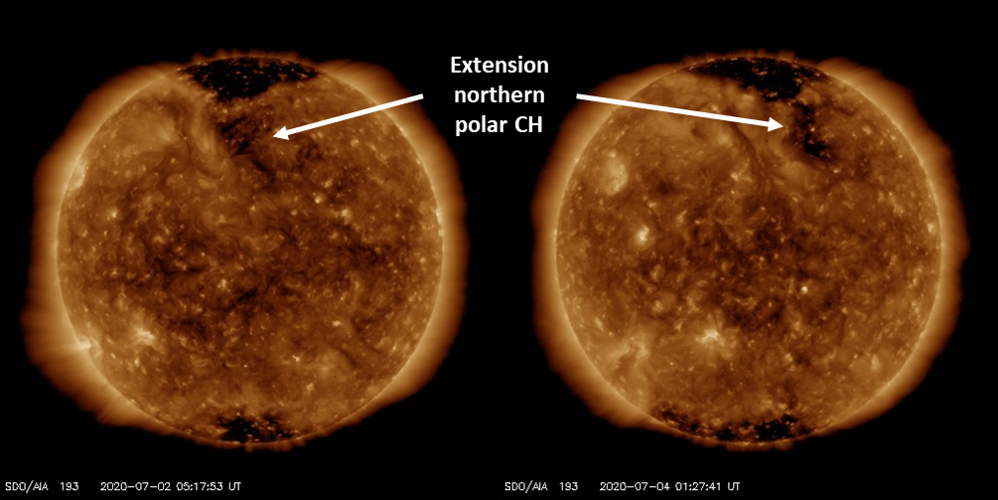
Only one, positive polarity coronal hole was observed on the visible side of the Sun this week. The low latitude extension of the northern polar coronal hole started its passage across the central meridian in the afternoon of 01 July (see the SDO/AIA 193 image underneath).
PROBA2 Observations (29 Jun 2020 - 5 Jul 2020)
Solar Activity
Solar flare activity was very low during the week.
In order to view the activity of this week in more detail, we suggest to go to the following website from which all the daily (normal and difference) movies can be accessed: https://proba2.oma.be/ssa
This page also lists the recorded flaring events.
A weekly overview movie can be found here (SWAP week 536): https://proba2.sidc.be/swap/data/mpg/movies/weekly_movies/weekly_movie_2020_06_29.mp4
Details about some of this week's events can be found further below.
If any of the linked movies are unavailable they can be found in the P2SC movie repository here: https://proba2.oma.be/swap/data/mpg/movies/
Sunday Jul 05
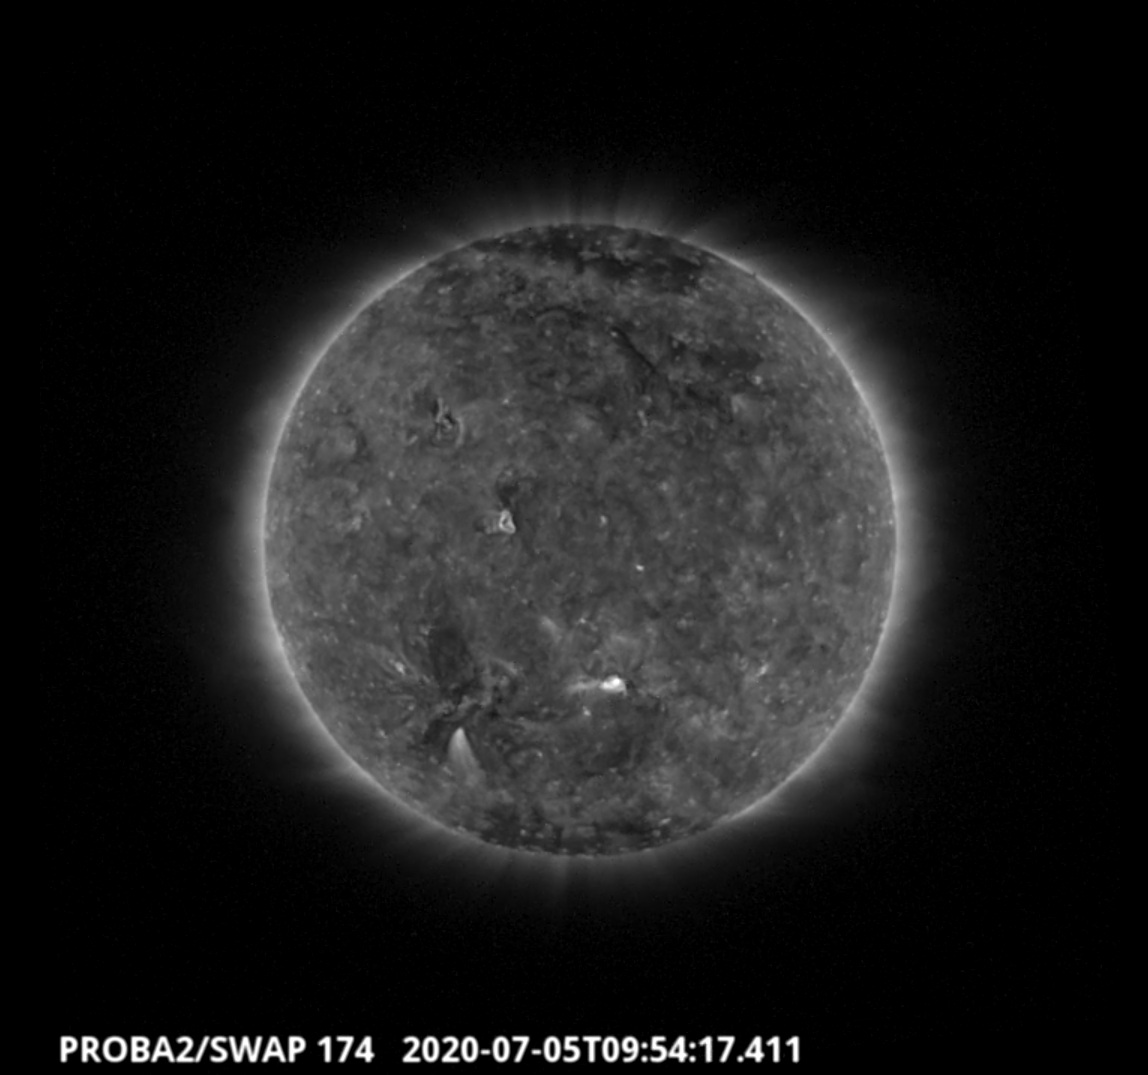
An eruption was observed by SWAP on the south-east limb of the Sun on 2020-Jul-05 as shown in the SWAP image above taken at 09:54 UT.
Find a movie of the event here (SWAP movie): https://proba2.sidc.be/swap/movies/20200705_swap_movie.mp4
The International Sunspot Number by SILSO
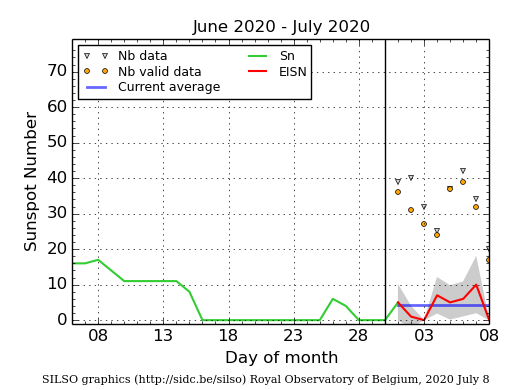
The daily Estimated International Sunspot Number (EISN, red curve with shaded error) derived by a simplified method from real-time data from the worldwide SILSO network. It extends the official Sunspot Number from the full processing of the preceding month (green line). The plot shows the last 30 days (about one solar rotation). The horizontal blue line shows the current monthly average. The grey triangles give the number of stations providing data. The yellow dots give the number of stations that provided valid data. Valid data are used to calculate the EISN. When a grey triangle and a yellow dot coincide, it means that all the observations are used to calculate the EISN of that day.
Review of geomagnetic activity
At the beginning of the week Earth was inside the slow solar wind. At about 15:00UT on 04 July the IMF started to increase simultaneously with the increase of the solar wind speed (yellow curve underneath) and temperature, indicating the arrival of the fast solar wind associated with the low latitude extension of the northern polar coronal hole (positive polarity). Maximum speeds near 530 km/s were recorded. During the passage of the compression region between the slow and fast solar wind, the interplanetary magnetic field (IMF) reached its maximum value of 11 nT (white curve underneath). Until the end of the week Earth was under the influence of the fast solar wind.
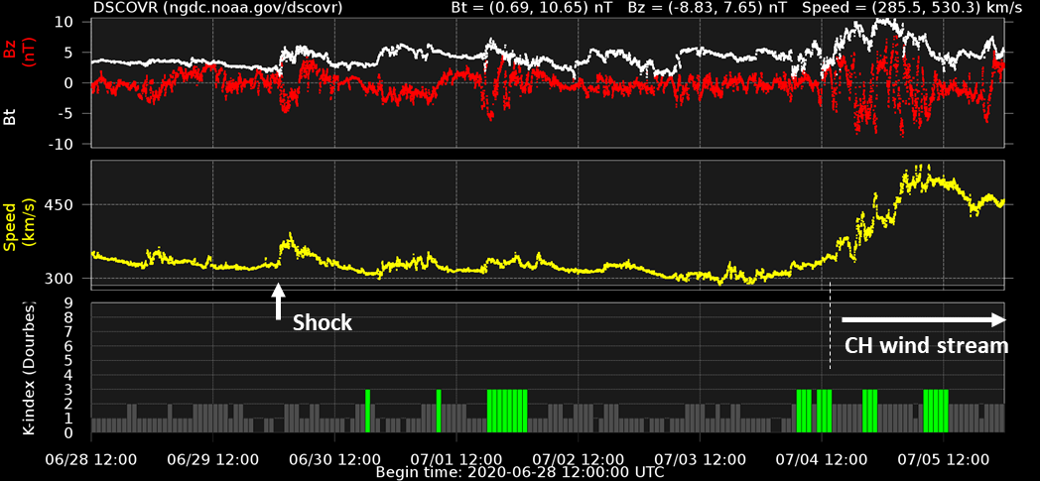
The in situ solar wind observations showed a shock at 01:24UT, on 30 June. The IMF magnitude increased simultaneously with the solar wind speed (maximum value reached was 390 km/s), density and the temperature. The solar origin of the observed shock was not completely clear. The shock observed in situ could have been driven by the weak coronal mass ejection (CME) observed on 24 June (weak eruption at about 12:00UT followed by the coronal dimming was associated with the slow CME observed above the East solar limb) or 25 June (CME of unclear origin observed first in the SOHO LASCO C2 field of view at about 04:30UT on June 26).
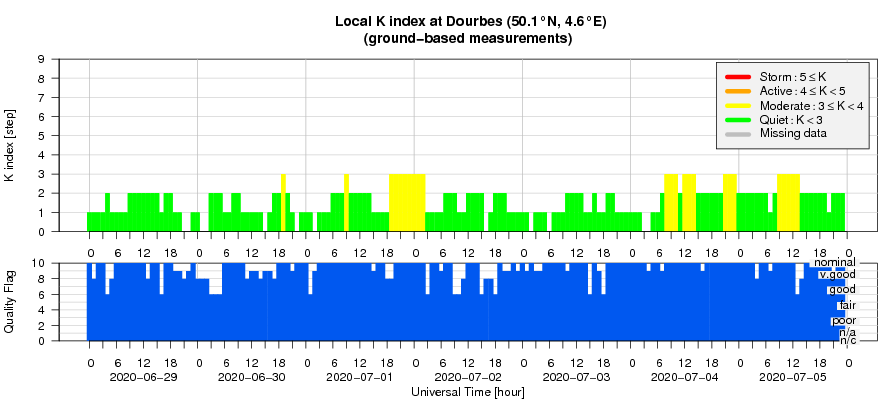
The geomagnetic conditions were mostly quiet with few intervals of unsettled conditions. Both the local station at Dourbes as well as NOAA reported only few intervals with K=3 and Kp=3, respectively.
Geomagnetic Observations at Dourbes (29 Jun 2020 - 5 Jul 2020)
The SIDC Space Weather Briefing
The Space Weather Briefing presented by the forecaster on duty from 29 June till 05 July. It reflects in images and graphs what is written in the reports on solar and geomagnetic activity.
The pdf-version: http://www.stce.be/briefings/20200706_SWbriefing.pdf
The automatically running presentation: http://www.stce.be/briefings/20200706_SWbriefing.wmv
Please note the correct links to last week's space weather briefing are:
The pdf-version: http://www.stce.be/briefings/20200629_SWbriefing.pdf
The automatically running presentation: http://www.stce.be/briefings/20200629_SWbriefing.ppsm
Review of ionospheric activity (29 Jun 2020 - 5 Jul 2020)
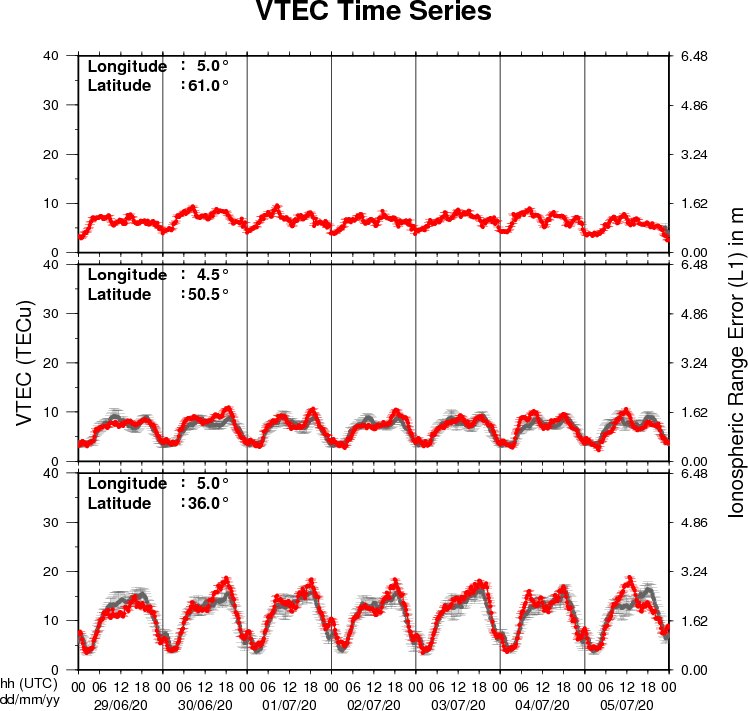
The figure shows the time evolution of the Vertical Total Electron Content (VTEC) (in red) during the last week at three locations:
a) in the northern part of Europe(N61°, 5°E)
b) above Brussels(N50.5°, 4.5°E)
c) in the southern part of Europe(N36°, 5°E)
This figure also shows (in grey) the normal ionospheric behaviour expected based on the median VTEC from the 15 previous days.
The VTEC is expressed in TECu (with TECu=10^16 electrons per square meter) and is directly related to the signal propagation delay due to the ionosphere (in figure: delay on GPS L1 frequency).
The Sun's radiation ionizes the Earth's upper atmosphere, the ionosphere, located from about 60km to 1000km above the Earth's surface.The ionization process in the ionosphere produces ions and free electrons. These electrons perturb the propagation of the GNSS (Global Navigation Satellite System) signals by inducing a so-called ionospheric delay.
See http://stce.be/newsletter/GNSS_final.pdf for some more explanations ; for detailed information, see http://gnss.be/ionosphere_tutorial.php