- Table of Content
- 1.First images b...
- 2.Review of sola...
- 3.PROBA2 Observa...
- 4.The Internatio...
- 5.Review of geom...
- 6.Geomagnetic Ob...
- 7.The SIDC Space...
- 8.Review of iono...
2. Review of solar activity
3. PROBA2 Observations (6 Jul 2020 - 12 Jul 2020)
4. The International Sunspot Number by SILSO
5. Review of geomagnetic activity
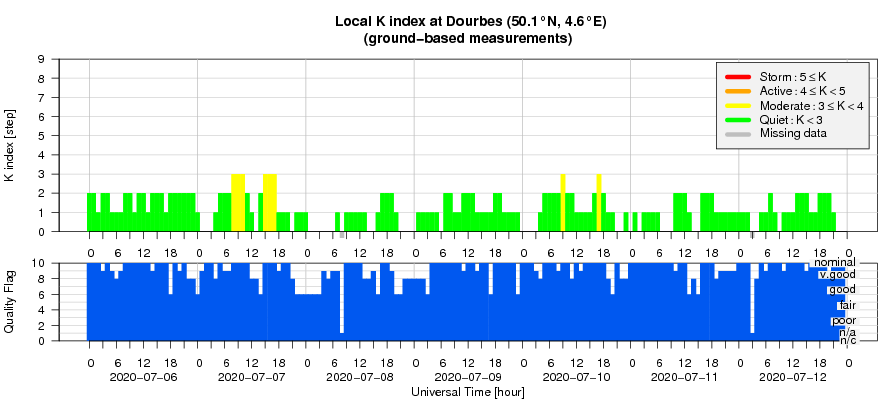
6. Geomagnetic Observations at Dourbes (6 Jul 2020 - 12 Jul 2020)
7. The SIDC Space Weather Briefing
8. Review of ionospheric activity (6 Jul 2020 - 12 Jul 2020)
First images by Solar Orbiter
During an ESA online press briefing on 16 July, the first images from ESA’s new Sun-observing spacecraft Solar Orbiter have been released. Six prominent project scientists and principal investigators explained the main main goals, findings, and mysteries they hope to solve with "SolO". For the Royal Observatory of Belgium, David Berghmans joined the online panel as he is the principal investigator of the Extreme Ultraviolet Instrument (EUI), the telescope that is making images of the Sun in extreme ultraviolet.
Solar Orbiter, launched on 10 February, completed its commissioning phase in mid-June despite the setbacks the teams faced while commissioning the spacecraft and its instruments amid the COVID-19 pandemic. The first imaging campaign has been a great success. The 10 instruments on board Solar Orbiter are working flawlessly, and together provide a comprehensive view of the Sun and the solar wind. This increases confidence that Solar Orbiter will help answer profound open questions about the Sun, such as how the solar wind is accelerated, how solar eruptions are generated or why the corona (the Sun's outer atmosphere) is so hot.
During its first perihelion (15 June 2020), the point in the spacecraft’s elliptical orbit closest to the Sun, Solar Orbiter got as close as 77 million kilometres from our star’s surface, about half the distance between the Sun and Earth. The spacecraft will eventually make much closer approaches to the Sun. Once in its science phase, which will commence in late 2021, the spacecraft will get as close as 42 million kilometres from the Sun’s surface, closer than the planet Mercury. This will obviously improve the resolution of the images, and as experience in image processing and the use of the spacecraft is gained, may even further increase this resolution by a factor of two.
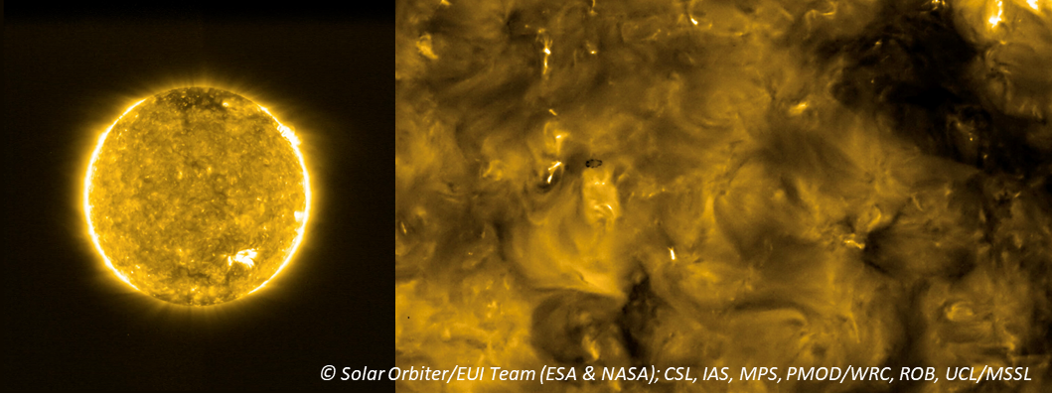
Imagery obtained with the EUI during the first perihelion shows already tantalizing results. The Sun remains very dynamic even on very small scales. Scientists are running short of all the new features they have been discovering, and started to create a whole new vocabulary. One of the new words is "campfire", omnipresent miniature eruptions that could be contributing to the high temperatures of the solar corona and the origin of the solar wind. This is of course just one theory, and scientists are eager to see which of these theories holds.
Solar Orbiter will also collaborate with other prominent missions such as the Parker Solar Probe (PSP), which can approach the Sun to just a few millions kilometres but as such can't take direct solar pictures due to the scorching heat, and BepiColombo, Europe's first mission to the planet Mercury. This teaming up should even further improve science results by the combination of remote and in situ observations from the different spacecraft. The scientists also emphasized that over the years to come, Solar Orbiter's orbit will be gradually modified such that the spacecraft will get a better view of the Sun's poles. Questions scientists hope to get answered then is how the magnetic solar dynamo actually works, or how the polar coronal holes drive the solar wind and the heliospheric bubble.
More information and imagery can be found on ESA's website at https://www.esa.int/Newsroom/Press_Releases/Call_for_Media_ESA_to_reveal_first_images_from_Solar_Orbiter
and at the website of the ROB/SIDC at https://wwwbis.sidc.be/EUI/first_light
Review of solar activity
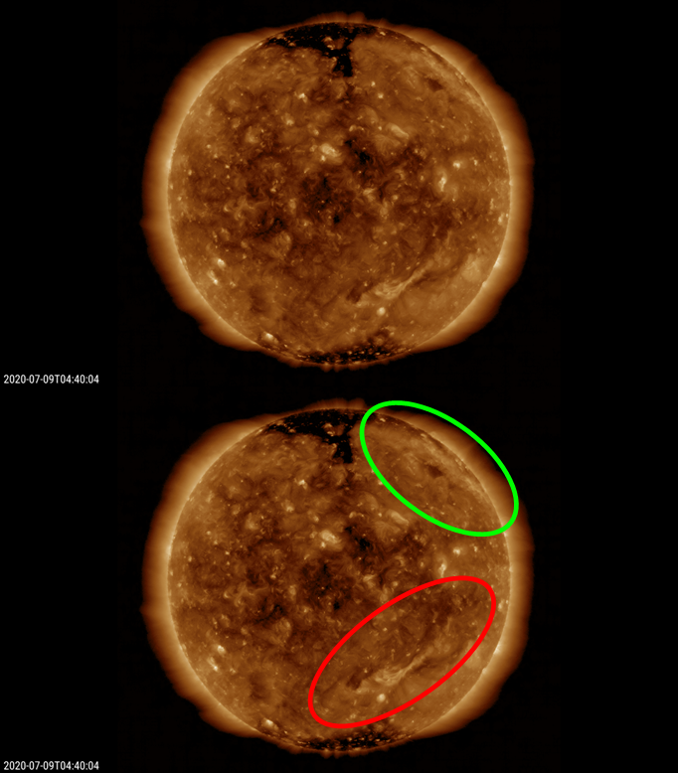
Solar activity was at very low levels. The Sun was spotless most of the week, with some small spots visible on 6, 7 and 10 July. NOAA 2766 was the source of two A2 flares on 11 July. The 10.7cm solar radio flux ranged between 67 and 70 sfu. Filament eruptions took place on 5 July (southeast quadrant), and on 8 and 9 July resp. in the southwest quadrant and near the northwest limb. See the annotated SDO/AIA 193 imagery underneath.
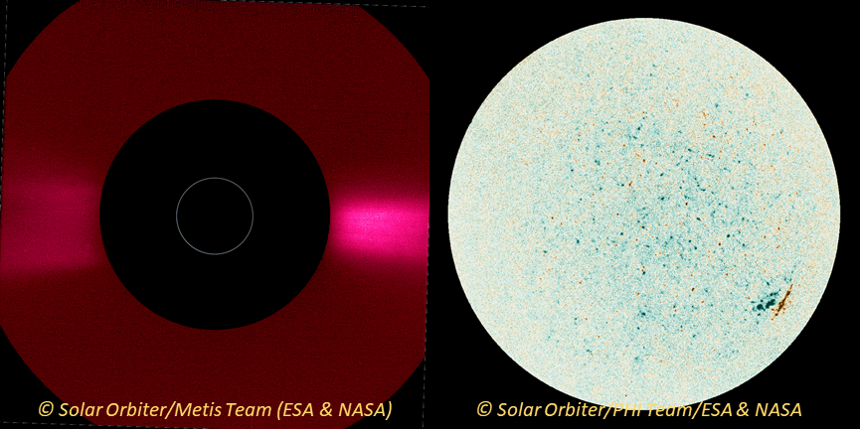
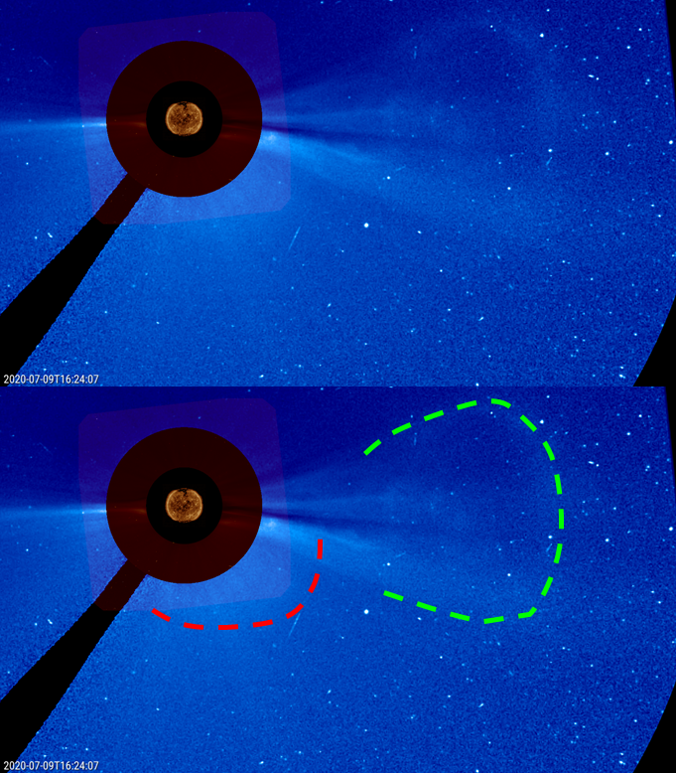
The slow and faint coronal mass ejection (CME) associated with the eruption in the southwest quadrant may have an earth-directed component. See the annotated SOHO/LASCO coronagraphic imagery underneath (the colors refer to the source as indicated in SDO's extreme ultraviolet images). No other earth-directed CMEs were observed throughout the week. A small positive polarity equatorial coronal hole (CHs) and a patchy negative polarity CH transited the central meridian on 8-9 July. The greater than 10 MeV proton flux was at nominal values.
PROBA2 Observations (6 Jul 2020 - 12 Jul 2020)
Solar Activity
Solar flare activity remained very low during the week.
In order to view the activity of this week in more detail, we suggest to go to the following website from which all the daily (normal and difference) movies can be accessed: https://proba2.oma.be/ssa
This page also lists the recorded flaring events.
A weekly overview movie can be found here (SWAP week 537): https://proba2.sidc.be/swap/data/mpg/movies/weekly_movies/weekly_movie_2020_07_06.mp4
Details about some of this week's events can be found further below.
If any of the linked movies are unavailable they can be found in the P2SC movie repository here: https://proba2.oma.be/swap/data/mpg/movies/
Thursday Jul 09
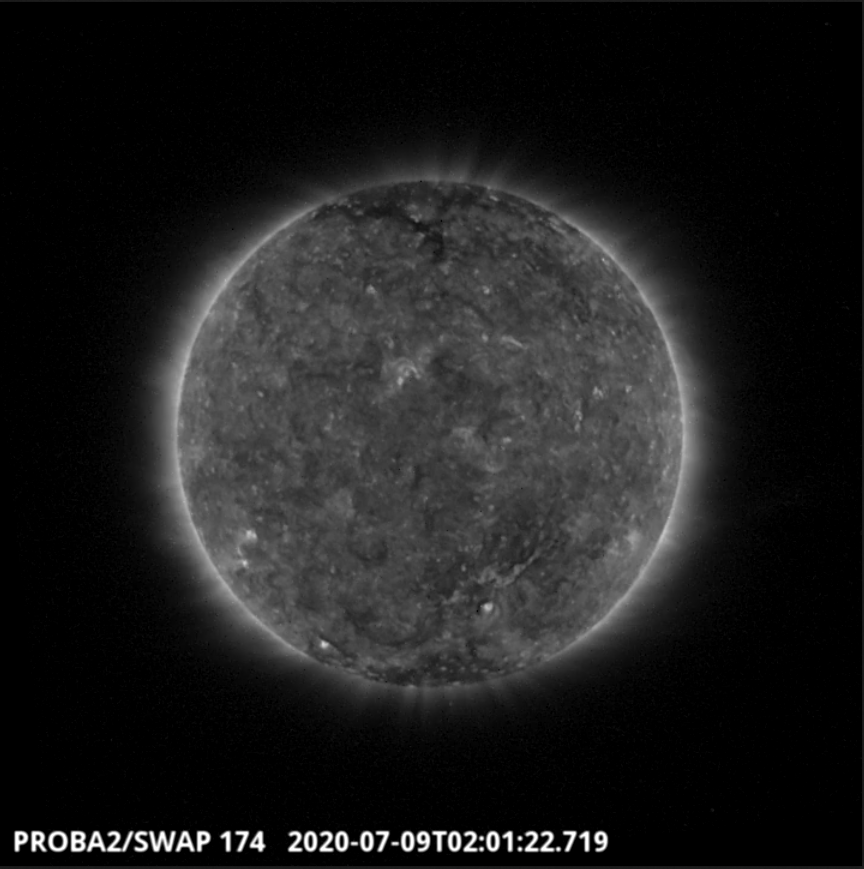
A faint filament eruption was observed by SWAP on the east limb of the Sun on 2020-Jul-09 as shown in the SWAP image above taken at 02:01 UT.
Find a movie of the event here (SWAP movie): https://proba2.sidc.be/swap/movies/20200709_swap_movie.mp4
The International Sunspot Number by SILSO
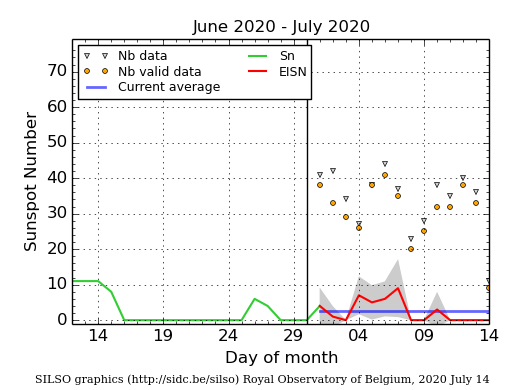
The daily Estimated International Sunspot Number (EISN, red curve with shaded error) derived by a simplified method from real-time data from the worldwide SILSO network. It extends the official Sunspot Number from the full processing of the preceding month (green line). The plot shows the last 30 days (about one solar rotation). The horizontal blue line shows the current monthly average. The grey triangles give the number of stations providing data. The yellow dots give the number of stations that provided valid data. Valid data are used to calculate the EISN. When a grey triangle and a yellow dot coincide, it means that all the observations are used to calculate the EISN of that day.
Review of geomagnetic activity
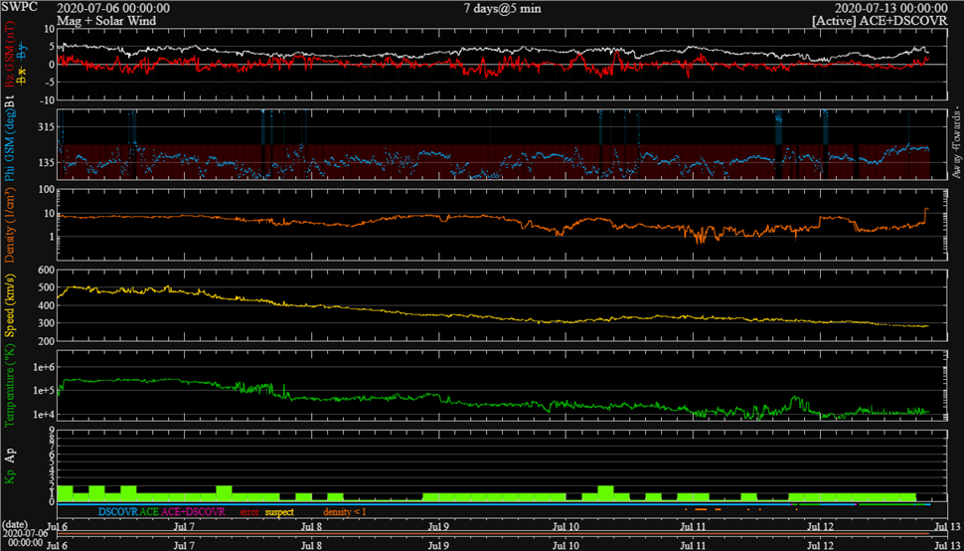
On 6 and 7 July, the earth environment was still under the influence of a wind stream associated with a positive polarity coronal hole (CH), after which the solar wind parameters returned to nominal levels. Solar wind speed decreased from values near 510 km/s early in the week to values between mostly 300 to 350 km/s from 9 July onwards (DSCOVR, yellow curve underneath). Bz varied between -6 and +5 nT (red curve). The direction of the interplanetary magnetic field was in a predominantly positive sector (away from the Sun: blue curve). Geomagnetic activity was at quiet to unsettled levels. The greater than 2 MeV electron flux was at nominal to low values.
Geomagnetic Observations at Dourbes (6 Jul 2020 - 12 Jul 2020)
The SIDC Space Weather Briefing
The Space Weather Briefing presented by the forecaster on duty from 06 till 12 July. It reflects in images and graphs what is written in the reports on solar and geomagnetic activity. Movies of some events can be seen in the wmv version.
The pdf-version: http://www.stce.be/briefings/20200713_SWbriefing.pdf
The automatically running presentation: http://www.stce.be/briefings/20200713_SWbriefing.wmv
Review of ionospheric activity (6 Jul 2020 - 12 Jul 2020)
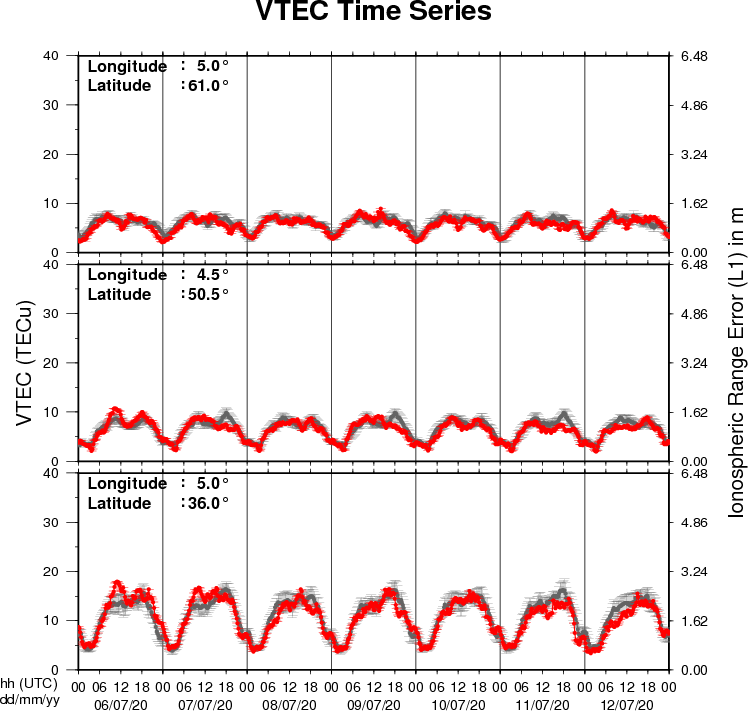
The figure shows the time evolution of the Vertical Total Electron Content (VTEC) (in red) during the last week at three locations:
a) in the northern part of Europe(N61°, 5°E)
b) above Brussels(N50.5°, 4.5°E)
c) in the southern part of Europe(N36°, 5°E)
This figure also shows (in grey) the normal ionospheric behaviour expected based on the median VTEC from the 15 previous days.
The VTEC is expressed in TECu (with TECu=10^16 electrons per square meter) and is directly related to the signal propagation delay due to the ionosphere (in figure: delay on GPS L1 frequency).
The Sun's radiation ionizes the Earth's upper atmosphere, the ionosphere, located from about 60km to 1000km above the Earth's surface.The ionization process in the ionosphere produces ions and free electrons. These electrons perturb the propagation of the GNSS (Global Navigation Satellite System) signals by inducing a so-called ionospheric delay.
See http://stce.be/newsletter/GNSS_final.pdf for some more explanations ; for detailed information, see http://gnss.be/ionosphere_tutorial.php