- Table of Content
- 1.A new member o...
- 2.Review of sola...
- 3.PROBA2 Observa...
- 4.The Internatio...
- 5.Review of geom...
- 6.Geomagnetic Ob...
- 7.The SIDC Space...
- 8.Review of iono...
2. Review of solar activity
3. PROBA2 Observations (13 Jul 2020 - 19 Jul 2020)
4. The International Sunspot Number by SILSO
5. Review of geomagnetic activity
6. Geomagnetic Observations at Dourbes (13 Jul 2020 - 19 Jul 2020)
7. The SIDC Space Weather Briefing
8. Review of ionospheric activity (13 Jul 2020 - 19 Jul 2020)
A new member of the new solar cycle
A reasonably sized sunspot rounded the southeast solar limb on 21 July. NOAA 2767 has a high latitude (-21 degrees) and a magnetic polarity that identify it as a member of the new solar cycle 25 (SC25). The region has been quiet and has not produced any flaring above the B-class level... so far.
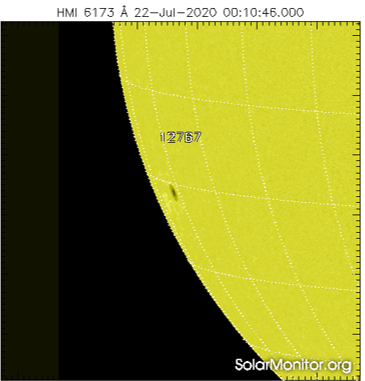
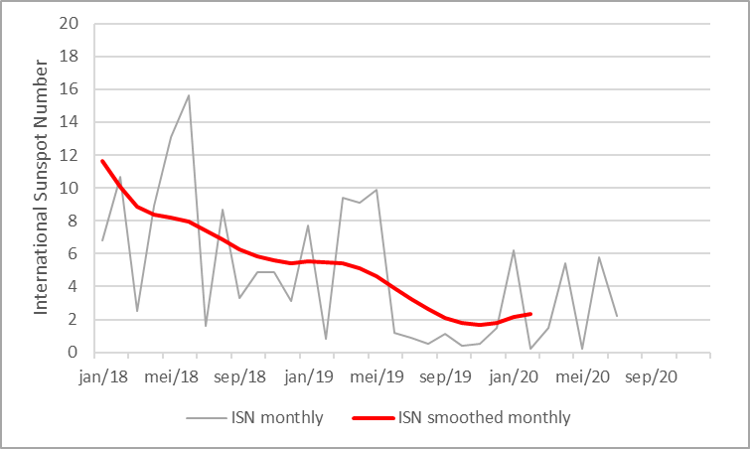
This sunspot group once more confirms that the new solar cycle finally has started. The (preliminary) monthly and monthly smoothed sunspot numbers (http://sidc.oma.be/silso/ ) seem to indicate that the cycle minimum took place in November 2019 (see the graph underneath), bottoming out at 1.7. There may be a slight difference in time and value pending the smoothing formula used. At any rate, it would mean that the previous solar cycle (SC24) had an average duration of about 11 years, which is a typical value but still relatively short for such a low activity cycle.
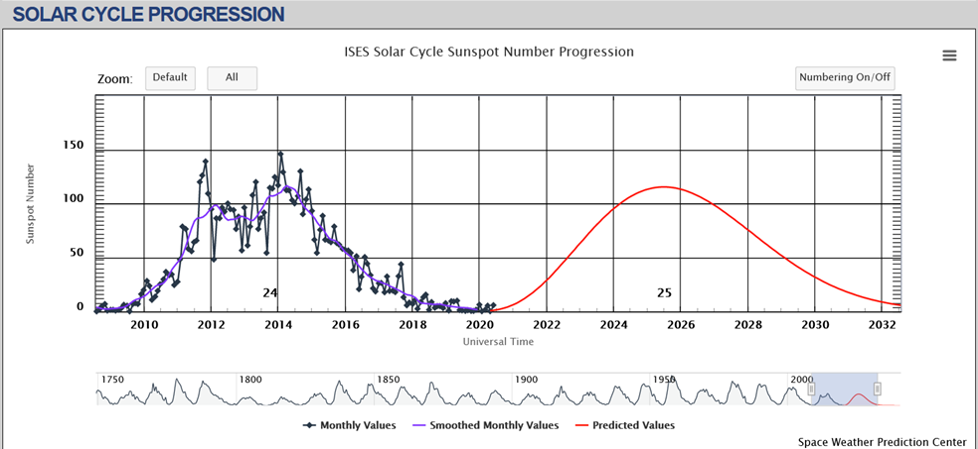
The evolution of SC25 can be followed against the forecast at NOAA's dedicated solar cycle page at https://www.swpc.noaa.gov/products/solar-cycle-progression The forecast comes from the Solar Cycle Prediction Panel representing NOAA, NASA and the International Space Environmental Services (ISES). This amounts to the "official" forecast for the solar cycle. The Prediction Panel forecasts the sunspot number expected for solar maximum and has predicted Cycle 25 to reach a maximum of 115 occurring in July 2025. The error bars on this prediction mean the panel expects the cycle maximum could be between 105-125 with the peak occurring between November 2024 and March 2026. There's a similar set-up for the solar 10.7 cm radio flux.
Review of solar activity
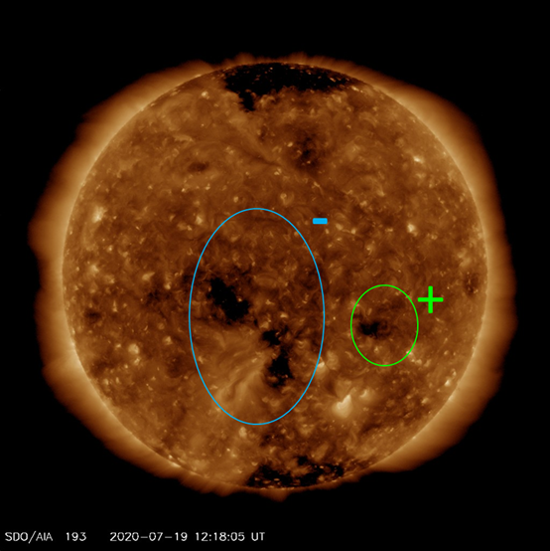
Solar activity was at very low levels. The Sun was spotless most of the week, with some small spots visible on 15, 17 and 18 July. The 10.7cm solar radio flux ranged between 67 and 69 sfu. No earth-directed coronal mass ejections (CMEs) were observed in the available coronagraphic imagery. A small positive polarity equatorial coronal hole (CH) and an extension to the southern polar CH transited the central meridian on 16-17 July. A large negative polarity equatorial CH began to transit the central meridian on 19 July (see annotated SDO/AIA 193 image underneath). The greater than 10 MeV proton flux was at nominal values.
PROBA2 Observations (13 Jul 2020 - 19 Jul 2020)
Solar Activity
Solar flare activity was very low during the week.
In order to view the activity of this week in more detail, we suggest to go to the following website from which all the daily (normal and difference) movies can be accessed: https://proba2.oma.be/ssa
This page also lists the recorded flaring events.
A weekly overview movie can be found here (SWAP week 538): https://proba2.sidc.be/swap/data/mpg/movies/weekly_movies/weekly_movie_2020_07_13.mp4
Details about some of this week's events can be found further below.
If any of the linked movies are unavailable they can be found in the P2SC movie repository here: https://proba2.oma.be/swap/data/mpg/movies/
Friday Jul 17
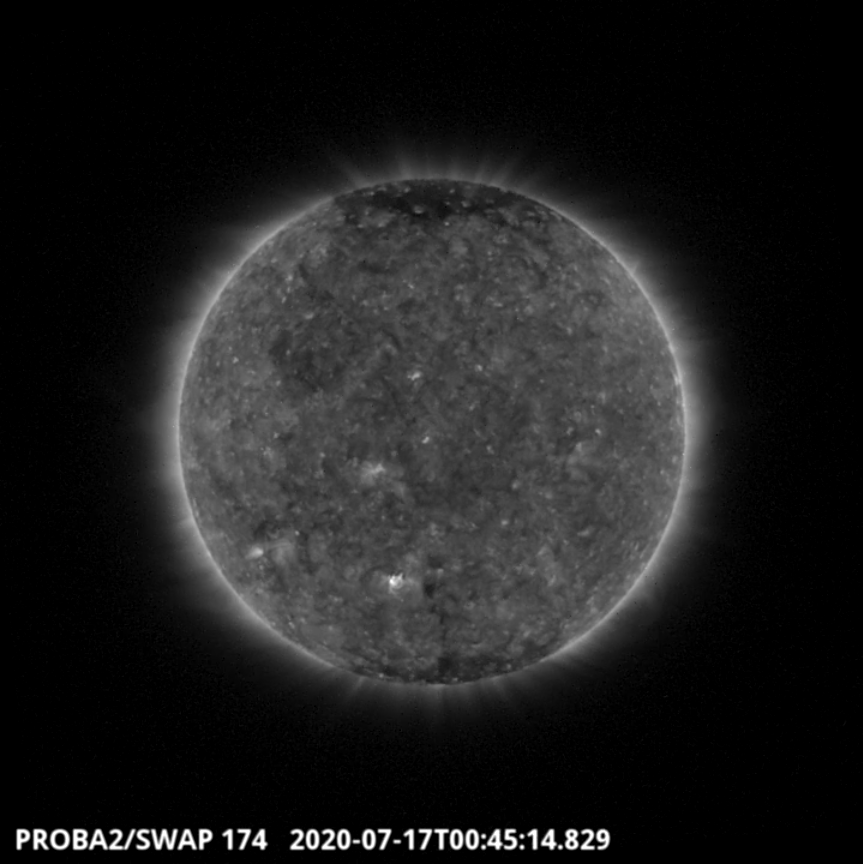
A faint back-sided eruption was observed by SWAP over the west limb of the Sun on 2020-Jul-17 as shown in the SWAP image above taken at 00:45 UT.
Find a movie of the event here (SWAP movie): https://proba2.sidc.be/swap/movies/20200717_swap_movie.mp4
The International Sunspot Number by SILSO
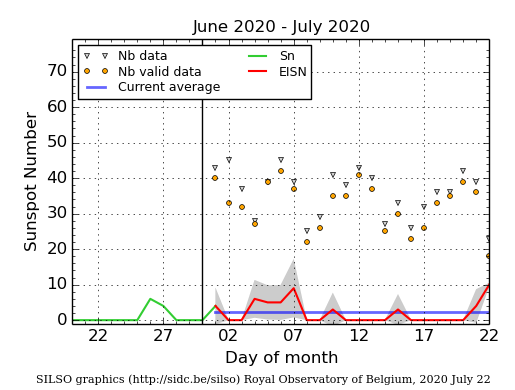
The daily Estimated International Sunspot Number (EISN, red curve with shaded error) derived by a simplified method from real-time data from the worldwide SILSO network. It extends the official Sunspot Number from the full processing of the preceding month (green line). The plot shows the last 30 days (about one solar rotation). The horizontal blue line shows the current monthly average. The grey triangles give the number of stations providing data. The yellow dots give the number of stations that provided valid data. Valid data are used to calculate the EISN. When a grey triangle and a yellow dot coincide, it means that all the observations are used to calculate the EISN of that day.
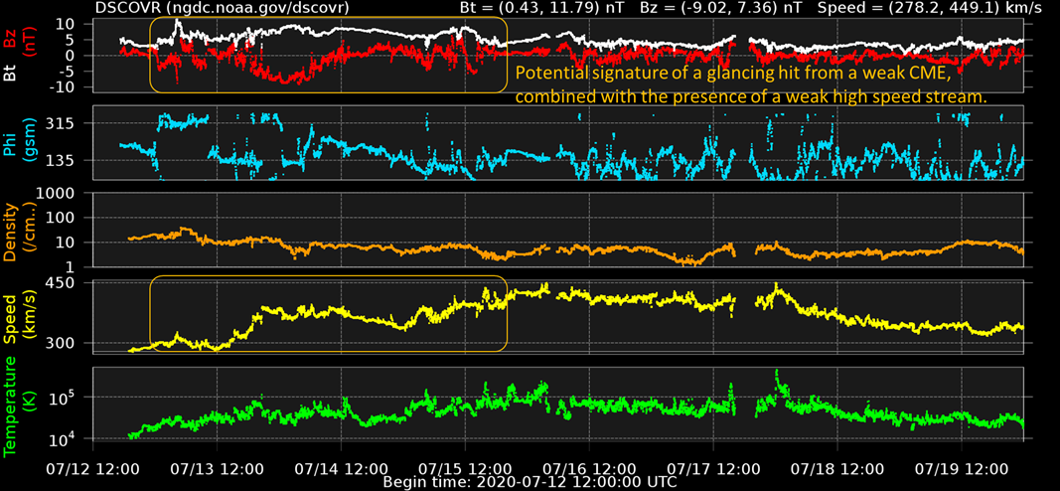
Review of geomagnetic activity
From 13 July, the solar wind conditions became enhanced due to the passage of a weak coronal hole related wind stream and a glancing hit from the slow 08-09 July coronal mass ejection (CME). The wind speed ranged from 280 to 450 km/s and Bz varied between -9 and +7 nT (resp. yellow and red curve in graph underneath). From 17 July, the solar wind speed began to decrease to values between 300 to 350 km/s. The direction of the interplanetary magnetic field (phi angle - blue curve) was predominantly directed away from the Sun (positive sector). Geomagnetic activity was mostly at quiet to unsettled levels with an active period on 14 July. The greater than 2 MeV electron flux was at nominal values.
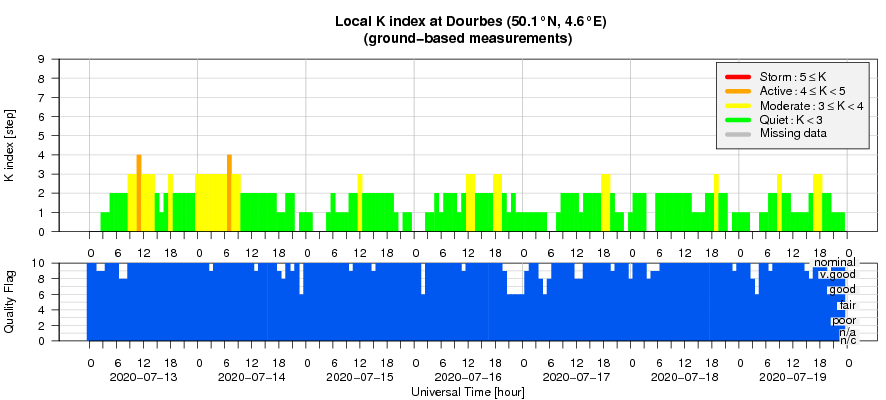
Geomagnetic Observations at Dourbes (13 Jul 2020 - 19 Jul 2020)
The SIDC Space Weather Briefing
The Space Weather Briefing presented by the forecaster on duty from 13 till 19 July. It reflects in images and graphs what is written in the reports on solar and geomagnetic activity.
The pdf-version: http://www.stce.be/briefings/20200720_SWbriefing.pdf
The automatically running presentation: http://www.stce.be/briefings/20200720_SWbriefing.wmv
Review of ionospheric activity (13 Jul 2020 - 19 Jul 2020)
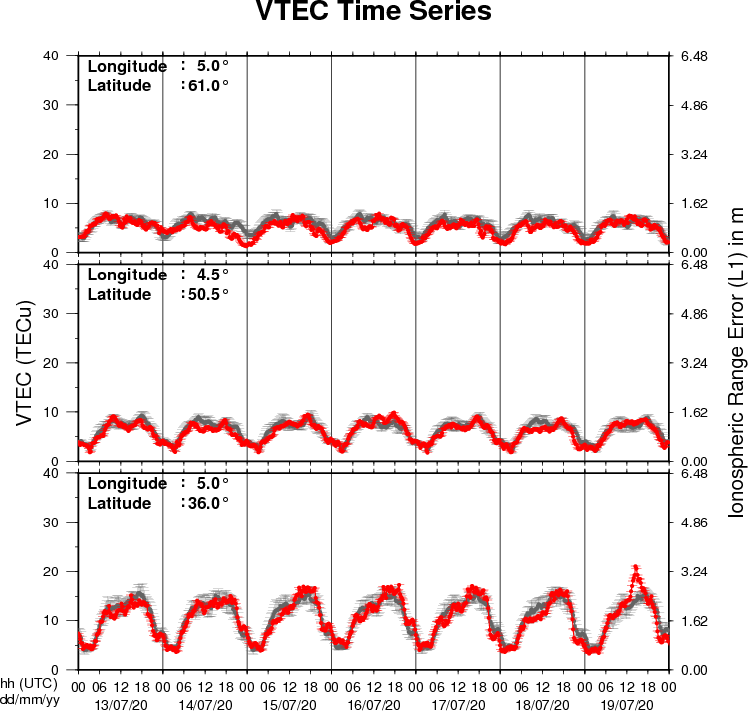
The figure shows the time evolution of the Vertical Total Electron Content (VTEC) (in red) during the last week at three locations:
a) in the northern part of Europe(N61°, 5°E)
b) above Brussels(N50.5°, 4.5°E)
c) in the southern part of Europe(N36°, 5°E)
This figure also shows (in grey) the normal ionospheric behaviour expected based on the median VTEC from the 15 previous days.
The VTEC is expressed in TECu (with TECu=10^16 electrons per square meter) and is directly related to the signal propagation delay due to the ionosphere (in figure: delay on GPS L1 frequency).
The Sun's radiation ionizes the Earth's upper atmosphere, the ionosphere, located from about 60km to 1000km above the Earth's surface.The ionization process in the ionosphere produces ions and free electrons. These electrons perturb the propagation of the GNSS (Global Navigation Satellite System) signals by inducing a so-called ionospheric delay.
See http://stce.be/newsletter/GNSS_final.pdf for some more explanations ; for detailed information, see http://gnss.be/ionosphere_tutorial.php