- Table of Content
- 1.The tale of a ...
- 2.Review of sola...
- 3.PROBA2 Observa...
- 4.The Internatio...
- 5.Review of geom...
- 6.Geomagnetic Ob...
- 7.The SIDC Space...
- 8.Review of iono...
2. Review of solar activity
3. PROBA2 Observations (20 Jul 2020 - 26 Jul 2020)
4. The International Sunspot Number by SILSO
5. Review of geomagnetic activity
6. Geomagnetic Observations at Dourbes (20 Jul 2020 - 26 Jul 2020)
7. The SIDC Space Weather Briefing
8. Review of ionospheric activity (20 Jul 2020 - 26 Jul 2020)
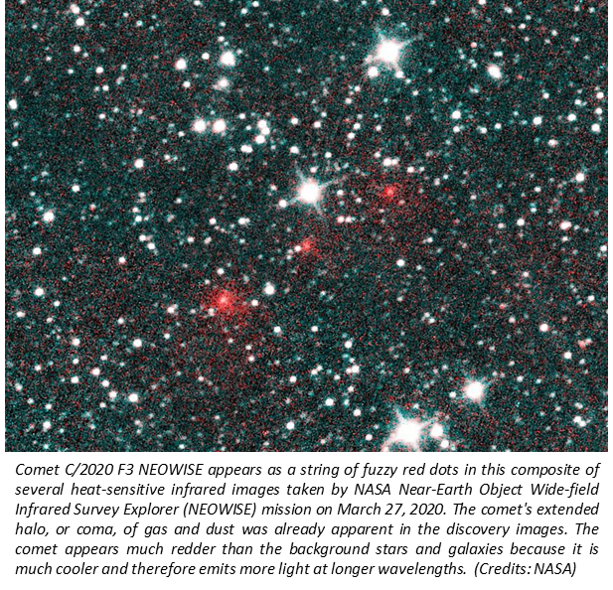
The tale of a comet's tail
Comet NEOWISE was discovered by NASA's Wide-field Infrared Survey Explorer (WISE) on 27 March 2020, as part of the NEOWISE program (NEO: Near-Earth Object). At that time, the comet was at a distance of more than twice the sun-earth distance from the Sun, and obviously very dim.
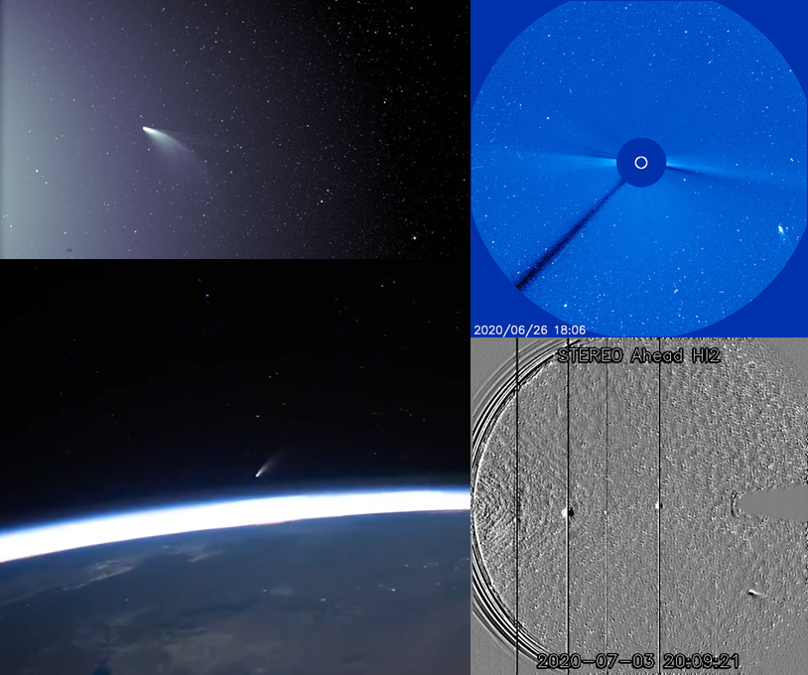
All that changed as its orbit brought this 5-km wide solitary traveller, consisting of ice and rock, ever closer to our star. Eventually, on 3 July, it passed the Sun at only 43 million km, that's within Mercury's orbit and very similar to the intended closest distance of Solar Orbiter (http://www.stce.be/news/487/welcome.html ). The collage underneath shows pictures of comet NEOWISE taken by a fleet of satellites: Parker Solar Probe (upper left), the ISS (lower left), SOHO (upper right), and STEREO-A (lower right). The comet became visible with the naked eye, putting on a great display for observers in the northern hemisphere as it became slightly brighter than the North Star (Polaris). Meanwhile, the comet has receded from the Sun and -since 23 July- also from the Earth, and one needs already a small binocular to have a decent view of the comet.
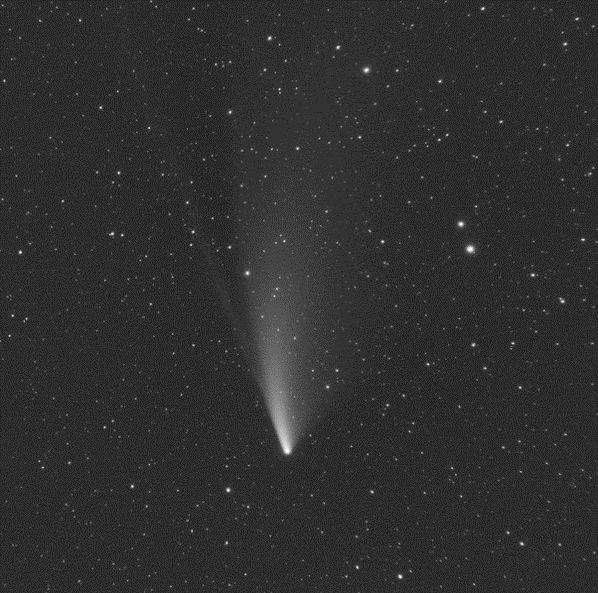
Emil Kraaikamp of the Royal Observatory of Belgium imaged the comet on 20 July from the Netherlands using a monochrome camera and a 35 mm lens. The animation (available at http://www.stce.be/news/489/welcome.html ; image below) shows the movement of the comet in about 1 hour time. Despite this short timeframe, the comet can be seen moving against the background stars. Careful examination reveals the comet has two tails: a dust tail, which is the wide fan-shaped tail pointing mostly upwards in this image, and an ion tail which is the relatively narrow and straight streak pointing to the upper left. An ion tail forms when ultraviolet sunlight rips one or more electrons from gas atoms in the particle cloud around the comet's nucleus, turning them into ions (charged particles). The solar wind then carries these ions straight outward and away from the Sun along the magnetic field lines that are draped around the comet. This is why an ion tail is always pointing away from the Sun. Occasionally, when there is a sufficiently strong disturbance in the solar wind such a from a coronal mass ejection, this tail can get detached from the comet. This is called a disconnection event, an example of which has been described in the STCE Newsitem of 28 January 2015 (see http://www.stce.be/news/292/welcome.html ).
Review of solar activity
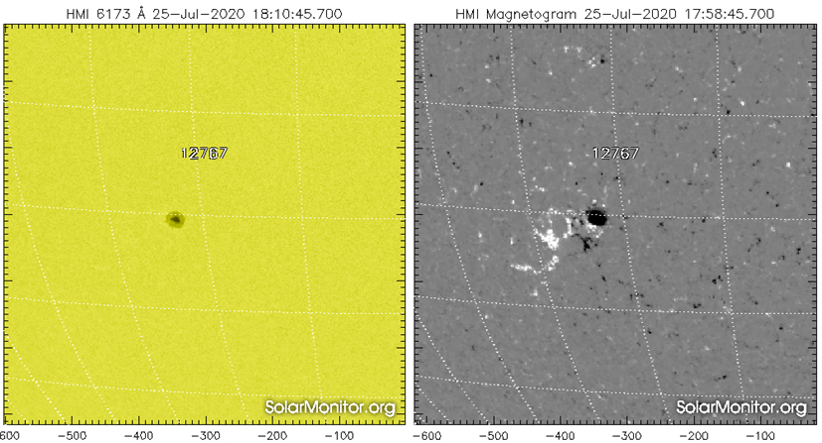
The solar activity was quiet over the past week. A unipolar sunspot (Catania sunspot group 37, NOAA Active 2767) emerged on July 22. It remained stable and did not produce any flaring activity. The X-ray flux remained below C-class flare level for the whole week.
An Earth-directed partial halo Coronal Mass Ejection was observed in both STEREO/COR2 on July 19 around 4:00 UTC and SOHO/LASCO-C2 on July 19 around 12:00 UTC (blue-dashed outline in difference coronagrahic image underneath). It was a slow-moving ejecta with an initial deprojected speed of about 210 km/s into a slow background solar wind speed (320 km/s). A coronal dimming (indicated in blue in SDO/AIA 193 image underneath) was visible on the surface close to the origin of the ejecta (near 32 degree latitude north and 32 degree longitude east).
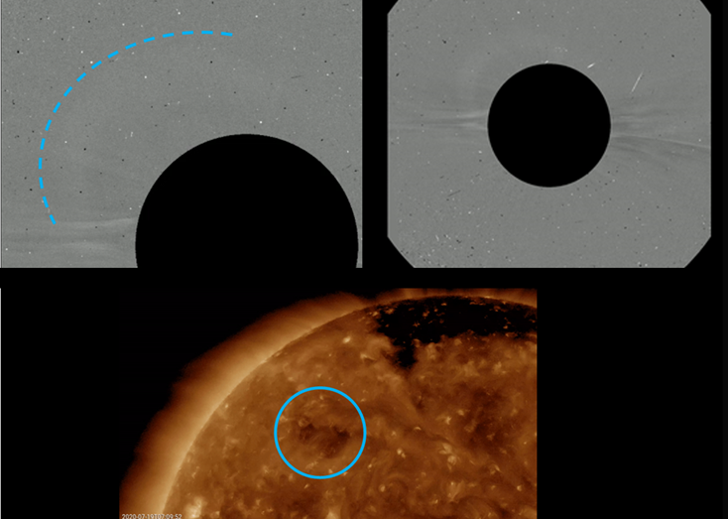
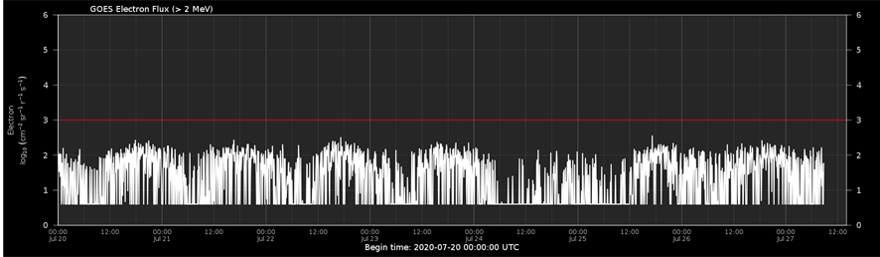
The greater than 10 MeV proton flux was at background levels over the past week. The greater than 2 MeV electron flux was at nominal levels over the past week (see GOES chart underneath).
PROBA2 Observations (20 Jul 2020 - 26 Jul 2020)
Solar Activity
Solar flare activity was very low during the week.
In order to view the activity of this week in more detail, we suggest to go to the following website from which all the daily (normal and difference) movies can be accessed: https://proba2.oma.be/ssa
This page also lists the recorded flaring events.
A weekly overview movie can be found here (SWAP week 539).
http://proba2.oma.be/swap/data/mpg/movies/weekly_movies/weekly_movie_2020_07_20.mp4
Details about some of this week's events can be found further below.
If any of the linked movies are unavailable they can be found in the P2SC movie repository here
https://proba2.oma.be/swap/data/mpg/movies/
Tuesday Jul 21
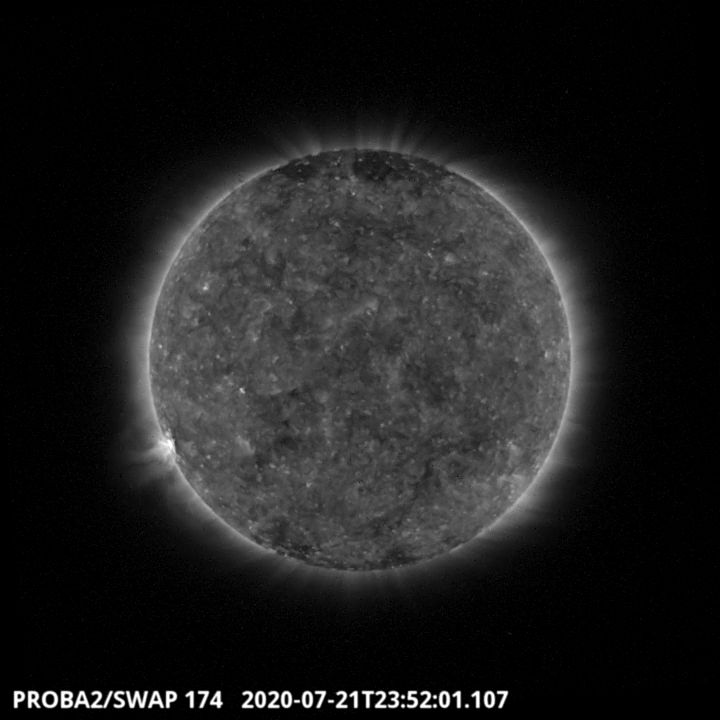
An AR of solar cycle 25 has emerged on the southwest part of the solar disk on July 22, 2020, it can be seen in the SWAP image above around 23:52 UT. This AR has been labelled NOAA 2767 and has been visible until the end of the week. However, no LYRA flare has been recorded during this week. Find a movie of the events here (SWAP movie) http://proba2.oma.be/swap/data/mpg/movies/20200721_swap_movie.mp4
The International Sunspot Number by SILSO
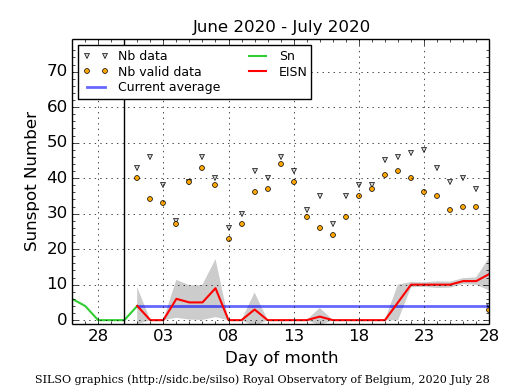
The daily Estimated International Sunspot Number (EISN, red curve with shaded error) derived by a simplified method from real-time data from the worldwide SILSO network. It extends the official Sunspot Number from the full processing of the preceding month (green line). The plot shows the last 30 days (about one solar rotation). The horizontal blue line shows the current monthly average. The grey triangles give the number of stations providing data. The yellow dots give the number of stations that provided valid data. Valid data are used to calculate the EISN. When a grey triangle and a yellow dot coincide, it means that all the observations are used to calculate the EISN of that day.
Review of geomagnetic activity
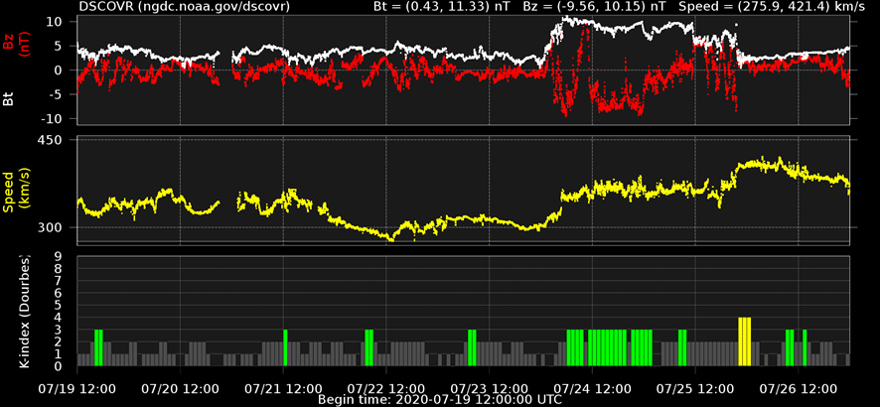
The solar wind conditions were at nominal levels at the beginning of the week, with the solar wind speed ranging between 276 km/s and 366 km/s (from DSCOVR data, yellow curve). On July 24, the solar wind parameters became enhanced due to the arrival of combined effects from the Coronal Mass Ejection impact and the solar wind coming from the negative polarity equatorial coronal holes that crossed the central meridian on July 20. The solar wind speed increased up to 443 km/s, the interplanetary magnetic field reached 11.3 nT and the magnetic component Bz fluctuated between 9.6 nT and 10.2 nT (from DSCOVR data ; resp. white and red curve).
The geomagnetic conditions were quiet with short periods of unsettled conditions in the beginning of the week. In response to the CME impact and arrival of the solar wind associated with the coronal hole, periods of active geomagnetic condition were observed on July 25 and 26.
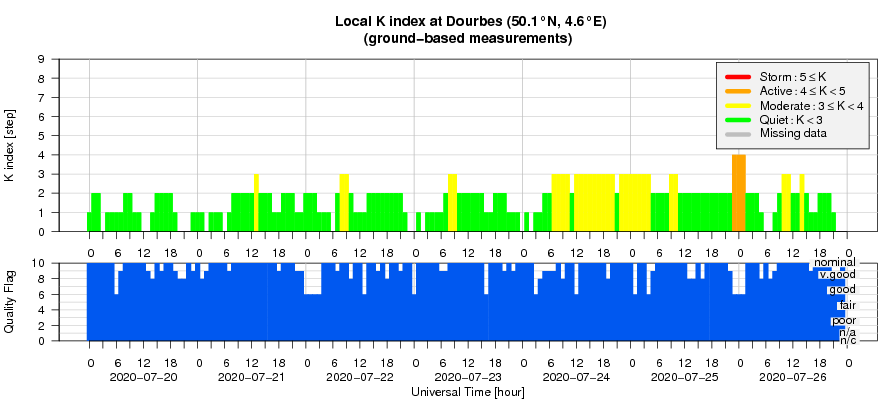
Geomagnetic Observations at Dourbes (20 Jul 2020 - 26 Jul 2020)
The SIDC Space Weather Briefing
The Space Weather Briefing presented by the forecaster on duty from 20 till 26 July. It reflects in images and graphs what is written in the reports on solar and geomagnetic activity.
The pdf-version: http://www.stce.be/briefings/20200727_SWbriefing.pdf
The automatically running presentation: http://www.stce.be/briefings/20200727_SWbriefing.wmv
Review of ionospheric activity (20 Jul 2020 - 26 Jul 2020)
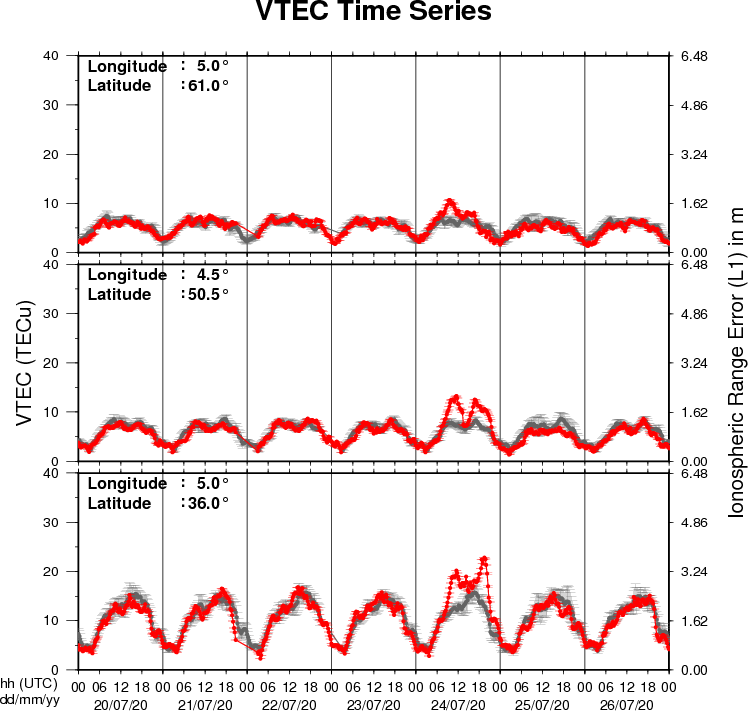
The figure shows the time evolution of the Vertical Total Electron Content (VTEC) (in red) during the last week at three locations:
a) in the northern part of Europe(N61°, 5°E)
b) above Brussels(N50.5°, 4.5°E)
c) in the southern part of Europe(N36°, 5°E)
This figure also shows (in grey) the normal ionospheric behaviour expected based on the median VTEC from the 15 previous days.
The VTEC is expressed in TECu (with TECu=10^16 electrons per square meter) and is directly related to the signal propagation delay due to the ionosphere (in figure: delay on GPS L1 frequency).
The Sun's radiation ionizes the Earth's upper atmosphere, the ionosphere, located from about 60km to 1000km above the Earth's surface.The ionization process in the ionosphere produces ions and free electrons. These electrons perturb the propagation of the GNSS (Global Navigation Satellite System) signals by inducing a so-called ionospheric delay.
See http://stce.be/newsletter/GNSS_final.pdf for some more explanations ; for detailed information, see http://gnss.be/ionosphere_tutorial.php