- Table of Content
- 1.A prominence e...
- 2.Review of sola...
- 3.The Internatio...
- 4.PROBA2 Observa...
- 5.Review of geom...
- 6.Geomagnetic Ob...
- 7.The SIDC Space...
- 8.Review of iono...
2. Review of solar activity
3. The International Sunspot Number by Silso
4. PROBA2 Observations (27 Jul 2020 - 2 Aug 2020)
5. Review of geomagnetic activity
6. Geomagnetic Observations at Dourbes (27 Jul 2020 - 2 Aug 2020)
7. The SIDC Space Weather Briefing
8. Review of ionospheric activity (27 Jul 2020 - 2 Aug 2020)
A prominence erupts
Solar prominences are clouds of charged particles ("plasma") above the solar surface squeezed between magnetic regions of opposite polarity. Being cooler and denser than the plasma underneath and their surroundings, they appear as bright blobs when seen near the solar limb and as dark lines when seen on the solar disk (then they are called "filaments"). Special filters are required to observe these features, such as in the Hydrogen-alpha (H-alpha) line in the red part of the solar spectrum, or in some extreme ultraviolet (EUV) passbands.
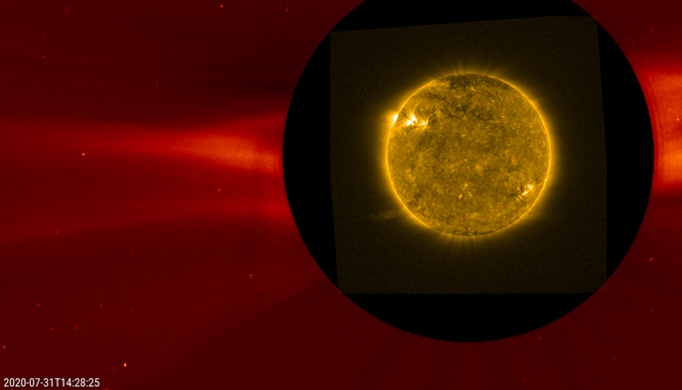
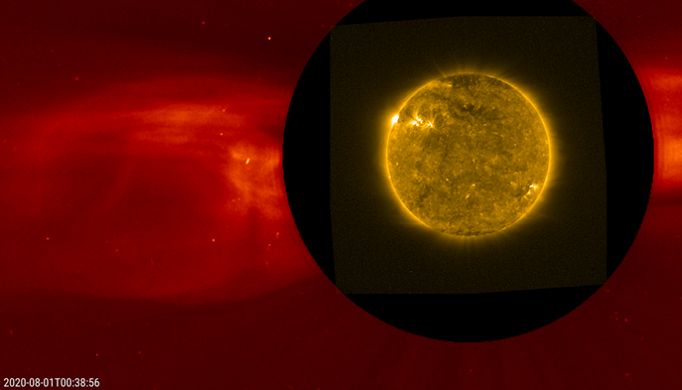
The imagery above is a solar image in extreme ultraviolet taken by the PROBA2/SWAP instrument (https://proba2.sidc.be/ ), overlaid on a coronagraphic image taken by SOHO/LASCO C2 (https://sohowww.nascom.nasa.gov/ ) in white light. A movie of the event is at http://www.stce.be/news/490/welcome.html The prominence is located near the southeast solar limb ("lower left"). Just prior to the eruption, it towered about 160.000 km above the solar surface, that's about half the Earth-Moon distance. The SWAP image shows the prominence shortly after the eruption started. In the second image, taken 10 hours after the first one, the prominence has disappeared but the coronagraphic image now clearly shows a coronal mass ejection (CME) propagating in an eastward direction ("to the left"), so not directed to Earth.
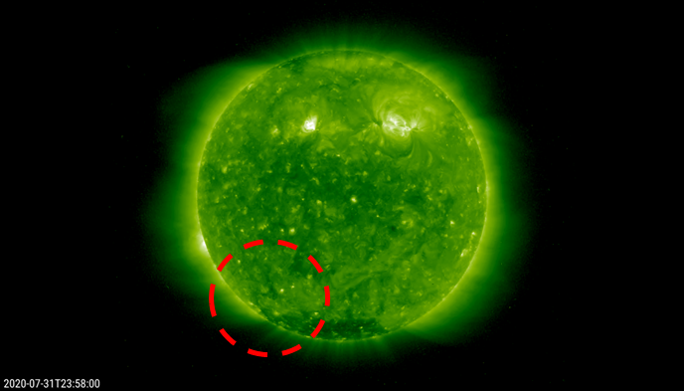
STEREO-A (https://stereo-ssc.nascom.nasa.gov/ ) had a much better view on the eruption, as its current location provides a good view on the east limb. Surprizingly, the eruption was a lot less impressive than the views from Earth. Some faint magnetic reconnection can be seen in the southeast portion of the image, as annotated above.
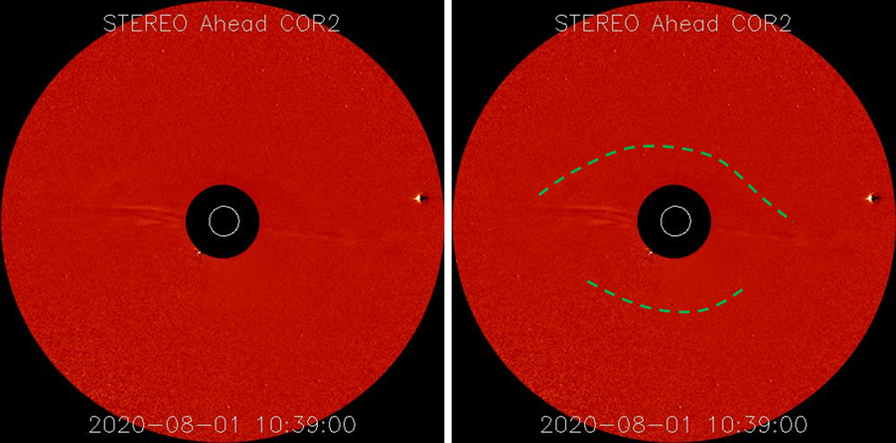
The associated CME was directed to STEREO-A. It can be seen in the STEREO-A/COR2 coronagraphic imagery, however it is very faint and barely visible. In the annotated image the brighter portions of this slow-moving CME have been indicated in dashed green. At the time of this writing, the CME had not reached the spacecraft yet.
Review of solar activity
The solar activity was quiet. Three unipolar active regions were observed on the solar disc. Sunspot group Catania 37/NOAA-AR 2767, classified as Alpha/Hsx emerged on the disc on July 22nd. NOAA-AR 2768, classified most of the time as Alpha/Axx, rotated from the north-east limb on the disc and could be observed from Earth on July 27th. The third active region, NOAA-AR 2769, classified as Alpha/Axx and at the same latitude as NOAA-AR 2768, became visible on Aug 1st. All three active regions remained stable and did not produce any significant flares. Only one single B-class flare was measured and the X-ray flux remained below C-class flare level.
Three Coronal Mass Ejections (CMEs) were released by the Sun, on July 28th, July 29th and July 31st. The CME on July 31st was related to a prominence eruption. All CMEs originated from the east-limb, yet none of them had an Earth-directed component and therefore, no impact on Earth was to be expected.
The greater than 10 MeV proton flux remained at background levels and the greater than 2 MeV electron flux was oscillating between nominal and moderate levels, remaining well under events alert threshold.
The International Sunspot Number by Silso
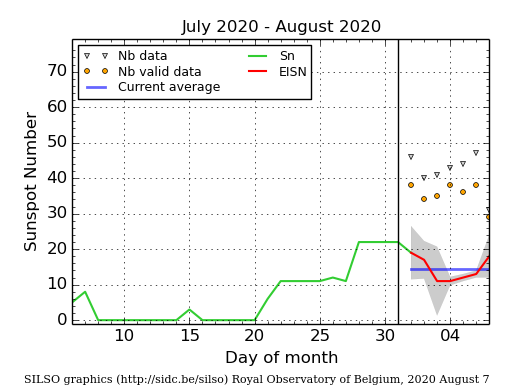
The daily Estimated International Sunspot Number (EISN, red curve with shaded error) derived by a simplified method from real-time data from the worldwide SILSO network. It extends the official Sunspot Number from the full processing of the preceding month (green line). The plot shows the last 30 days (about one solar rotation). The horizontal blue line shows the current monthly average. The yellow dots gives the number of stations that provided valid data. Valid data are used to calculate the EISN. The triangle gives the number of stations providing data. When a triangle and a yellow dot coincide, it means that all the data is used to calculate the EISN of that day.
PROBA2 Observations (27 Jul 2020 - 2 Aug 2020)
Solar Activity
Solar flare activity was very low during the week.
In order to view the activity of this week in more detail, we suggest to go to the following website from which all the daily (normal and difference) movies can be accessed: https://proba2.oma.be/ssa
This page also lists the recorded flaring events.
A weekly overview movie can be found here (SWAP week 540): https://proba2.sidc.be/swap/data/mpg/movies/weekly_movies/weekly_movie_2020_07_27.mp4
Details about some of this week's events can be found further below.
If any of the linked movies are unavailable they can be found in the P2SC movie repository here: https://proba2.oma.be/swap/data/mpg/movies/
Friday Jul 31
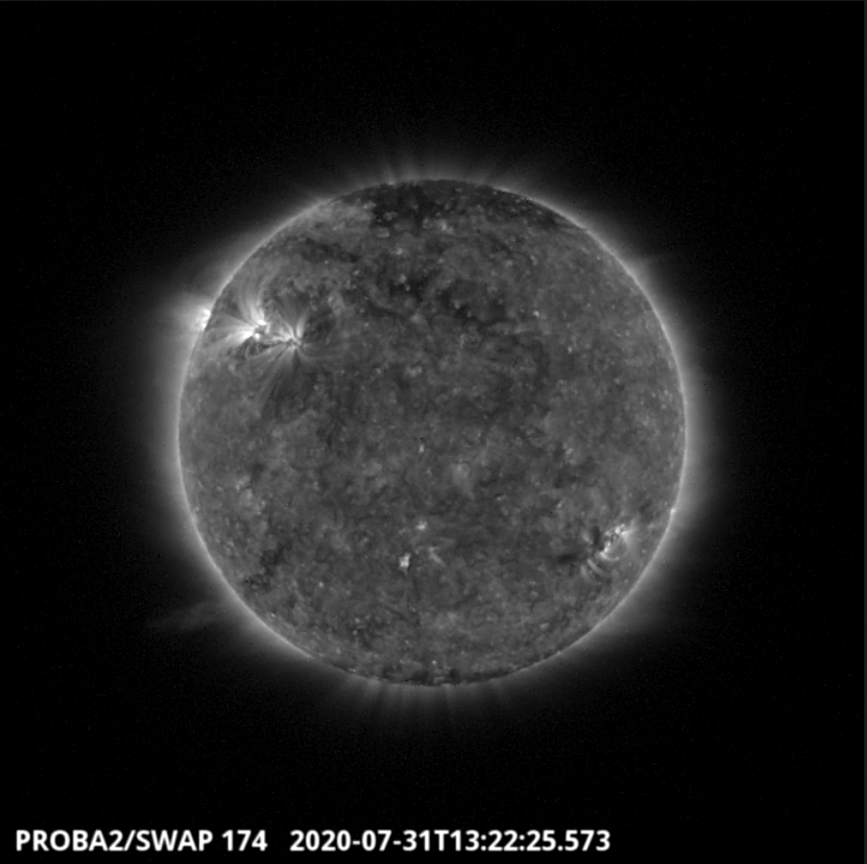
A prominence eruption was observed by SWAP on the south-east limb of the Sun on 2020-Jul-31 as shown in the SWAP image above taken at 13:22 UT.
Find a movie of the event here (SWAP movie): https://proba2.sidc.be/swap/movies/20200731_swap_movie.mp4
Review of geomagnetic activity
The solar wind conditions (based on DSCOVR and ACE data) were at slightly elevated levels at the beginning of the week, due to the high speed stream (HSS) from a negative polarity coronal hole (CH 63), which had crossed the central meridian on July 23rd. The solar wind speed was in the range of 360 km/s to 440 km/s from July 27th until midday of July 28th. On July 29th, the solar wind parameters relaxed to nominal conditions typical for pristine slow solar wind. The solar wind velocity smoothly decreased from 390km/s to 320 km/s.
On Aug 2nd, a co-rotating interaction region (CIR) arrived at Earth. It was a precursor of the HSS originating from a recurrent positive polarity coronal hole (CH 64), which resided in the northern hemisphere and crossed the central meridian on July 30th. The CIR was registered approximately at 04:30 UTC and continued to influence the solar wind parameters throughout the rest of the day, causing enhancements in the density, temperature, velocity and magnetic field. The magnitude of the interplanetary magnetic field reached 12 nT at 11:50 UTC with a minimum Bz component of -10 nT and solar wind speed of 374 km/s (as reported by DSCOVR). Moderate Bz fluctuations were observed throughout Aug 2nd with solar wind speed increasing to 520 km/s.
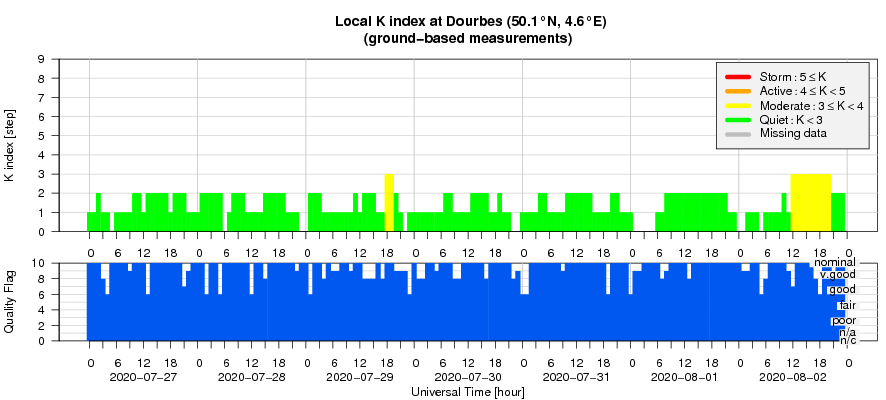
The geomagnetic conditions were quiet. The global geomagnetic condition remained quiet with a maximum value of the Kp NOAA index equal to 2. At the end of the week on Aug 2nd in response to the CIR impact and the arrival of the HSS associated with CH 64, long periods of unsettled geomagnetic condition were observed with Kp NOAA and K Dourbes indices equal to 3.
Geomagnetic Observations at Dourbes (27 Jul 2020 - 2 Aug 2020)
The SIDC Space Weather Briefing
The Space Weather Briefing presented by the forecaster on duty from July 27 to August 2. It reflects in images and graphs what is written in the Solar and Geomagnetic Activity report.

The pdf-version: http://www.stce.be/briefings/20200803_SWbriefing.pdf
The automatically running presentation: http://www.stce.be/briefings/20200803_SWbriefing.ppsm
Review of ionospheric activity (27 Jul 2020 - 2 Aug 2020)
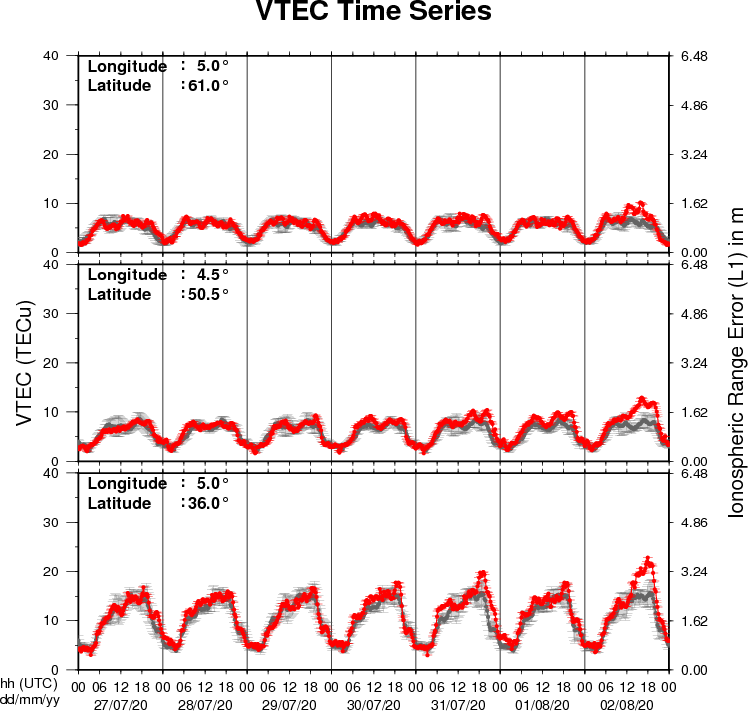
The figure shows the time evolution of the Vertical Total Electron Content (VTEC) (in red) during the last week at three locations:
a) in the northern part of Europe(N61°, 5°E)
b) above Brussels(N50.5°, 4.5°E)
c) in the southern part of Europe(N36°, 5°E)
This figure also shows (in grey) the normal ionospheric behaviour expected based on the median VTEC from the 15 previous days.
The VTEC is expressed in TECu (with TECu=10^16 electrons per square meter) and is directly related to the signal propagation delay due to the ionosphere (in figure: delay on GPS L1 frequency).
The Sun's radiation ionizes the Earth's upper atmosphere, the ionosphere, located from about 60km to 1000km above the Earth's surface.The ionization process in the ionosphere produces ions and free electrons. These electrons perturb the propagation of the GNSS (Global Navigation Satellite System) signals by inducing a so-called ionospheric delay.
See http://stce.be/newsletter/GNSS_final.pdf for some more explanations ; for detailed information, see http://gnss.be/ionosphere_tutorial.php