- Table of Content
- 1.C-class flare!
- 2.Space Weather ...
- 3.Review of sola...
- 4.PROBA2 Observa...
- 5.The Internatio...
- 6.Review of geom...
- 7.Geomagnetic Ob...
- 8.The SIDC Space...
- 9.Review of iono...
2. Space Weather Introductory Course
3. Review of solar activity
4. PROBA2 Observations (3 Aug 2020 - 9 Aug 2020)
5. The International Sunspot Number by Silso
6. Review of geomagnetic activity
7. Geomagnetic Observations at Dourbes (3 Aug 2020 - 9 Aug 2020)
8. The SIDC Space Weather Briefing
9. Review of ionospheric activity (3 Aug 2020 - 9 Aug 2020)
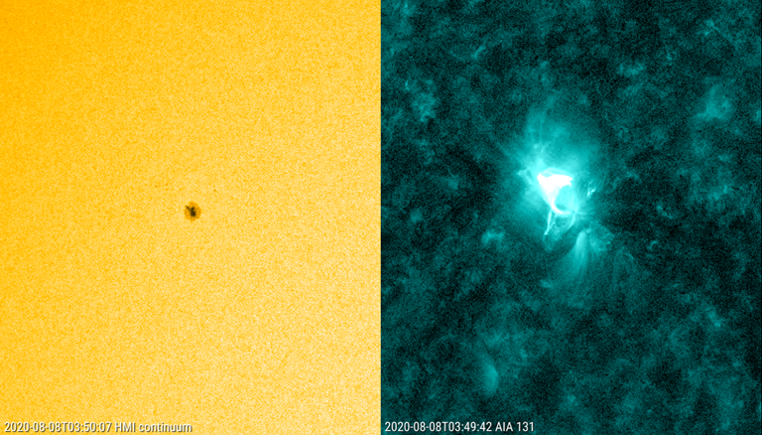
C-class flare!
On 8 August, a C1.5 flare erupted in NOAA 2770. In the image underneath (movie clip at http://www.stce.be/news/491/welcome.html ) one can see on the left a white light image of the sunspot region, and on the right an image in extreme ultraviolet, showing the flare at its peak near 03:49UT. Imagery courtesy of SDO/HMI and /AIA 131 (https://sdo.gsfc.nasa.gov/ ). No coronal mass ejection was associated with this modest eruption.
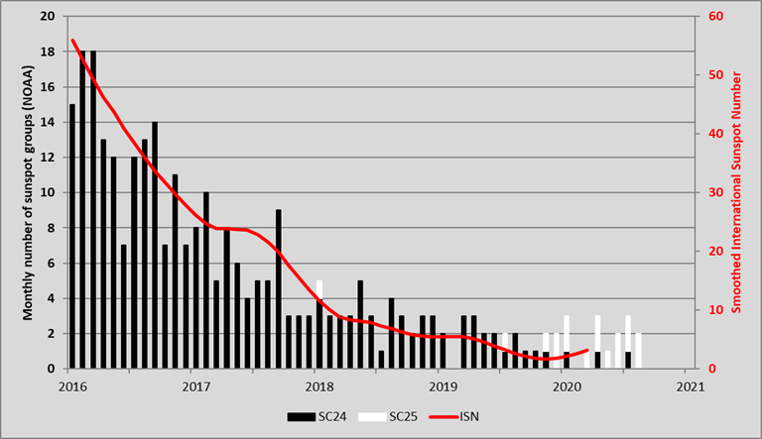
Active region NOAA 2770 has a latitude of +22 degrees and belongs to the new solar cycle 25 (SC25). Putting the monthly number of sunspot regions in a bar chart, and distinguishing the old from the new solar cycle groups by respectively black and white bars, one can see that the number of solar cycle 25 (SC25) groups started to gradually increase during the second half of 2019. This evolution has continued thoughout 2020 (NOAA 2770 already included in the August data). Solar cycle minimum, as represented here by the smoothed monthly sunspot number (SILSO: http://sidc.oma.be/silso/ ) usually takes place within a few months of the break-even between the number of groups from the two cycles, i.e. the month where the number of SC25 groups becomes larger than that from SC24. Current data seems to show that this was indeed the case with a sunspot minimum apparently having occured late 2019.
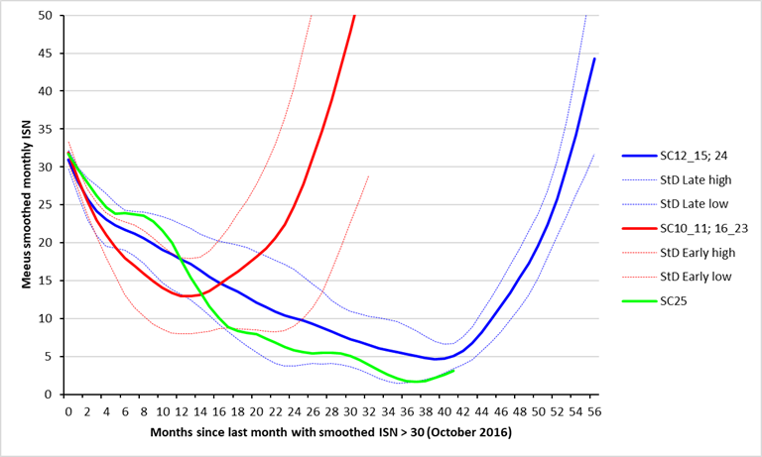
The graph underneath compares the ongoing SC24-25 transit to those from previous solar cycles, based on the International Sunspot Number (ISN). They have been conveniently grouped into two bins: cycles 12-15 and 24 (blue curves), and cycles 10-11 and 16-23 (red curves). The dotted curves indicate the standard deviation from the average curve (thick lines). Point "0" is the last month with a smoothed sunspot number above 30. This value was arbitrarily chosen, but could not be much lower as some cycle minima had smoothed sunspot numbers around 18. Month "0" for the current minimum transit was in October 2016. For the "red" group of solar cycles, a minimum occured on the average 13 months later. However, for the other group (blue curves) this minimum took place only after 39 months. The final timing is mostly determined by the strength of the new cycle: more active cycles tend to start their rise earlier (after 8-15 months; "red" group), though there have been 2 notable exceptions: SC17 and SC22. The smoothed sunspot number suggests a minimum late 2019 near the projected time of minimum of the low activity cycle curves (blue group).
Space Weather Introductory Course
The Space Weather Introductory Course of September is postponed.

Since we don't know how the COVID-19 epidemic will evolve and we can't wait until 2 days before the start of the SWIC to decide if SWIC will take place or not, we decided to postpone it right away. We pinned a new time slot: 23-25 Februari 2021.
But we don't want to leave our 16 participants with empty hands. We will organise in September 15 an online SWIC appetizer.
Keep safe and cool!
Jan, Elke and Petra, for the STCE
Review of solar activity
Three active regions were observed on the side of the Sun seen from Earth. They were labelled NOAA AR 2768, 2769 and 2770. The photospheric magnetic field of NOAA AR 2770 had a beta configuration for a few days. The two other regions had a very simple configuration. The solar flaring activity was low. One C-class flare and 11 B-class flares were reported.
A few narrow, faint, slow and no Earth-directed CMEs were observed.
An equatorial positive polarity coronal hole was observed on the side of the Sun facing Earth. This small coronal hole reached the central meridian in the morning of August 03.
The solar protons remained at the background level. The greater than 2 MeV electron flux reached high levels in response of the enhanced solar wind conditions.
PROBA2 Observations (3 Aug 2020 - 9 Aug 2020)
Solar Activity
Solar flare activity fluctuated between very low and low during the week.
In order to view the activity of this week in more detail, we suggest to go to the following website from which all the daily (normal and difference) movies can be accessed: https://proba2.oma.be/ssa
This page also lists the recorded flaring events.
A weekly overview movie can be found here (SWAP week 541). http://proba2.oma.be/swap/data/mpg/movies/weekly_movies/weekly_movie_2020_08_03.mp4
Details about some of this week's events can be found further below.
If any of the linked movies are unavailable they can be found in the P2SC movie repository here https://proba2.oma.be/swap/data/mpg/movies/
Saturday Aug 08
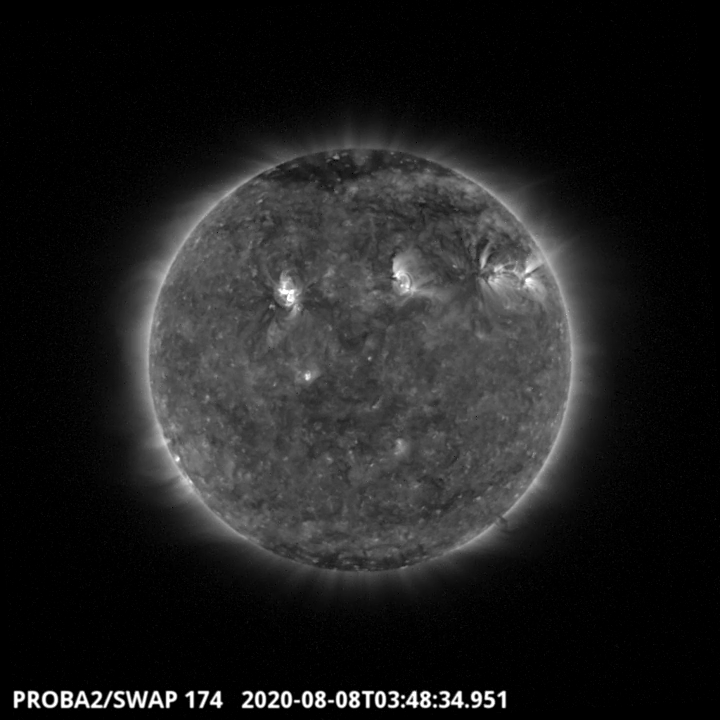
Three active regions are visible on the SWAP image above.The active region which is located on the North-East part of the solar disk has given a flare which around 03:49 UT. It is the largest flare of the week, a C1.5 which came from the active region labelled NOAA 2770. Find a movie of the events here (SWAP movie) http://proba2.oma.be/swap/data/mpg/movies/20200808_swap_movie.mp4
The International Sunspot Number by Silso
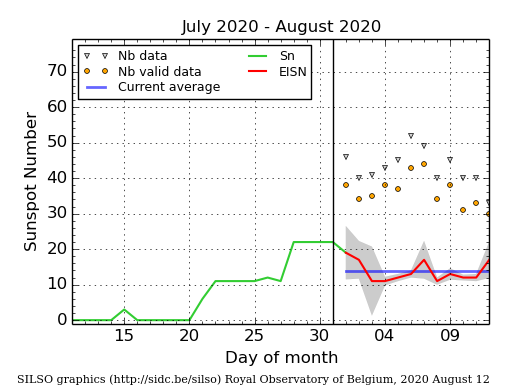
The daily Estimated International Sunspot Number (EISN, red curve with shaded error) derived by a simplified method from real-time data from the worldwide SILSO network. It extends the official Sunspot Number from the full processing of the preceding month (green line). The plot shows the last 30 days (about one solar rotation). The horizontal blue line shows the current monthly average. The yellow dots gives the number of stations that provided valid data. Valid data are used to calculate the EISN. The triangle gives the number of stations providing data. When a triangle and a yellow dot coincide, it means that all the data is used to calculate the EISN of that day.
Review of geomagnetic activity
The first three days, Earth was inside a fast solar wind associated with the low latitude extension of the northern polar coronal hole that reached the central meridian on July 30. The solar wind speed reached 730 km/s, the interplanetary magnetic field magnitude 10 nT.
On August 06, the solar wind parameters like speed, magnetic field and temperature increased. This was possibly associated with the equatorial coronal hole that reached central meridian on August 03.
The geomagnetic field was mostly quiet to unsettled. The few active intervals at the beginning of the week were associated with the fast solar wind. The station at Dourbes reported two active intervals (K=4) in the morning and late evening of August 03. NOAA reported two intervals with Kp=4 in the morning of August 03 and August 04.
Geomagnetic Observations at Dourbes (3 Aug 2020 - 9 Aug 2020)

The SIDC Space Weather Briefing
The Space Weather Briefing presented by the forecaster on duty from August 2 to 9. It reflects in images and graphs what is written in the Solar and Geomagnetic Activity report.
The pdf-version: http://www.stce.be/briefings/20200810_SWbriefing.pdf
The automatically running presentation: http://www.stce.be/briefings/20200810_SWbriefing.ppsm
Review of ionospheric activity (3 Aug 2020 - 9 Aug 2020)
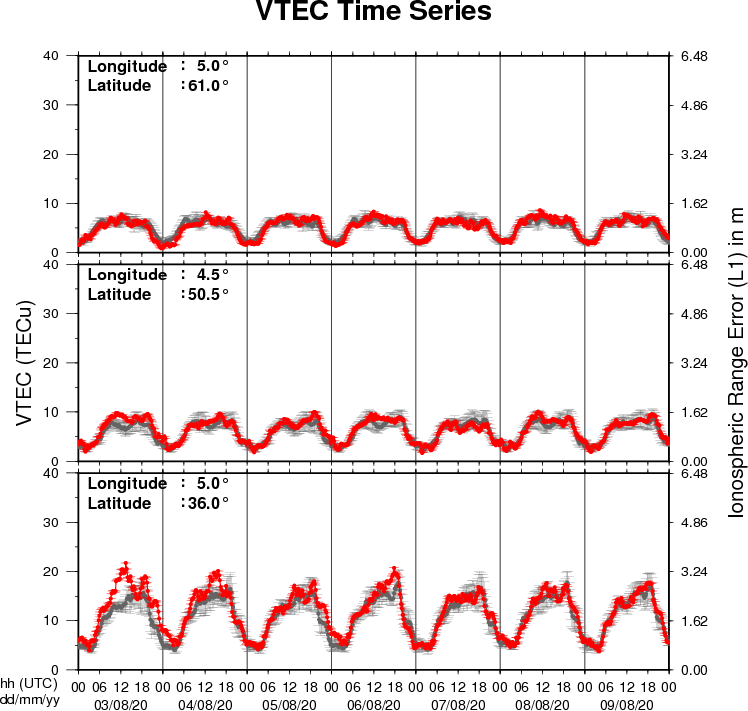
The figure shows the time evolution of the Vertical Total Electron Content (VTEC) (in red) during the last week at three locations:
a) in the northern part of Europe(N61°, 5°E)
b) above Brussels(N50.5°, 4.5°E)
c) in the southern part of Europe(N36°, 5°E)
This figure also shows (in grey) the normal ionospheric behaviour expected based on the median VTEC from the 15 previous days.
The VTEC is expressed in TECu (with TECu=10^16 electrons per square meter) and is directly related to the signal propagation delay due to the ionosphere (in figure: delay on GPS L1 frequency).
The Sun's radiation ionizes the Earth's upper atmosphere, the ionosphere, located from about 60km to 1000km above the Earth's surface.The ionization process in the ionosphere produces ions and free electrons. These electrons perturb the propagation of the GNSS (Global Navigation Satellite System) signals by inducing a so-called ionospheric delay.
See http://stce.be/newsletter/GNSS_final.pdf for some more explanations ; for detailed information, see http://gnss.be/ionosphere_tutorial.php