- Table of Content
- 1.Solar cycle mi...
- 2.Review of sola...
- 3.The Internatio...
- 4.PROBA2 Observa...
- 5.Review of geom...
- 6.Geomagnetic Ob...
- 7.The SIDC Space...
- 8.Review of iono...
2. Review of solar activity
3. The International Sunspot Number by Silso
4. PROBA2 Observations (17 Aug 2020 - 23 Aug 2020)
5. Review of geomagnetic activity
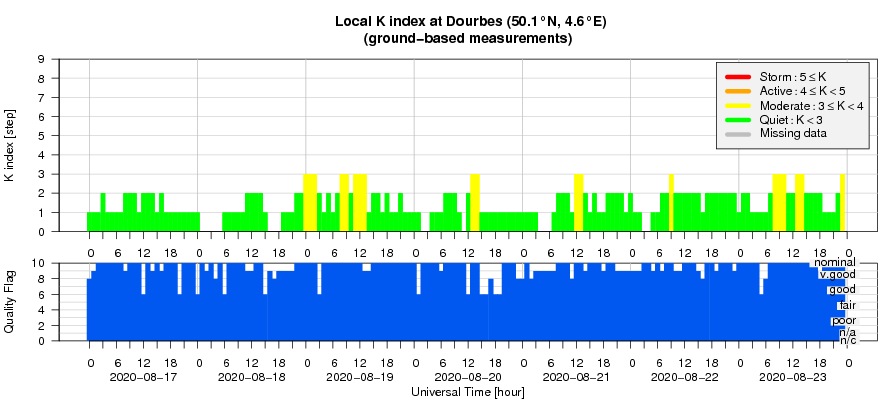
6. Geomagnetic Observations at Dourbes (17 Aug 2020 - 23 Aug 2020)
7. The SIDC Space Weather Briefing
8. Review of ionospheric activity (17 Aug 2020 - 23 Aug 2020)
Solar cycle minimum
SILSO (Sunspot Index and Long-term Solar Observations ; http://sidc.oma.be/silso/ ) is the World Data Center for the production, preservation and dissemination of the international sunspot number. The latter is an important parameter to gauge solar activity, and it is being used in hundreds of science papers every year.
Just last week, it published on its website a newsitem (http://sidc.oma.be/silso/node/166 ) announcing that solar cycle minimum, i.e. the minimum between cycles 24 and 25, most likely has taken place in December 2019. As this concerns a smoothed value, and it is only the very first point indicating a rise of the activity, the date of the minimum still needs a full confirmation over the coming months.
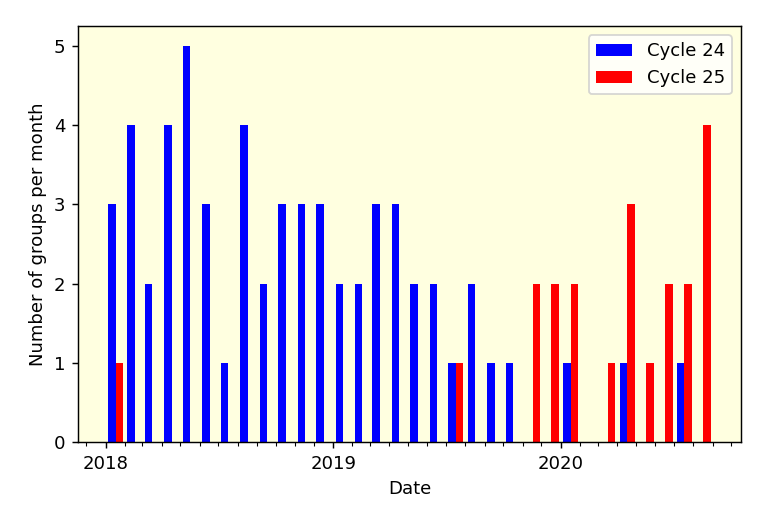
Another indication of the transition between the two cycles can be drawn from counts of individual sunspot groups belonging to the old and new solar cycles. While most sunspot groups belonged to the last solar cycle until September 2019, the dominance switched to groups of the new cycle in November 2019. This can be seen in the graph underneath.
Further information on the solar cycle transition can be found at their website (http://sidc.oma.be/silso/node/166 ).
Review of solar activity
Solar activity was very low.
Two active regions crossed the northern part of the solar disk. AR 12772 was fairly productive, with A and B class flares.
Two plages in the SE quadrant were identified. One was associated with a filament eruption and a coronal mass ejection (CME) and the other with a B-class flare and coronal dimming. The 10.7cm solar radio flux ranged mostly between 70 and 71 sfu.
Two negative polarity equatorial coronal holes (CH) crossed the central meridian, respectively on Aug 17th and Aug 19th. The extension of the northern polar CH crossed the central meridian on Aug 21st.
The greater than 10 MeV proton flux was at background values.
The greater than 2 MeV electron flux was at nominal values at the start of the week and decreased to background later on.
The filament eruption associated with the CME observed on Aug 16th and did not reach Earth, could be traced back to the plage on the SE quadrant and was linked with a B class flare.
The International Sunspot Number by Silso
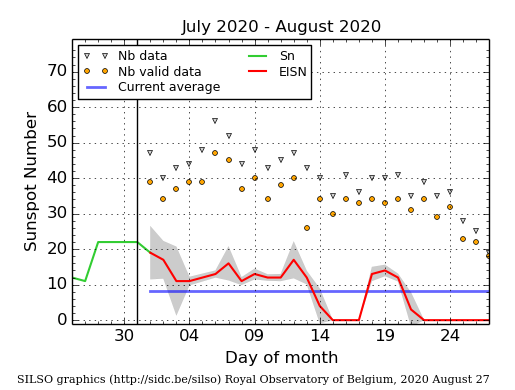
The daily Estimated International Sunspot Number (EISN, red curve with shaded error) derived by a simplified method from real-time data from the worldwide SILSO network. It extends the official Sunspot Number from the full processing of the preceding month (green line). The plot shows the last 30 days (about one solar rotation). The horizontal blue line shows the current monthly average. The yellow dots gives the number of stations that provided valid data. Valid data are used to calculate the EISN. The triangle gives the number of stations providing data. When a triangle and a yellow dot coincide, it means that all the data is used to calculate the EISN of that day.
PROBA2 Observations (17 Aug 2020 - 23 Aug 2020)
Solar Activity
Solar flare activity was very low during the week.
In order to view the activity of this week in more detail, we suggest to go to the following website from which all the daily (normal and difference) movies can be accessed: https://proba2.oma.be/ssa
This page also lists the recorded flaring events.
A weekly overview movie can be found here (SWAP week 543). http://proba2.oma.be/swap/data/mpg/movies/weekly_movies/weekly_movie_2020_08_17.mp4
Details about some of this week's events can be found further below.
If any of the linked movies are unavailable they can be found in the P2SC movie repository here https://proba2.oma.be/swap/data/mpg/movies/
Wednesday Aug 19
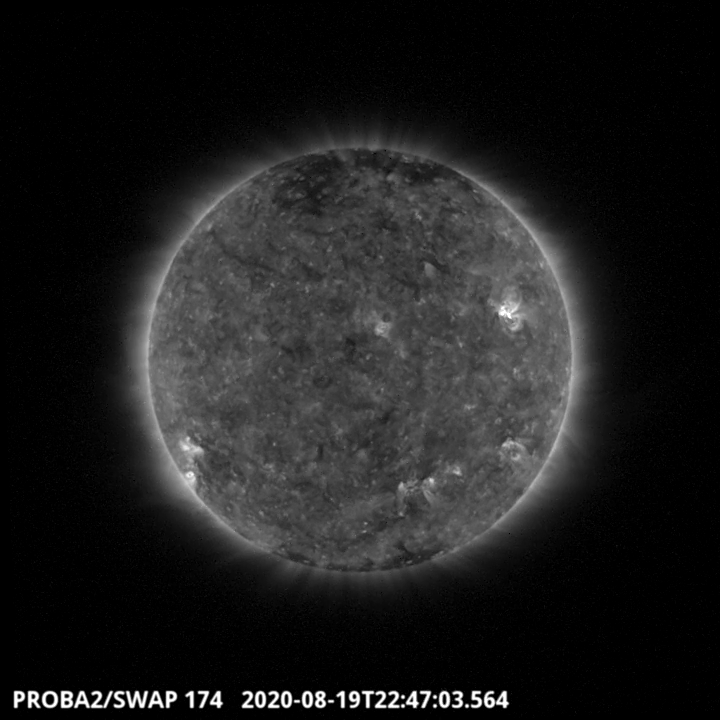
The North West active region has produced several B class flares, the largest one of the week has been recorded as a B3.9- SWAP image. Find a movie of the events here (SWAP movie) http://proba2.oma.be/swap/data/mpg/movies/20200819_swap_movie.mp4
Friday Aug 21
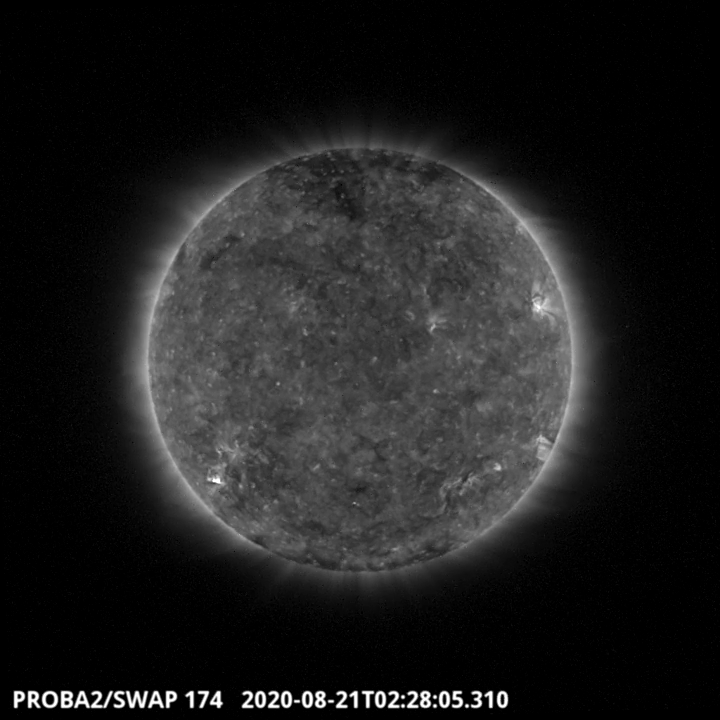
The active region on the South East part of the Solar disk has erupted (B1.6 flare)
and has been followed by a coronal dimming around 02:28 UT- SWAP image. Find a movie of the events here (SWAP movie) http://proba2.oma.be/swap/data/mpg/movies/20200821_swap_movie.mp4
Review of geomagnetic activity
Solar wind was mostly at the slow regime, with a small enhancement that started mid-Aug 21st. Solar wind speed ranged between 280 and 400 km/s, with Bz varying between -8 and +8 nT. The direction of the interplanetary magnetic field was variable during the first half of the week while it was mainly at the negative sector for the second half.
Geomagnetic activity was at quiet to unsettled.
Geomagnetic Observations at Dourbes (17 Aug 2020 - 23 Aug 2020)
The SIDC Space Weather Briefing
The Space Weather Briefing presented by the forecaster on duty from August 16 to 23. It reflects in images and graphs what is written in the Solar and Geomagnetic Activity report.
The pdf-version: http://www.stce.be/briefings/20200824_SWbriefing.pdf
The automatically running presentation: http://www.stce.be/briefings/20200824_SWbriefing.ppsm
Review of ionospheric activity (17 Aug 2020 - 23 Aug 2020)
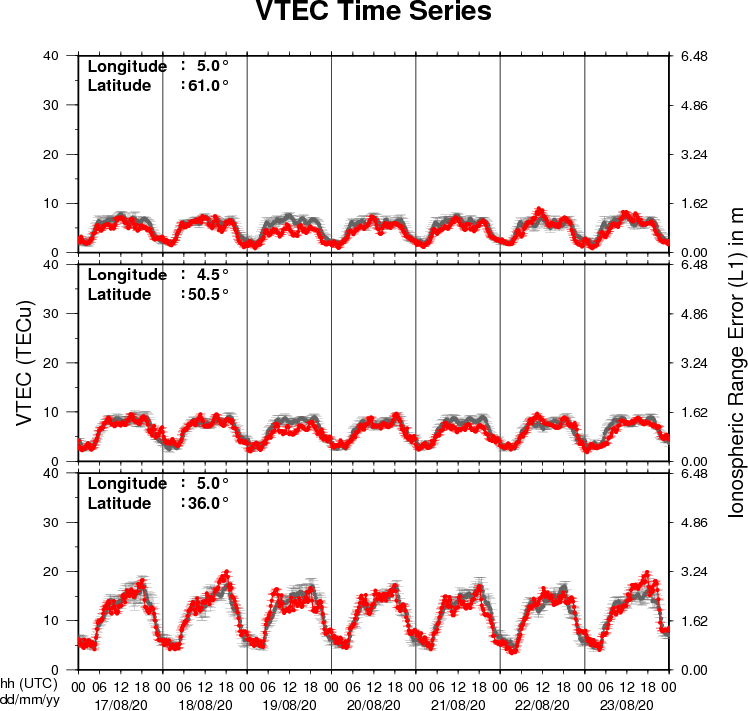
The figure shows the time evolution of the Vertical Total Electron Content (VTEC) (in red) during the last week at three locations:
a) in the northern part of Europe(N61°, 5°E)
b) above Brussels(N50.5°, 4.5°E)
c) in the southern part of Europe(N36°, 5°E)
This figure also shows (in grey) the normal ionospheric behaviour expected based on the median VTEC from the 15 previous days.
The VTEC is expressed in TECu (with TECu=10^16 electrons per square meter) and is directly related to the signal propagation delay due to the ionosphere (in figure: delay on GPS L1 frequency).
The Sun's radiation ionizes the Earth's upper atmosphere, the ionosphere, located from about 60km to 1000km above the Earth's surface.The ionization process in the ionosphere produces ions and free electrons. These electrons perturb the propagation of the GNSS (Global Navigation Satellite System) signals by inducing a so-called ionospheric delay.
See http://stce.be/newsletter/GNSS_final.pdf for some more explanations ; for detailed information, see http://gnss.be/ionosphere_tutorial.php