- Table of Content
- 1.Neutron counts...
- 2.Soapbox Scienc...
- 3.Review of sola...
- 4.The Internatio...
- 5.PROBA2 Observa...
- 6.Review of geom...
- 7.Geomagnetic Ob...
- 8.The SIDC Space...
- 9.Review of iono...
2. Soapbox Science
3. Review of solar activity
4. The International Sunspot Number by Silso
5. PROBA2 Observations (28 Sep 2020 - 4 Oct 2020)
6. Review of geomagnetic activity
7. Geomagnetic Observations at Dourbes (28 Sep 2020 - 4 Oct 2020)
8. The SIDC Space Weather Briefing
9. Review of ionospheric activity (28 Sep 2020 - 4 Oct 2020)
Neutron counts are maxing!
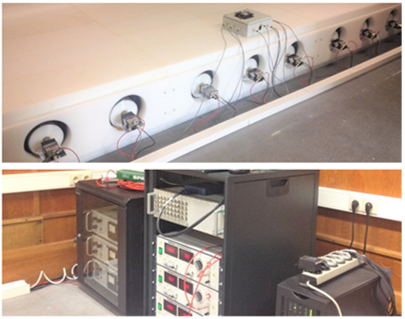
Last week, the Sun was spotless once again. This year already totals 182 spotless days, and though the sunspot minimum has taken place in December 2019 (see http://sidc.be/silso/node/167/#NewSolarActivity ), it takes time for the new solar cycle to shape up. Hence, as we continue to go thru the current solar cycle minimum, the earth environment remains exposed to high-energetic particles coming from outside our solar system, the so-called galactic cosmic rays (GCR - see this STCE newsitem http://www.stce.be/news/433/welcome.html ). When entering the heliosphere, cosmic rays encounter a turbulent solar wind with an embedded heliospheric magnetic field. The higher the solar activity, the more intense and complex this magnetic field, and the more difficult it is for a particle to make it all the way to the Earth. When some finally arrive, they collide with particles in the Earth's atmosphere, creating a shower of secondary particles such as neutrons. These neutrons are detected by neutron monitors such as in Dourbes (http://dourbes.meteo.be/en/products-services/services/cosmicray , see image below) or various other sites around the world (Moscow, Oulu,...). Due to their high energies, cosmic rays and their secondary particles pose important technological and radiation hazards to satellites and aviation.
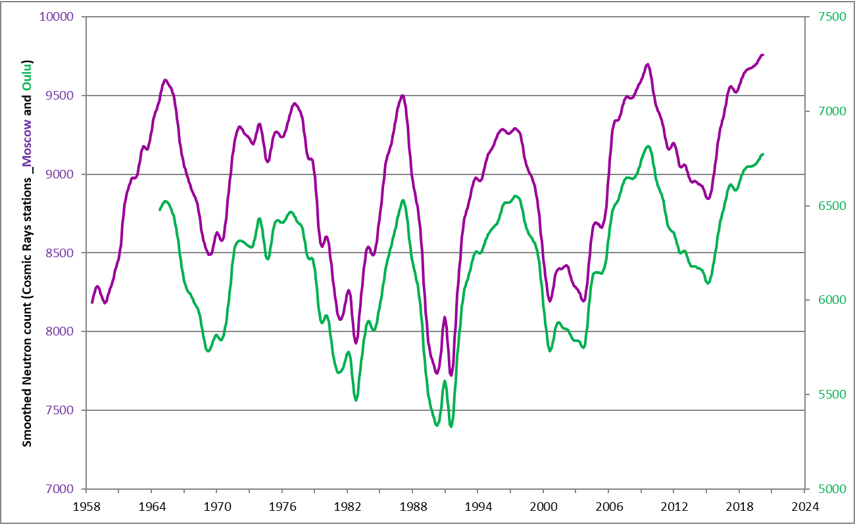
The graph underneath shows the monthly smoothed neutron count (averages per minute) as recorded by the neutron monitors from Moscow (purple, since 1958) and Oulu (green, since 1964). One can readily see the 11 year solar cycle modulation, with particle counts being the highest during low solar activity (solar cycle minimum) and vice versa. There's also a 22 year cycle, consisting of a "pointy" (SC19-20, SC21-22) and a "flat" (SC20-21, SC22-23) maximum in the neutron counts. This is because the cosmic rays are charged particles, and thus they react differently to the different magnetic configuration in the heliosphere created after each polar field reversal on the Sun (the 22-year magnetic cycle). For the ongoing minimum (SC24-25), the maximum of the neutron count should be somewhat flat. From the graphs, it is clear that the neutron counts are at or very near their maximum value, which is very similar to those recorded during the unusual deep and long solar cycle minimum in 2008-2009. Some of the dips in the monthly values are due to high solar activity: many coronal mass ejections act as magnetic shields against the cosmic rays, effectively reducing the final neutron count. As an example, a small dip (remember: smoothed values!) in the neutron counts can be seen in 2017 following the high solar activity in September that year. Studies of cosmic rays are very important, as these massive high-energetic particles pose a formidable radiation hazard to astronauts on a future mission to e.g. Mars or the Moon.
Soapbox Science
Women scientists from Belgium speak about their research - live on social media
On Saturday October 10, from 2 p.m. to 5:10 p.m., seven women scientists in Belgium will tell you about their research during the first Soapbox Science event in Brussels, which will be exceptionally held online due to COVID-19.
Soapbox Science is a science outreach initiative that aims to promote the visibility of women scientists and their research by bringing them on the streets to reach the public. Soapbox Science events transform public areas in discussion forums based on Hyde Park’s Speaker’s Corner where women scientists, on their soapboxes, talk about their research to the people passing by.
Why women scientists? Even today, women scientists constitute a minority in the research field, and their relative number dwindles as the seniority in the field increases. Recent research shows that women face a lot of obstacles from a very young age, notably due to strongly held stereotypes and biases related to the image of the scientist.
For those reasons, Soapbox Science tackles stereotypes, and shows the public that science is not an “old white man’s” business and that anyone has the opportunity to enjoy science in an interactive way.
Soapbox Science was founded in 2011 in London, by Dr Seirian Sumner, from the University of Bristol, and Dr Nathalie Pettorelli, from the Zoological Society of London. The concept went on with great international success, with 42 events in 13 countries in 2019.

Soapbox Science Brussels 2020 will be the first ever Soapbox Science event in Belgium, adding our country to the growing list. However, due to the COVID-19 outbreak, the event will be held online via livestream on the Soapbox Science Brussels YouTube channel and Facebook page instead of taking place in the streets of Brussels. Each speaker will talk about their research and answer questions coming in live from the audience for 20 minutes, with talks in French, Dutch and English. Follow all updates and programme on Twitter @SoapboxscienceB Come hear them talk to discover their fascinating cutting-edge research!
Watch Soapbox Science Brussels 2020 live on October 10, from 2 p.m. on
Soapbox Science Brussels YouTube channel: https://bit.ly/33wJRtP
Facebook page: https://www.facebook.com/SoapboxScienceBrussels/.
Details of the event: http://soapboxscience.org/soapbox-science-2020-brussels/
Review of solar activity
The solar activity was very low, with no sunspots and no flares. The X-ray flux remained below the B-class flare level.
A faint back-sided CME was ejected from the north-east limb on September 30.
No Earth-directed Coronal Mass Ejections (CMEs) were observed in the available chronograph imagery.
The greater than 10 MeV proton flux remained at the background.
The greater than 2 MeV electron flux was well above the 10^3 pfu alert threshold for the entire week with values often exceeding 10^4 pfu.
The International Sunspot Number by Silso

The daily Estimated International Sunspot Number (EISN, red curve with shaded error) derived by a simplified method from real-time data from the worldwide SILSO network. It extends the official Sunspot Number from the full processing of the preceding month (green line). The plot shows the last 30 days (about one solar rotation). The horizontal blue line shows the current monthly average. The yellow dots gives the number of stations that provided valid data. Valid data are used to calculate the EISN. The triangle gives the number of stations providing data. When a triangle and a yellow dot coincide, it means that all the data is used to calculate the EISN of that day.
PROBA2 Observations (28 Sep 2020 - 4 Oct 2020)
Solar Activity
Solar flare activity was very low during the week.
In order to view the activity of this week in more detail, we suggest to go to the following website from which all the daily (normal and difference) movies can be accessed: https://proba2.oma.be/ssa
This page also lists the recorded flaring events.
A weekly overview movie can be found here (SWAP week 549). http://proba2.oma.be/swap/data/mpg/movies/weekly_movies/weekly_movie_2020_09_28.mp4
Details about some of this week’s events can be found further below.
If any of the linked movies are unavailable they can be found in the P2SC movie repository here https://proba2.oma.be/swap/data/mpg/movies/
Monday Sep 28
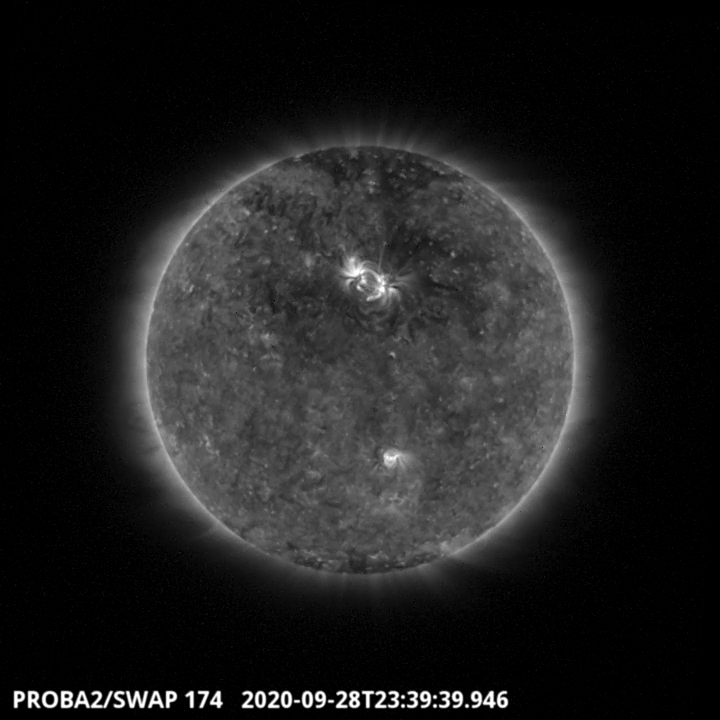
In the northern hemisphere, an elongated coronal hole is visible at the right of a spotless active region in the SWAP image above around 23:39 UT. The active region has been visible during the whole week. Find a movie of the events here (SWAP movie) http://proba2.oma.be/swap/data/mpg/movies/20200928_swap_movie.mp4
Review of geomagnetic activity
The high speed stream (HSS) emanating from a positive polarity coronal hole (CH82) pushed the solar wind parameters measured by DSCOVR and ACE to elevated levels at the beginning of the week. CH82 crossed the central meridian on Sept 26th. The solar wind speed at the L1 point was above 600km/s from the evening of Sept 27th until Oct 1st. The solar wind speed reaching a maximum of 678km/s on Sept 29th. The interplanetary magnetic field went up to 10nT on Sept 27th with a corresponding minimum of the north-south Bz component of -9nT. The enhanced solar wind conditions lasted throughout the middle of the week and started to slowly decline on Oct 1st and Oct 2nd, reaching nominal values by Oct 5th.
The geomagnetic conditions varied greatly throughout the week.
The arrival of the HSS on Sept 27th lead to a short period of moderate global geomagnetic storm with NOAA planetary Kp index equal 6, while locally in Dourbes only minor storm levels were reached (K Dourbes index equal 5).
Minor geomagnetic storms were observed both locally and globally through Sept 28th and Sept 29th, followed by geomagnetically active conditions on Sept 30th and Oct 1st.
On Oct 2nd and Oct 3rd, we experienced short periods of geomagnetically unsettled conditions, while at the end of the week the geomagnetic conditions went back to quiet levels.
Geomagnetic Observations at Dourbes (28 Sep 2020 - 4 Oct 2020)

The SIDC Space Weather Briefing
The Space Weather Briefing presented by the forecaster on duty from September 27 to October 4. It reflects in images and graphs what is written in the Solar and Geomagnetic Activity report.
A pdf-version: http://www.stce.be/briefings/20201005_SWbriefing.pdf
The movie: http://www.stce.be/briefings/20201005_SWbriefing.m4v
Review of ionospheric activity (28 Sep 2020 - 4 Oct 2020)

The figure shows the time evolution of the Vertical Total Electron Content (VTEC) (in red) during the last week at three locations:
a) in the northern part of Europe(N61°, 5°E)
b) above Brussels(N50.5°, 4.5°E)
c) in the southern part of Europe(N36°, 5°E)
This figure also shows (in grey) the normal ionospheric behaviour expected based on the median VTEC from the 15 previous days.
The VTEC is expressed in TECu (with TECu=10^16 electrons per square meter) and is directly related to the signal propagation delay due to the ionosphere (in figure: delay on GPS L1 frequency).
The Sun's radiation ionizes the Earth's upper atmosphere, the ionosphere, located from about 60km to 1000km above the Earth's surface.The ionization process in the ionosphere produces ions and free electrons. These electrons perturb the propagation of the GNSS (Global Navigation Satellite System) signals by inducing a so-called ionospheric delay.
See http://stce.be/newsletter/GNSS_final.pdf for some more explanations ; for detailed information, see http://gnss.be/ionosphere_tutorial.php