- Table of Content
- 1.Tiny... yet sa...
- 2.Magazine: User...
- 3.Review of sola...
- 4.PROBA2 Observa...
- 5.The Internatio...
- 6.Review of geom...
- 7.Geomagnetic Ob...
- 8.The SIDC Space...
- 9.Review of iono...
2. Magazine: User's guide to SWx advisories for Pilots
3. Review of solar activity
4. PROBA2 Observations (12 Oct 2020 - 18 Oct 2020)
5. The International Sunspot Number by Silso
6. Review of geomagnetic activity
7. Geomagnetic Observations at Dourbes (12 Oct 2020 - 18 Oct 2020)
8. The SIDC Space Weather Briefing
9. Review of ionospheric activity (12 Oct 2020 - 18 Oct 2020)
Tiny... yet satisfying
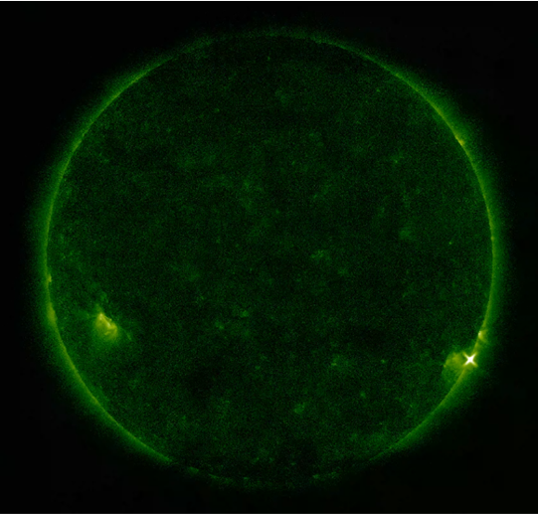
Two C-class flares occurred on the Sun shortly after noon on 16 October: A C1.5 flare peaking at 12:57UT, followed by a C3.5 flare which reached its maximum at 15:11UT. Extreme ultraviolet (EUV) images clearly indicate that the eruption didn't take place in NOAA 2776, the only sunspot region visible on the solar disk at the time. This region was located in the southeast quadrant ("lower left"), whereas both flares originated from a source at or just beyond the southwest limb ("lower right"), most likely NOAA 2774 which was spotless when it rounded the solar limb early on 15 September. The "X" shape of the flares is not specfically related to the eruption, but an image artifact (Note 1).
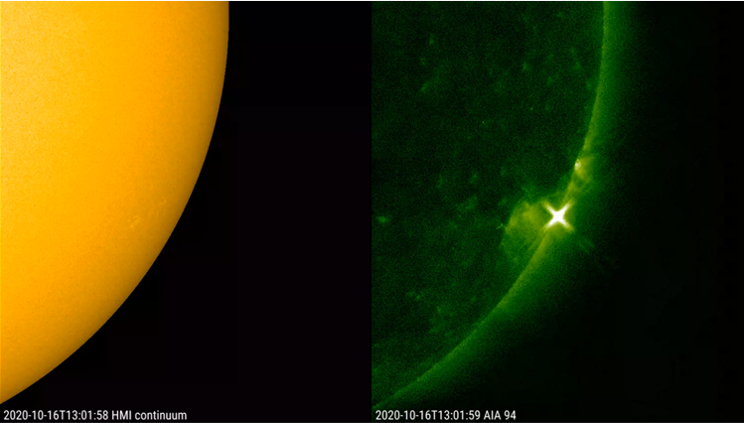
The SDO images (https://sdo.gsfc.nasa.gov/data/aiahmi/ ) underneath show a close-up of the C1.5 flare. On the left a white light image, on the right a view in EUV (AIA 094). The image shows that a nearby spotless region, visible in white light as a faculae field, is not involved in the eruption. Clips are available in the STCE Newsitem at http://www.stce.be/news/499/welcome.html
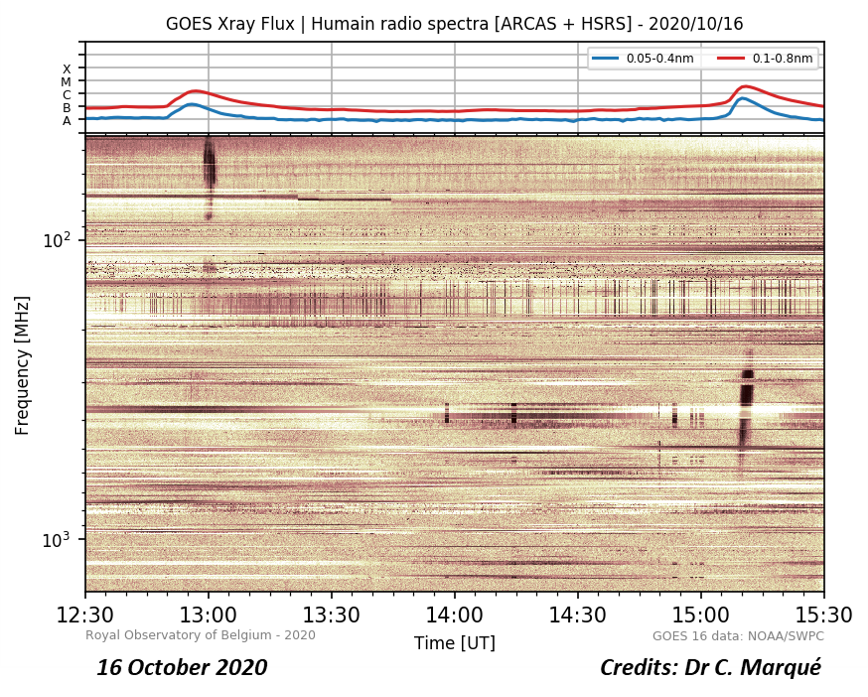
Both flaring events were accompanied by radio disturbances. As they happened during the day, the radioastronomy station at Humain, Belgium (http://www.sidc.be/humain/ ) was able to observe these events. The top of the image underneath shows the evolution of the x-ray flux as measured by the GOES-16 satellite (https://www.swpc.noaa.gov/products/goes-x-ray-flux ) from 12:30UT until 15:30UT. The two flaring events can be seen as slight enhancements, with the second event a bit stronger than the first one. The lower part of the image is the radiospectrogram recorded by Humain. It covers the frequency range from 45 MHz to 1495 MHz (vertical axis; the lowest values are towards the top of the chart), over the same period of time (horizontal axis). One can see that the radio disturbances happen at or shortly after the peak of the flare, with the disturbance related to the first flare happening at lower frequencies (45-85 MHz), i.e. higher in the solar atmosphere, than the second one (200-600 MHz). Also the shape is somewhat different, in this case indicating that in particular the second flare may have been accompanied by a weak coronal mass ejection (CME). The radio bursts are slightly more enhanced than those observed earlier in the year by the Humain station (see this STCE Newsitem http://www.stce.be/news/484/welcome.html ).
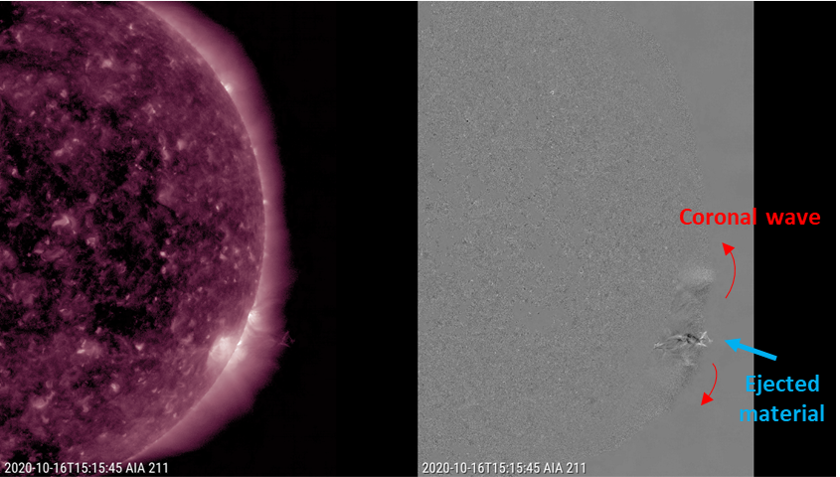
The presence of coronal waves was another hint that both flaring events may have been accompanied by CMEs. Coronal waves (alias EIT waves, alias EUV waves) are bright wave fronts that can be seen propagating through the corona (Sun's hot atmosphere) and are associated with coronal mass ejections (CMEs). This STCE newsitem at http://www.stce.be/news/241/welcome.html provides more info on coronal waves. The waves can best be seen in EUV difference imagery (one image subtracted from the previous), such as in SDO/AIA 211. The annotated image underneath shows EUV images of the Sun, and on the right the difference image. Coronal waves can be seen emanating from the blast site, and in particular the northern portion can be observed very well during both flaring events. The EUV images also show that during the second flaring event, some mass was ejected.
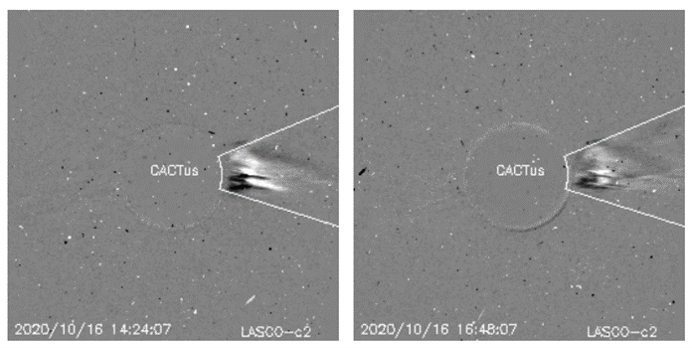
Sure enough, two small CMEs were observed at the solar west limb by SOHO's coronagraphs (https://sohowww.nascom.nasa.gov/ ). Underneath difference images are showing both CMEs, in each case about 1.5 hours after the peak of the flaring event (CACTus, http://www.sidc.oma.be/cactus/ ). Due to their location and small size, these CMEs will not influence the earth environment.
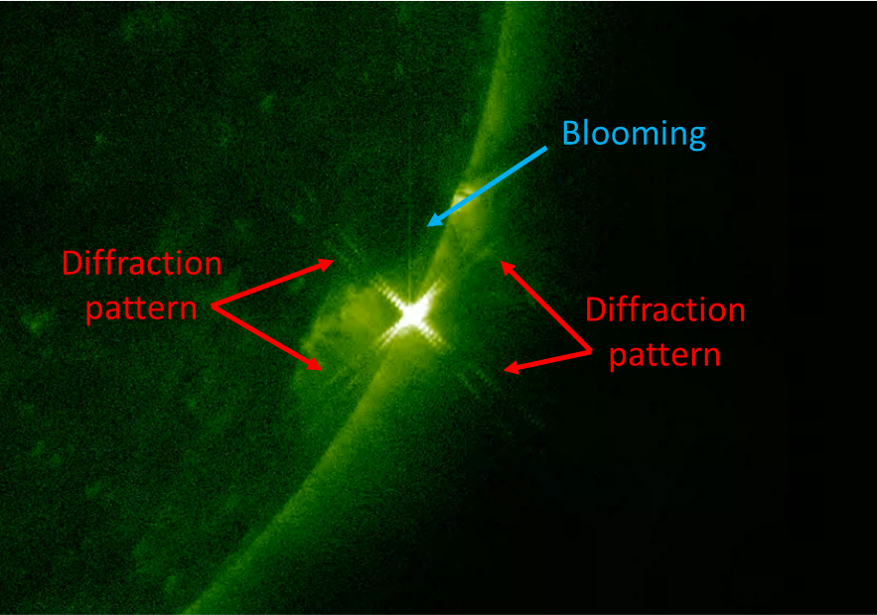
Note 1 - During large flares, EUV imagery such as from SDO/AIA often exhibit image artifacts called "blooming" and "diffraction fringes" as can be seen in the annotated image underneath. Pixels from the CCD camera can get saturated and lose their ability to accommodate additional charge, which therefore spreads into neighboring pixels, causing either erroneous measurements or further saturation. Such spread of charge is named "blooming" and typically shows up as a bright artifact along a privileged axis in the image. The optical setup of each AIA telescope is characterized by structures with uniform wire meshes used to support the thin filters that create the EUV passbands. The interaction between the incoming EUV radiation and the grids generates a diffraction effect depending on the source intensity ("diffraction fringes"). Interestingly, a paper by Torre et al. (2015 - https://ui.adsabs.harvard.edu/abs/2015InvPr..31i5006T/abstract ) has shown that these image artifacts can be used to restore the original image (de-saturated). Of note is that the effects of blooming and diffraction are a lot smaller with PROBA2/SWAP telescope, because of respectively the special detector (CMOS active pixel system) and the special characteristics of the nickel grid in the front filter (see Seaton et al. 2013 at https://ui.adsabs.harvard.edu/abs/2013SoPh..286...43S/abstract ).
Magazine: User's guide to SWx advisories for Pilots
If you take a flight, you want to be sure that it is safe. The aviation sector is aware of the potential negative impact of space weather on radiation at flight level, on long distance radio communication and satellite navigation. PECASUS (http://pecasus.eu) is one of the three global centers that provides a space weather service. The STCE is part of PECASUS and monitors space weather 24/7 and makes the advisories which are sent to airliners. Pilots have to interpret these.

Check out the user's guide to SWx advisories: http://www.stce.be/PECASUS_guide4pilots
Review of solar activity
Three active regions were observed on the side of the solar disc facing Earth: Catania sunspot groups 43, 44 and 45 (NOAA AR 2774, 27754 and 2776, respectively). Two C-class and 20 B-class flares reported, under scribing low solar activity. Both C flares originated from the NOAA AR 2775, at the time when this region was at the West solar limb.
A few narrow, faint and slow CMEs were observed.
The solar protons remained at the background level.
One, small, low latitude (S15 to S35) negative polarity coronal hole was observed on the side of the Sun facing Earth. This coronal hole reached the central meridian on October 15, in the morning.
PROBA2 Observations (12 Oct 2020 - 18 Oct 2020)
Solar Activity
Solar flare activity fluctuated between very low and low during the week.
In order to view the activity of this week in more detail, we suggest to go to the following website from which all the daily (normal and difference) movies can be accessed: https://proba2.oma.be/ssa
This page also lists the recorded flaring events.
A weekly overview movie can be found here (SWAP week 551). http://proba2.oma.be/swap/data/mpg/movies/weekly_movies/weekly_movie_2020_10_12.mp4
Details about some of this week’s events can be found further below.
If any of the linked movies are unavailable they can be found in the P2SC movie repository here https://proba2.oma.be/swap/data/mpg/movies/
Friday Oct 16
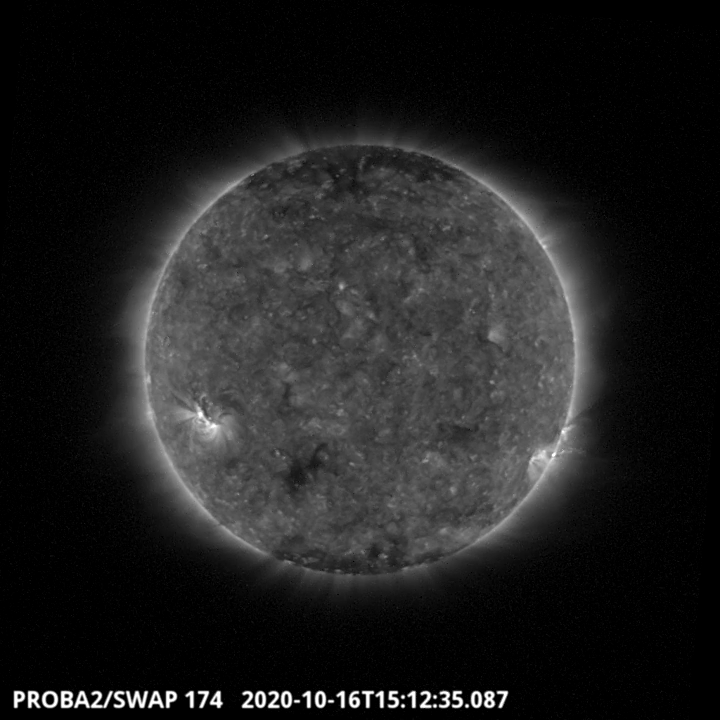
The biggest flare of the week occured on the west limb of the Sun around 15:12UT. It has been classified as a C3.5 and it is visible on the SWAP image above. Find a movie of the events here (SWAP movie) http://proba2.oma.be/swap/data/mpg/movies/20201016_swap_movie.mp4
Sunday Oct 18
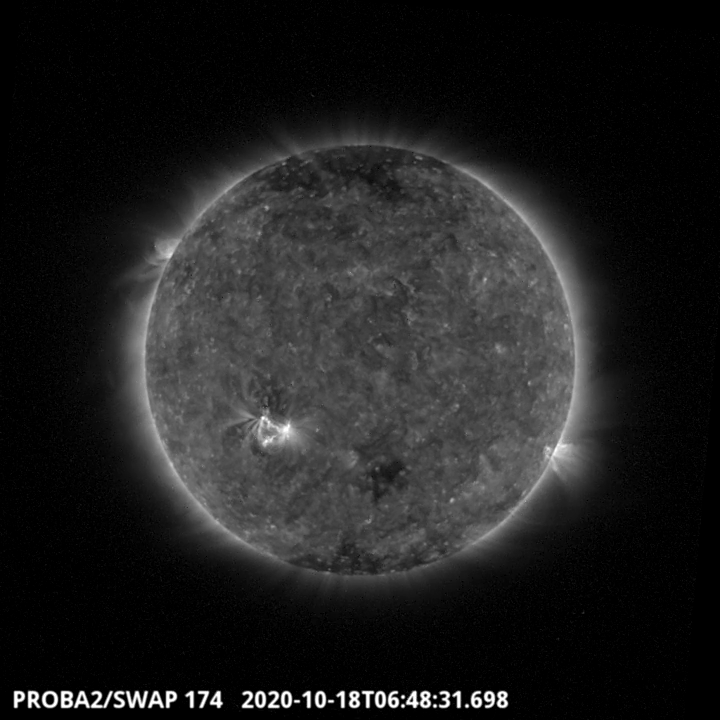
A small coronal hole in the southern part of the solar disk transited the central meridian around 06:48 UT. It is visible on the SWAP image above. Find a movie of the events here (SWAP movie) http://proba2.oma.be/swap/data/mpg/movies/20201018_swap_movie.mp4
The International Sunspot Number by Silso
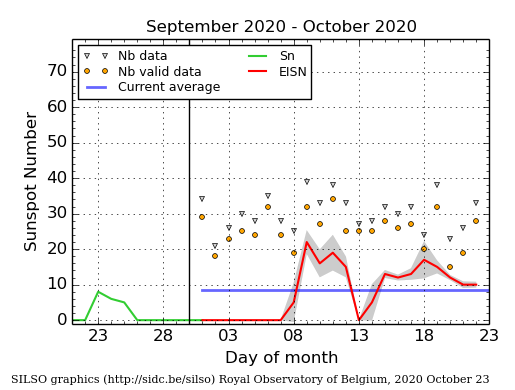
The daily Estimated International Sunspot Number (EISN, red curve with shaded error) derived by a simplified method from real-time data from the worldwide SILSO network. It extends the official Sunspot Number from the full processing of the preceding month (green line). The plot shows the last 30 days (about one solar rotation). The horizontal blue line shows the current monthly average. The yellow dots gives the number of stations that provided valid data. Valid data are used to calculate the EISN. The triangle gives the number of stations providing data. When a triangle and a yellow dot coincide, it means that all the data is used to calculate the EISN of that day.
Review of geomagnetic activity
Earth was exposed to a slow solar wind of, most of the time, 300 km/s. The last two days of the week, the solar wind speed slightly increased and fluctuated between 310 and 350 km/s.
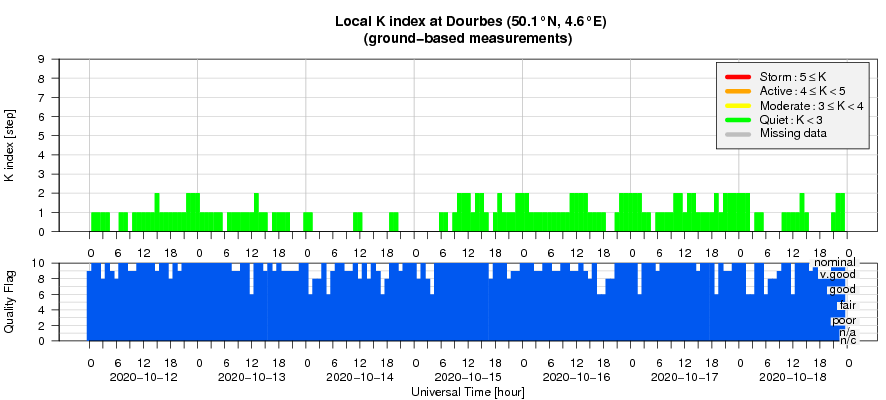
The geomagnetic conditions were quiet. The station at Dourbes reported K indices of max =2. This was similar at the planetary level: NOAA reported a Kp of max 2.
Geomagnetic Observations at Dourbes (12 Oct 2020 - 18 Oct 2020)
The SIDC Space Weather Briefing
The Space Weather Briefing presented by the forecaster on duty from October 11 to 18. It reflects in images and graphs what is written in the Solar and Geomagnetic Activity report.

A pdf-version: http://www.stce.be/briefings/20201019_SWbriefing.pdf
The movie: http://www.stce.be/briefings/20201019_SWbriefing.m4v
Review of ionospheric activity (12 Oct 2020 - 18 Oct 2020)
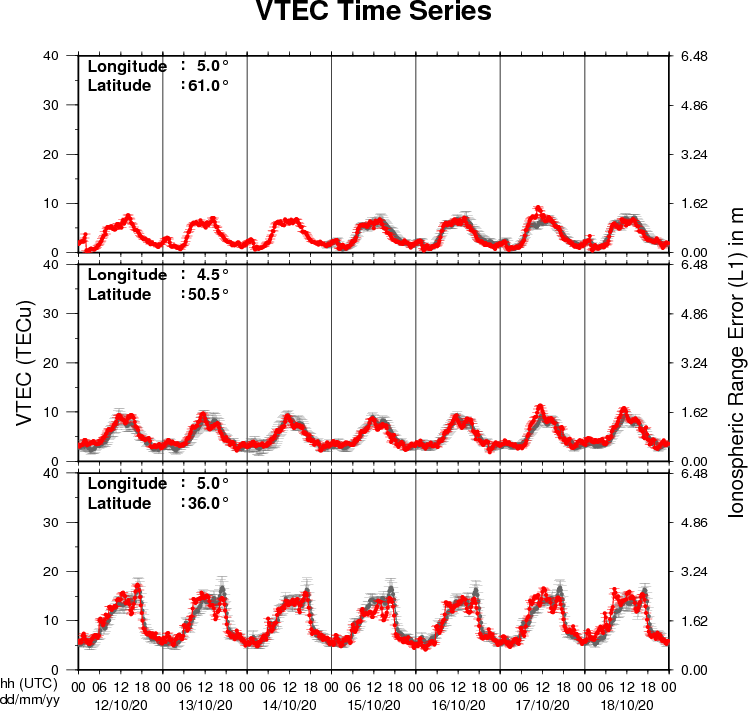
The figure shows the time evolution of the Vertical Total Electron Content (VTEC) (in red) during the last week at three locations:
a) in the northern part of Europe(N61°, 5°E)
b) above Brussels(N50.5°, 4.5°E)
c) in the southern part of Europe(N36°, 5°E)
This figure also shows (in grey) the normal ionospheric behaviour expected based on the median VTEC from the 15 previous days.
The VTEC is expressed in TECu (with TECu=10^16 electrons per square meter) and is directly related to the signal propagation delay due to the ionosphere (in figure: delay on GPS L1 frequency).
The Sun's radiation ionizes the Earth's upper atmosphere, the ionosphere, located from about 60km to 1000km above the Earth's surface.The ionization process in the ionosphere produces ions and free electrons. These electrons perturb the propagation of the GNSS (Global Navigation Satellite System) signals by inducing a so-called ionospheric delay.
See http://stce.be/newsletter/GNSS_final.pdf for some more explanations ; for detailed information, see http://gnss.be/ionosphere_tutorial.php