- Table of Content
- 1.Prominence eru...
- 2.Review of sola...
- 3.The Internatio...
- 4.PROBA2 Observa...
- 5.Review of geom...
- 6.Geomagnetic Ob...
- 7.The SIDC Space...
- 8.Review of iono...
2. Review of solar activity
3. The International Sunspot Number by Silso
4. PROBA2 Observations (19 Oct 2020 - 25 Oct 2020)
5. Review of geomagnetic activity
6. Geomagnetic Observations at Dourbes (19 Oct 2020 - 25 Oct 2020)
7. The SIDC Space Weather Briefing
8. Review of ionospheric activity (19 Oct 2020 - 25 Oct 2020)
Prominence eruption
A relatively large prominence erupted near the northeast solar limb during the afternoon hours of 23 October. Solar prominences are clouds of charged particles ("plasma") above the solar surface squeezed between magnetic regions of opposite polarity. Being cooler and denser than the plasma underneath and their surroundings, they appear as bright blobs when seen near the solar limb and as dark lines when seen on the solar disk (then they are called "filaments"). Special filters are required to observe these features, such as in the Hydrogen-alpha (H-alpha) line in the red part of the solar spectrum, or in some extreme ultraviolet (EUV) passbands.
The imagery underneath (resp. pre- and post-eruption image) shows the eruption as seen in EUV by SDO (https://sdo.gsfc.nasa.gov/data/aiahmi/ ). In AIA 304 (left), we observe solar plasma at a temperature of about 80,000 degrees. The plasma in the higher chromosphere and lower transition region emits at this wavelength. This temperature is much cooler than most of the other extreme ultraviolet (EUV) filters of SDO, such as AIA 193 (right, about 1.3 million degrees) with which the hot outer atmosphere of the Sun -the corona- is observed. Hence, these "cool" prominences seen in AIA 304 are usually bright against a relatively dark background, whereas in AIA 193 the denser parts of the prominence are mostly observed as dark features against the brighter coronal background. Movie clips are at http://www.stce.be/news/500/welcome.html
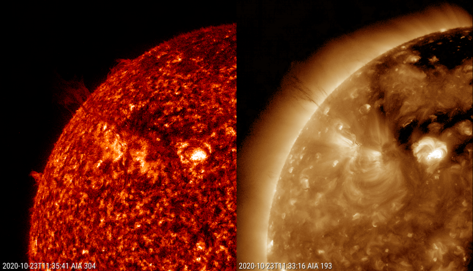
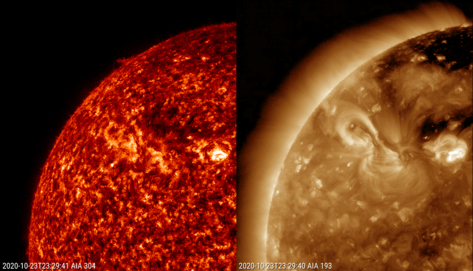
Both filters have their purposes. Whereas the AIA 304 filter shows better the prominence eruption and the movement of the material over the solar disk, the AIA 193 filter better indicates the post-eruption coronal loops and any coronal dimmings that may indicate the eruption was associated with a coronal mass ejection (CME). In this case, due to the line-of-sight, these darkenings (also called "transient coronal holes") were not very well visible from Earth. However, STEREO-A, currently having a much better view on the east solar limb and its surroundings (see https://stereo-ssc.nascom.nasa.gov/where.shtml for its location) , could clearly observe the coronal dimming (pre- and post-eruption images underneath). Based on an analysis of Stereo-A and SOHO (https://sohowww.nascom.nasa.gov/ ) coronagraphic imagery, the associated CME is thought not to be earth-directed.


By putting the imagery obtained thru both filters one on top of each other, some other details may become apparent (courtesy JHelioviewer - https://www.jhelioviewer.org/ ). In this case for example, it becomes more evident that the eruption originates at the solar limb, and that material is not only slingshotted into space (to the east - "lower left"), but part of it also flows back to a point on the visible solar disk (indicated by the blue arrow in the bottom image underneath). This may indicate that the prominence was the visible, trailing part of a nearly invisible filament channel that was located on the solar disk visible from Earth. The location of the coronal loops seems to back this up.

Review of solar activity
Solar activity was at very low levels.
The Sun had 2 southern (AR12776 and AR12777) and 1 northern active region (Catania group 46) that crossed the disk facing Earth. A number of A and B class flares were registered. A B1.3 flare from AR12776 was associated with an EUV wave.
There was one plage in the NE quadrant, which did not evolve to a region before it faded to the background. The plage was at the origin of a filament eruption.
The 10.7cm solar radio flux ranged mostly between 72 and 76 sfu.
A positive polarity equatorial coronal hole crossed central meridian on Oct 22 while two extensions of the northern coronal hole crossed central meridian on Oct 18th and 19th.
No Earth directed Coronal Mass Ejections (CME's) have been observed in coronagraph data.
The greater than 10 MeV proton flux was at background values.
The greater than 2 MeV electron flux was at nominal values at the start of the week, increasing to moderate on Oct 23rd and rising to high levels from Oct 25th onwards, crossing 10^3 pfu event threshold.
The International Sunspot Number by Silso

The daily Estimated International Sunspot Number (EISN, red curve with shaded error) derived by a simplified method from real-time data from the worldwide SILSO network. It extends the official Sunspot Number from the full processing of the preceding month (green line). The plot shows the last 30 days (about one solar rotation). The horizontal blue line shows the current monthly average. The yellow dots gives the number of stations that provided valid data. Valid data are used to calculate the EISN. The triangle gives the number of stations providing data. When a triangle and a yellow dot coincide, it means that all the data is used to calculate the EISN of that day.
PROBA2 Observations (19 Oct 2020 - 25 Oct 2020)
Solar Activity
Solar flare activity was very low during the week.
In order to view the activity of this week in more detail, we suggest to go to the following website from which all the daily (normal and difference) movies can be accessed: https://proba2.oma.be/ssa
This page also lists the recorded flaring events.
A weekly overview movie can be found here (SWAP week 552): https://proba2.sidc.be/swap/data/mpg/movies/weekly_movies/weekly_movie_2020_10_19.mp4
Details about some of this week's events can be found further below.
If any of the linked movies are unavailable they can be found in the P2SC movie repository here: https://proba2.oma.be/swap/data/mpg/movies/
Friday Oct 23
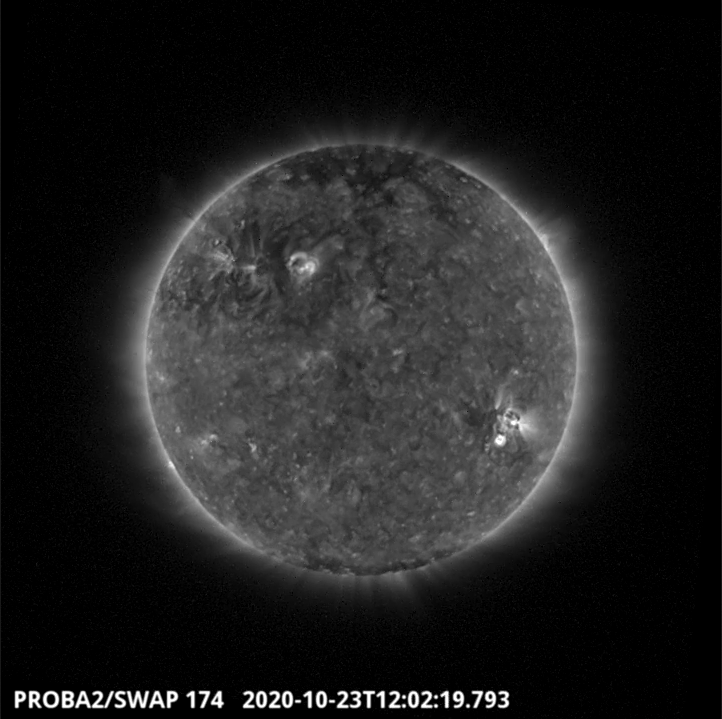
A prominence eruption was observed by SWAP over the north-east limb of the Sun on 2020-Oct-23, as shown in the SWAP image above taken at 12:02 UT.
Find a movie of the event here (SWAP movie): https://proba2.sidc.be/swap/movies/20201023_swap_movie.mp4
Review of geomagnetic activity
The solar wind was mostly at the slow regime at the beginning of the week, when only a small shock was registered Oct 19th at about 12:00UT. Later in the week, the high speed stream associated to the extension of the northern coronal hole increased the solar wind parameters, with its speed reaching values of 595 km/s (DSCOVR). Solar wind speed ranged between 300 and 595 km/s, with Bz varying between -11 and +13 nT. The direction of the interplanetary magnetic field varied.
Geomagnetic activity was at quiet to unsettled levels for the majority of the week, with a series of active time-periods from Oct 24th onwards.
Geomagnetic Observations at Dourbes (19 Oct 2020 - 25 Oct 2020)

The SIDC Space Weather Briefing
The Space Weather Briefing presented by the forecaster on duty from October 18 to 25. It reflects in images and graphs what is written in the Solar and Geomagnetic Activity report.
A pdf-version: http://www.stce.be/briefings/20201026_SWbriefing.pdf
The movie: http://www.stce.be/briefings/20201026_SWbriefing.m4v
Review of ionospheric activity (19 Oct 2020 - 25 Oct 2020)

The figure shows the time evolution of the Vertical Total Electron Content (VTEC) (in red) during the last week at three locations:
a) in the northern part of Europe(N61°, 5°E)
b) above Brussels(N50.5°, 4.5°E)
c) in the southern part of Europe(N36°, 5°E)
This figure also shows (in grey) the normal ionospheric behaviour expected based on the median VTEC from the 15 previous days.
The VTEC is expressed in TECu (with TECu=10^16 electrons per square meter) and is directly related to the signal propagation delay due to the ionosphere (in figure: delay on GPS L1 frequency).
The Sun's radiation ionizes the Earth's upper atmosphere, the ionosphere, located from about 60km to 1000km above the Earth's surface.The ionization process in the ionosphere produces ions and free electrons. These electrons perturb the propagation of the GNSS (Global Navigation Satellite System) signals by inducing a so-called ionospheric delay.
See http://stce.be/newsletter/GNSS_final.pdf for some more explanations ; for detailed information, see http://gnss.be/ionosphere_tutorial.php