- Table of Content
- 1.In the company...
- 2.EUHFORIA shop ...
- 3.Review of sola...
- 4.The Internatio...
- 5.PROBA2 Observa...
- 6.Geomagnetic Ob...
- 7.The SIDC Space...
- 8.Review of iono...
2. EUHFORIA shop is open
3. Review of solar and geomagnetic activity
4. The International Sunspot Number by Silso
5. PROBA2 Observations (26 Oct 2020 - 1 Nov 2020)
6. Geomagnetic Observations at Dourbes (26 Oct 2020 - 1 Nov 2020)
7. The SIDC Space Weather Briefing
8. Review of ionospheric activity (26 Oct 2020 - 1 Nov 2020)
In the company of sunspots
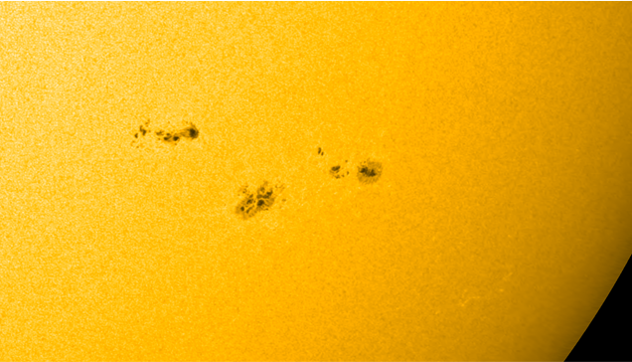
Sunspot region NOAA 2778 developed quickly on 25 October into a relatively large group. As it further matured, it got the company of a small and short-lived sunspot region to its southwest (lower right) on 26 and 27 October. This region remained unnumbered. Then, shortly after noon on 28 October, a larger region emerged to the northeast (upper left) of NOAA 2778. NOAA 2779 showed some complex sunspot structures, but remained smaller than its big brother. The image underneath (SDO / HMI , https://sdo.gsfc.nasa.gov/data/aiahmi/ ) shows the two regions in white light late on 28 October.
The subtle changes in the sunspot and group development can also be followed by hovering over the regions. This can be done using the tracking feature of the JHelioviewer tool (https://www.jhelioviewer.org/ ). They eye does not have to compensate for the rotation of the Sun, and so can focus better on the actual changes in the sunspot groups. Movie clips can be found at http://www.stce.be/news/501/welcome.html
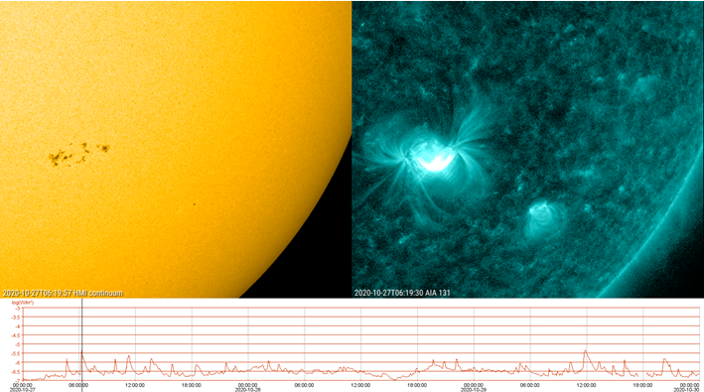
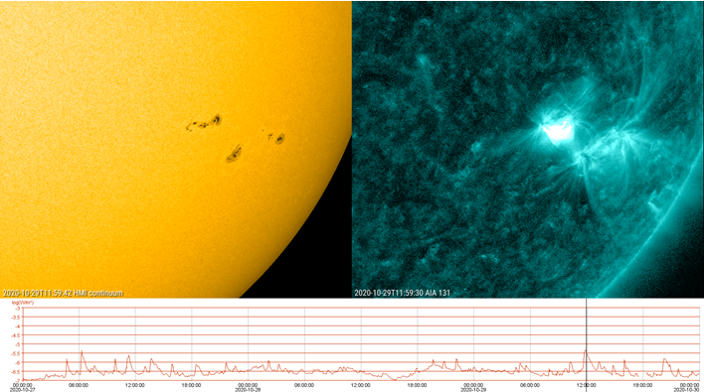
Both groups showed some mixing of magnetic polarities resulting in a number of small solar flares. NOAA 2778 produced 5 C-class flares on 27 and early on 28 October, the strongest being a C4.3. Then, late on 28 and on 29 October, the still growing active region NOAA 2779 took over and produced 7 C-class flares, the strongest being a C4.3 peaking near noon on 29 October. The imagery underneath shows the regions in white light (left) and in extreme ultraviolet (EUV, SDO/AIA 131), with the graph showing the x-ray flux. "-6" means to 10-6 Watts per square meter, corresponding to the C1 flaring level. The images show the two strongest flares (C4.3) respectively on 27 and 29 October.
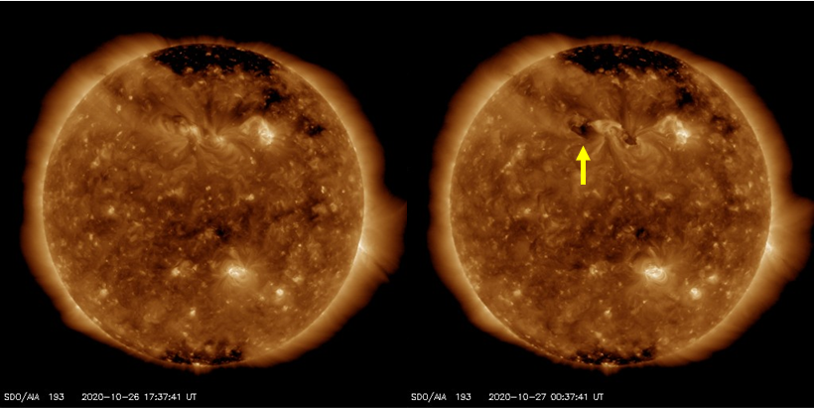
No obvious coronal mass ejections (CMEs) were associated with these flaring events. A CME with an earth-directed component was observed on 26-27 October and originated from the same source responsible for the 23 October CME as described in this STCE Newsitem (http://www.stce.be/news/500/welcome.html ). The annotated EUV image shows the location of the coronal dimming, a tell-tale sign that material got ejected by the eruption. Apparently, the first eruption did not destroy (entirely) the magnetic topology of the filament channel, allowing for a "Oops!...I Did It Again" moment 3 days later. The weak interplanetary CME arrived at the earth environment near noon on 1 November, and created only unsettled to active geomagnetic conditions.
EUHFORIA shop is open
EUHFORIA is a next-generation space weather prediction tool that aids to mitigate the effects of space weather on technological assets and can assists in science operations of space missions.
This sounds like a scientific heaven. The good news it that the doors of heaven are open giving entrance to the EUHFORIA e-shop: magazines, videos, library, services, ....

Shop corona-proof and free of charge on https://euhforia.com (top menu, click on 'shop')
The list of products will expand.
Review of solar and geomagnetic activity
SOLAR ACTIVITY
NOAA AR 2776 was the only numbered AR at the beginning of the week, as a consequence, solar activity was very low at that moment. On 27 October, NOAA AR 2776 rotated over the west limb and a new AR was numbered in the southern hemisphere as NOAA 2778.
On 29 October a second AR emerged to the north-east of 2778, and was numbered 2779. This AR complex produced 18 C-class flares during the week, until it rotated over the west limb.
A filament erupted on 26 October on the northern hemisphere, close to central meridian. The associated CME was first seen by LASCO only on 27 October. It had a low speed of 300 km/s.
The energetic proton flux remained at low levels the whole week.
The electron flux was elevated above the 10^3 pfu threshold from 25 October until 31 October, due to the influence of a HSS.
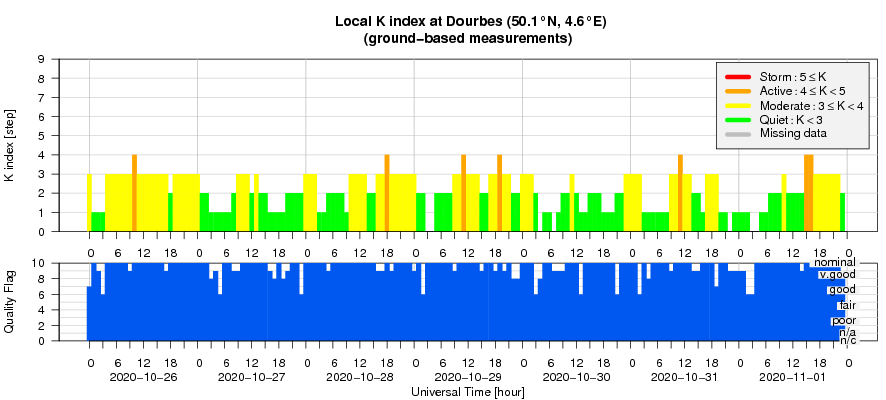
GEOMAGNETIC ACTIVITY
The week started with the Earth under the influence of a high speed stream (HSS) from an equatorial positive polarity coronal hole. Later on, the corresponding HSS from the low latitudinal extension of the northern polar coronal hole arrived to the Earth, also with positive polarity (and with speeds reaching 630 km/s). The HSS created numerous periods with K and Kp reaching 4. The solar wind speed went below 500 km/s on 29 October. A weak ICME (from the CME described above) was observed arriving at 11:00 UT on 1 November, it caused KDourbes = 4.
The International Sunspot Number by Silso
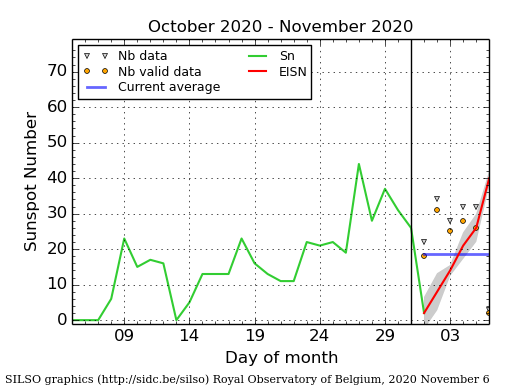
The daily Estimated International Sunspot Number (EISN, red curve with shaded error) derived by a simplified method from real-time data from the worldwide SILSO network. It extends the official Sunspot Number from the full processing of the preceding month (green line). The plot shows the last 30 days (about one solar rotation). The horizontal blue line shows the current monthly average. The yellow dots gives the number of stations that provided valid data. Valid data are used to calculate the EISN. The triangle gives the number of stations providing data. When a triangle and a yellow dot coincide, it means that all the data is used to calculate the EISN of that day.
PROBA2 Observations (26 Oct 2020 - 1 Nov 2020)
Solar Activity
Solar flare activity fluctuated between very low and low during the week.
In order to view the activity of this week in more detail, we suggest to go to the following website from which all the daily (normal and difference) movies can be accessed: https://proba2.oma.be/ssa
This page also lists the recorded flaring events.
A weekly overview movie can be found here (SWAP week 553): https://proba2.sidc.be/swap/data/mpg/movies/weekly_movies/weekly_movie_2020_10_26.mp4
Details about some of this week's events can be found further below.
If any of the linked movies are unavailable they can be found in the P2SC movie repository here: https://proba2.oma.be/swap/data/mpg/movies/
Thursday Oct 29
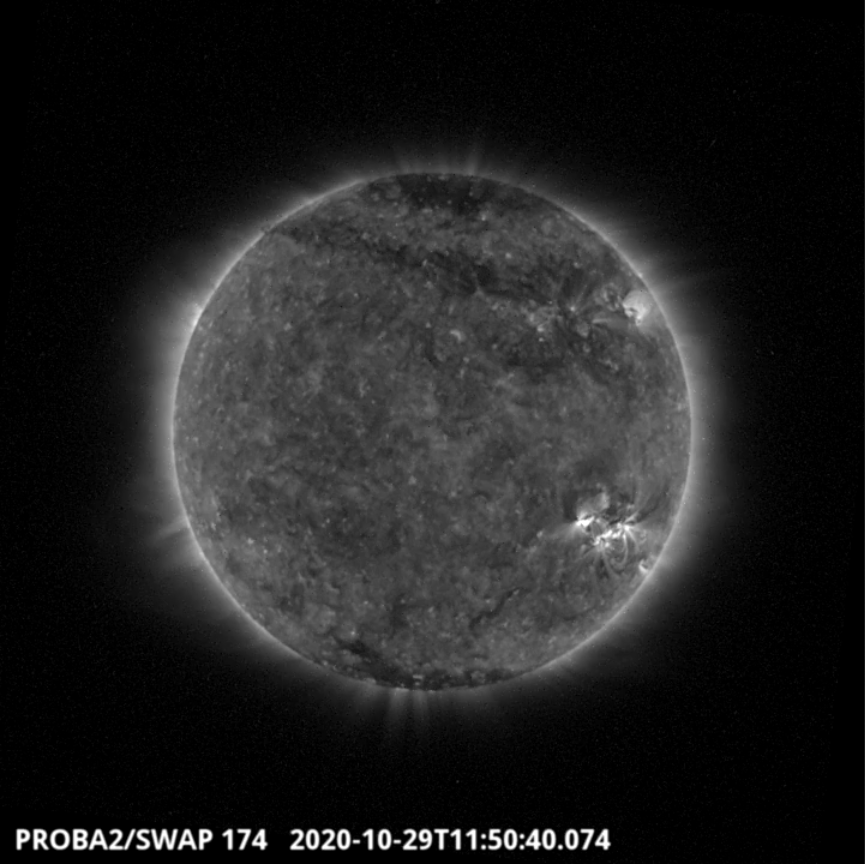
The largest flare of the week (C4.3), which was associated with NOAA AR2779, was observed by SWAP and LYRA on 2020-Oct-29. The flare is visible in the south-west quadrant of the solar disk in the SWAP image above taken at 11:50 UT.
Find a movie of the event here (SWAP movie): https://proba2.sidc.be/swap/movies/20201029_swap_movie.mp4
Sunday Nov 01
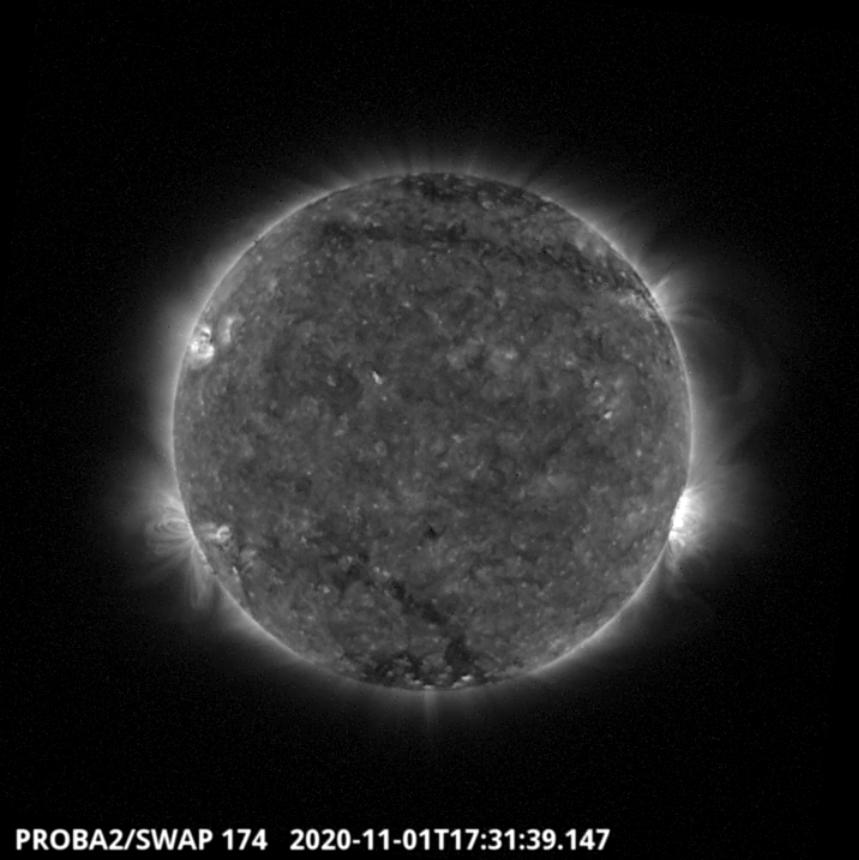
An eruption associated with a C3.4 flare was observed by SWAP on the western limb of the Sun on 2020-Nov-01, as shown in the SWAP image above taken at 17:31 UT.
Find a movie of the event here (SWAP movie): https://proba2.sidc.be/swap/movies/20201101_swap_movie.mp4 and here (SWAP difference movie): https://proba2.sidc.be/swap/movies/20201101_swap_diff.mp4
Geomagnetic Observations at Dourbes (26 Oct 2020 - 1 Nov 2020)
The SIDC Space Weather Briefing
The Space Weather Briefing presented by the forecaster on duty from October 25 to November 1. It reflects in images and graphs what is written in the Solar and Geomagnetic Activity report.

A pdf-version: http://www.stce.be/briefings/20201102_SWbriefing.pdf
The movie: http://www.stce.be/briefings/20201102_SWbriefing.m4v
Review of ionospheric activity (26 Oct 2020 - 1 Nov 2020)
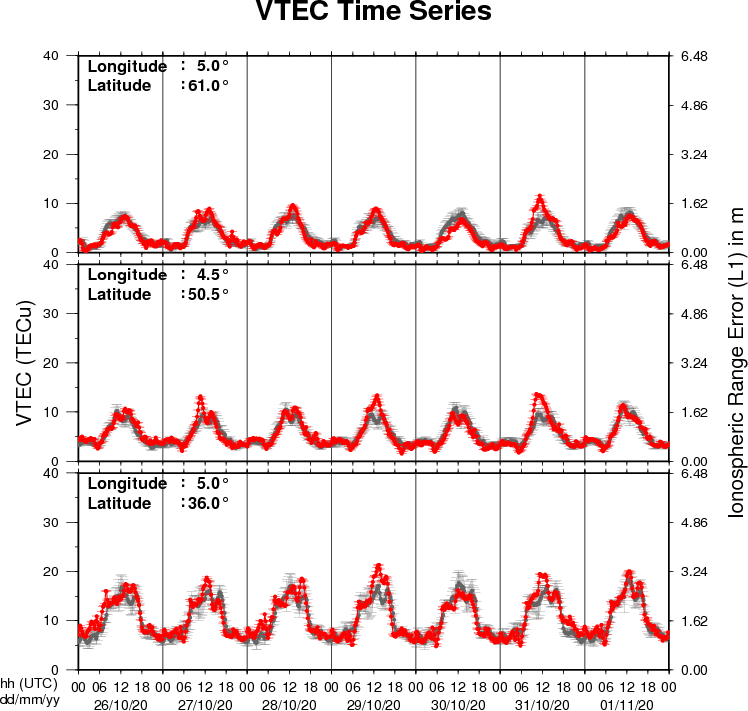
The figure shows the time evolution of the Vertical Total Electron Content (VTEC) (in red) during the last week at three locations:
a) in the northern part of Europe(N61°, 5°E)
b) above Brussels(N50.5°, 4.5°E)
c) in the southern part of Europe(N36°, 5°E)
This figure also shows (in grey) the normal ionospheric behaviour expected based on the median VTEC from the 15 previous days.
The VTEC is expressed in TECu (with TECu=10^16 electrons per square meter) and is directly related to the signal propagation delay due to the ionosphere (in figure: delay on GPS L1 frequency).
The Sun's radiation ionizes the Earth's upper atmosphere, the ionosphere, located from about 60km to 1000km above the Earth's surface.The ionization process in the ionosphere produces ions and free electrons. These electrons perturb the propagation of the GNSS (Global Navigation Satellite System) signals by inducing a so-called ionospheric delay.
See http://stce.be/newsletter/GNSS_final.pdf for some more explanations ; for detailed information, see http://gnss.be/ionosphere_tutorial.php