- Table of Content
- 1.SC25 ramping u...
- 2.Review of sola...
- 3.PROBA2 Observa...
- 4.The Internatio...
- 5.Review of geom...
- 6.Geomagnetic Ob...
- 7.The SIDC Space...
- 8.Review of iono...
2. Review of solar activity
3. PROBA2 Observations (9 Nov 2020 - 15 Nov 2020)
4. The International Sunspot Number by Silso
5. Review of geomagnetic activity
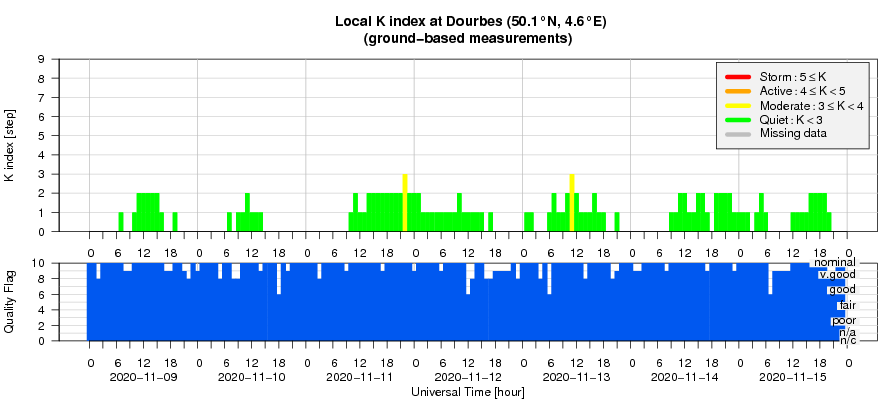
6. Geomagnetic Observations at Dourbes (9 Nov 2020 - 15 Nov 2020)
7. The SIDC Space Weather Briefing
8. Review of ionospheric activity (9 Nov 2020 - 15 Nov 2020)
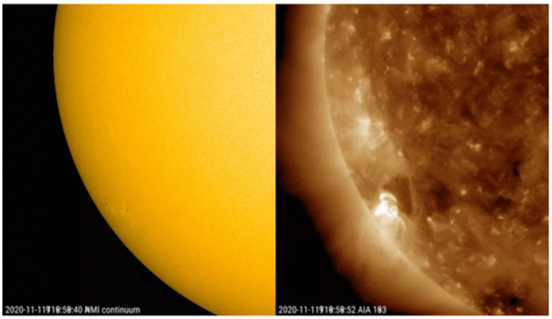
SC25 ramping up!
On 10 November, a new and fairly simple sunspot region started to rotate into view at the southeast limb. Then, late on 11 November, this NOAA 2782 produced a long duration C2.6 flare. A long duration event (LDEs) is generally defined as a flare lasting more than 1 hour, though there exist other definitions. LDEs are ususally associated with coronal mass ejections. Moreover, in this case, SDO's extreme ultraviolet (EUV ; https://sdo.gsfc.nasa.gov/data/aiahmi/ ) imagery underneath (right) indicated the presence of post-flare coronal loops as well as some coronal dimming ("darkening"). See the clip at http://www.stce.be/news/503/welcome.html Both are indicators that the flaring event might be associated with a CME. Sure enough, a CME was observed emanating from the southeast limb, but it had no earth-directed component.
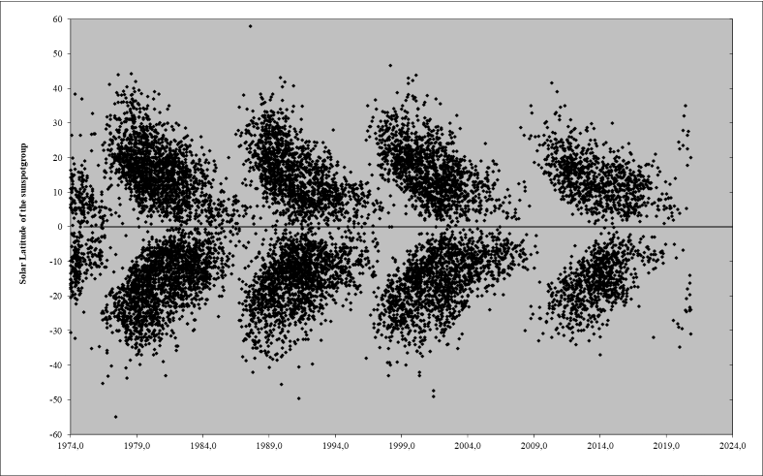
This was already the third sunspot region observed this month, following the month October when no less than 6 new regions were observed. They all belonged to the new solar cycle 25 (SC25), indicating that SC25 is quickly gaining in strength. These sunspot regions are more or less evenly spread over both solar hemispheres, though the largest sunspot regions have emerged in the southern solar hemisphere. The distribution of the sunspot groups can be seen in the so-called butterfly diagram underneath, displaying for each month since 1974 the latitude of every individual sunspot group (NOAA number) that has appeared. It clearly shows that during the period of solar cycle minimum, the sunspot groups appear ever closer to the solar equator, gradually becoming smaller and disappearing while the sunspots of the new solar cycle manifest themselves again at high latitudes. As the pattern resembles the wings of a butterfly, it is called a butterfly diagram. The sunspot groups from the new solar cycle SC25 that have appeared so far clearly reveal the outer tips of the new butterfly's wings.
Review of solar activity
Solar activity was at very low to low levels.
NOAA 2781 decayed further and rotated as a single sunspot over the southwest solar limb on 15 November. It produced a C1 flare on 10 November. New region NOAA 2782 started rotating over the southeast limb the very same day. This sunspot group had a simple magnetic configuration but was able to produce a total of 3 C-class flares on 11 and 12 November, the strongest being a C2.6 flare on 11 November. This was a Long Duration Event and associated with a non earth-directed coronal mass ejection (CME). NOAA 2782 had decayed into a spotless plage by 14 November.
The daily 10.7cm solar radio flux was on a generally declining trend, from an initial value of 90.0 sfu to 78.7 sfu by the end of the period.
No earth-directed coronal mass ejections (CMEs) were observed.
Aside the obvious polar coronal holes (CH), only a small positive magnetic polarity CH in the northeast quadrant was visible at the end of the period.
The greater than 10 MeV proton flux was at nominal values.
The greater than 2 MeV electron flux was mostly below the 1000 pfu alert threshold, except on 11 November when it reached 2250 pfu. The greater than 2 MeV electron fluence was at nominal levels for the entire week.
PROBA2 Observations (9 Nov 2020 - 15 Nov 2020)
Solar Activity
Solar flare activity fluctuated between very low and low during the week.
In order to view the activity of this week in more detail, we suggest to go to the following website from which all the daily (normal and difference) movies can be accessed: https://proba2.oma.be/ssa
This page also lists the recorded flaring events.
A weekly overview movie can be found here (SWAP week 555): https://proba2.sidc.be/swap/data/mpg/movies/weekly_movies/weekly_movie_2020_11_09.mp4
Details about some of this week's events can be found further below.
If any of the linked movies are unavailable they can be found in the P2SC movie repository here: https://proba2.oma.be/swap/data/mpg/movies/
Wednesday Nov 11
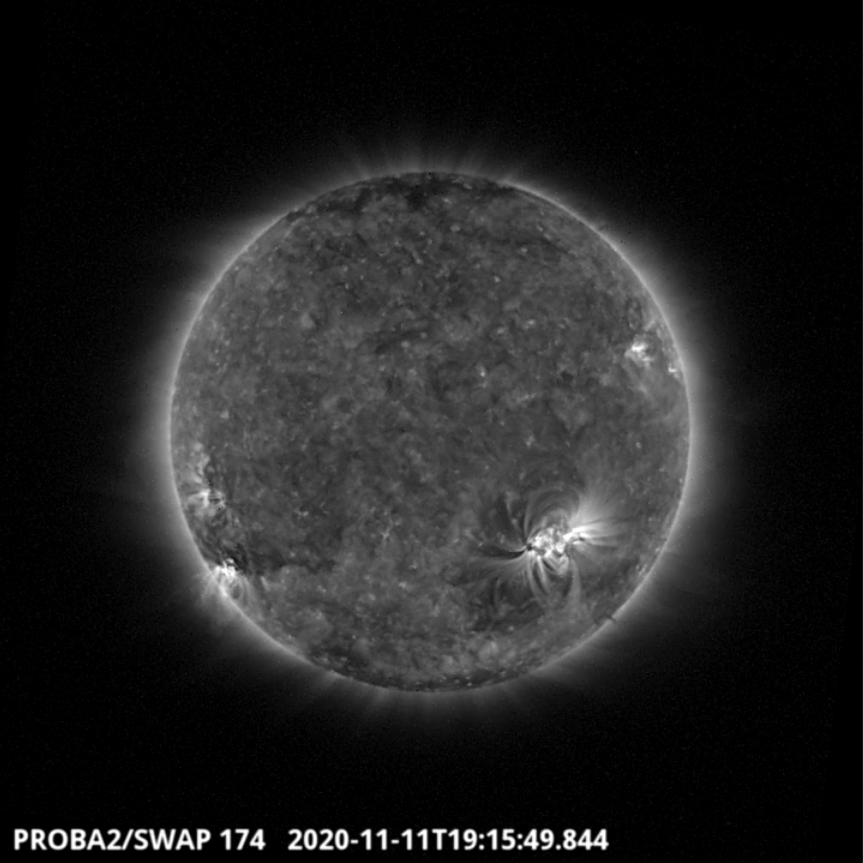
An eruption associated with a C2.6 flare was observed by SWAP near the south-eastern limb of the Sun on 2020-Nov-11, as shown in the SWAP image above taken at 19:15 UT.
Find a movie of the event here https://proba2.sidc.be/swap/movies/20201111_swap_movie.mp4 (SWAP movie) and here https://proba2.sidc.be/swap/movies/20201111_swap_diff.mp4 (SWAP difference movie).
The International Sunspot Number by Silso
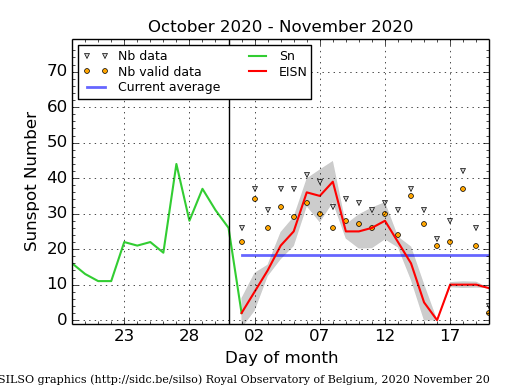
The daily Estimated International Sunspot Number (EISN, red curve with shaded error) derived by a simplified method from real-time data from the worldwide SILSO network. It extends the official Sunspot Number from the full processing of the preceding month (green line). The plot shows the last 30 days (about one solar rotation). The horizontal blue line shows the current monthly average. The yellow dots gives the number of stations that provided valid data. Valid data are used to calculate the EISN. The triangle gives the number of stations providing data. When a triangle and a yellow dot coincide, it means that all the data is used to calculate the EISN of that day.
Review of geomagnetic activity
Solar wind parameters were at nominal levels. Solar wind speed declined from 480 to 290 km/s, with a slight enhancement on 11-13 November when it reached 440 km/s. Bz varied between -6 and +7 nT. The direction of the interplanetary magnetic field was in a predominantly negative sector (towards the Sun).
Geomagnetic activity was at quiet levels, with an isolated unsettled interval recorded in K Dourbes on 11 and 13 November.
Geomagnetic Observations at Dourbes (9 Nov 2020 - 15 Nov 2020)
The SIDC Space Weather Briefing
The Space Weather Briefing presented by the forecaster on duty from November 8 to 15. It reflects in images and graphs what is written in the Solar and Geomagnetic Activity report.

A pdf-version: http://www.stce.be/briefings/20201116_SWbriefing.pdf
The movie: http://www.stce.be/briefings/20201116_SWbriefing.m4v
Review of ionospheric activity (9 Nov 2020 - 15 Nov 2020)
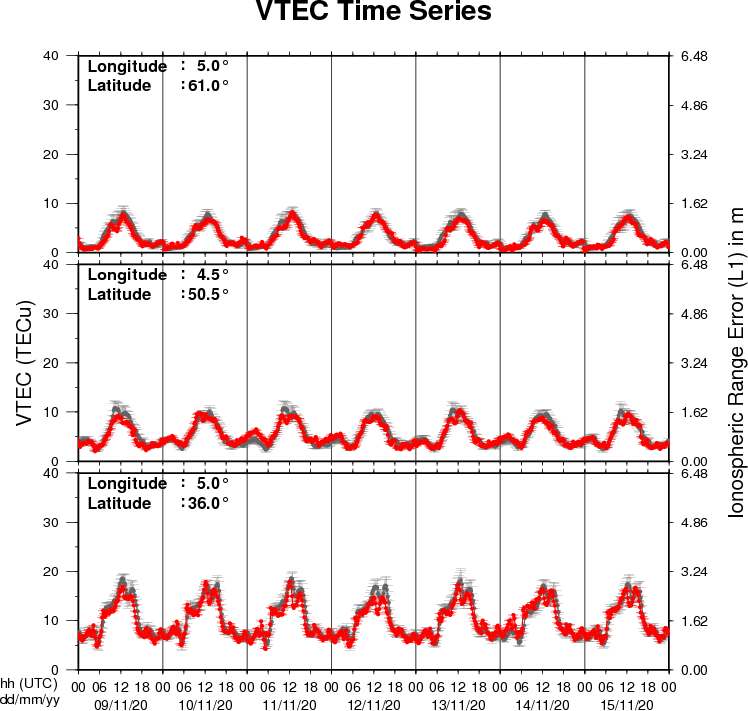
The figure shows the time evolution of the Vertical Total Electron Content (VTEC) (in red) during the last week at three locations:
a) in the northern part of Europe(N61°, 5°E)
b) above Brussels(N50.5°, 4.5°E)
c) in the southern part of Europe(N36°, 5°E)
This figure also shows (in grey) the normal ionospheric behaviour expected based on the median VTEC from the 15 previous days.
The VTEC is expressed in TECu (with TECu=10^16 electrons per square meter) and is directly related to the signal propagation delay due to the ionosphere (in figure: delay on GPS L1 frequency).
The Sun's radiation ionizes the Earth's upper atmosphere, the ionosphere, located from about 60km to 1000km above the Earth's surface.The ionization process in the ionosphere produces ions and free electrons. These electrons perturb the propagation of the GNSS (Global Navigation Satellite System) signals by inducing a so-called ionospheric delay.
See http://stce.be/newsletter/GNSS_final.pdf for some more explanations ; for detailed information, see http://gnss.be/ionosphere_tutorial.php