- Table of Content
- 1.Up!...
- 2.Seminar - EUHF...
- 3.Job vacancy at...
- 4.2020 was good ...
- 5.Review of sola...
- 6.Review of Geom...
- 7.Geomagnetic Ob...
- 8.The SIDC Space...
- 9.Review of iono...
- 10.Review of sola...
- 11.Review of geom...
- 12.PROBA2 Observa...
- 13.USET Observati...
- 14.Geomagnetic Ob...
- 15.The SIDC Space...
- 16.Review of iono...
2. Seminar - EUHFORIA
3. Job vacancy at KULeuven - BISA
4. 2020 was good for another Solar Radio Burst
5. Review of solar activity (21 Dec 2020 - 27 Dec 2020)
6. Review of Geomagnetic activity (21 Dec 2020 - 27 Dec 2020)
7. Geomagnetic Observations at Dourbes (21 Dec 2020 - 27 Dec 2020)
8. The SIDC Space Weather Briefing - Dec 20-27, 2020
9. Review of ionospheric activity (21 Dec 2020 - 27 Dec 2020)
10. Review of solar activity (28 Dec 2020 - 3 Jan 2021)
11. Review of geomagnetic activity (28 Dec 2020 - 3 Jan 2021)
12. PROBA2 Observations (28 Dec 2020 - 3 Jan 2021)
13. USET Observations (28 Dec 2020 - 3 Jan 2021)
14. Geomagnetic Observations at Dourbes (28 Dec 2020 - 3 Jan 2021)
15. The SIDC Space Weather Briefing - Dec 28, 2020 - Jan 03, 2021
16. Review of ionospheric activity (28 Dec 2020 - 3 Jan 2021)
Up!...
The last 3 months of 2020 saw a significant increase in sunspot activity, with the international sunspot number (ISN) reaching nearly 100 on 29 November (See the STCE Newsitem at http://www.stce.be/news/506/welcome.html ). As the new solar cycle 25 (SC25) is barely 1 year old, this raised the question how unusual this increase was.
The figure underneath compares the monthly (m) and smoothed monthly (sm) sunspot numbers of solar cycles 22 to 25 from 1 year before to 1 year after the month of the smoothed sunspot minimum (month "0"). The smoothing is done using the SILSO smoothing formula (see http://sidc.oma.be/silso/faq6 ). The evolution of the smoothed ISN clearly shows how deep the minimum was of the ongoing and previous solar cycle compared to SC22 and SC23. It is also obvious that, 1 year after the minimum, the increase of SC24 was significantly slower than that of SC22 and SC23. With still 6 months to go, the current smoothed sunspot numbers of SC25 seem to be slightly above those of the previous solar cycle, but the further evolution will depend on the solar activity in the coming months. Indeed, at this stage of the solar cycle, the monthly sunspot activity remains one with ups and downs - as can be gauged from the chart underneath.

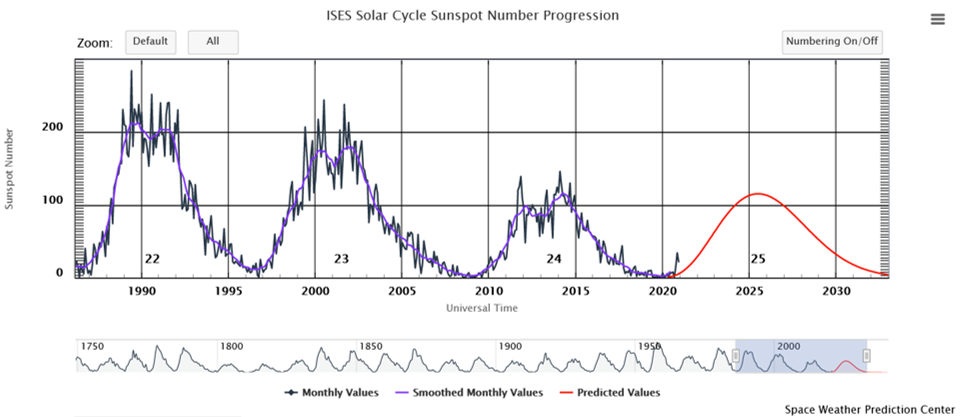
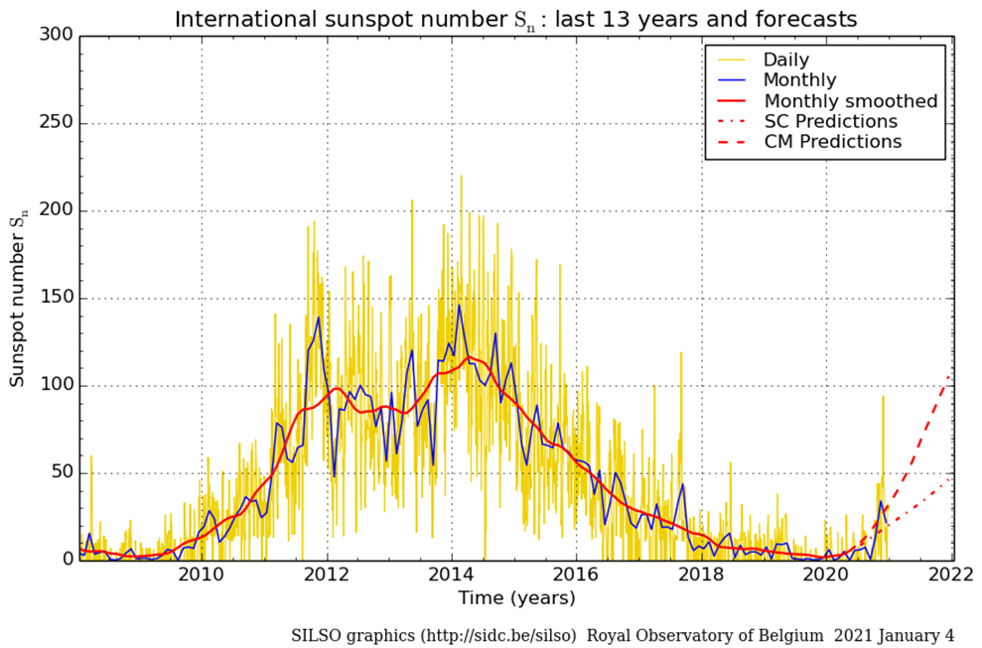
The international SC25 prediction panel expects a maximum smoothed monthly ISN for SC25 of 115 +/-10 (see this Newsitem at http://www.stce.be/news/467/welcome.html ). The evolution of SC25 can be followed on dedicated solar cycle webpages at NOAA/SWPC (https://www.swpc.noaa.gov/products/solar-cycle-progression ) and at SILSO (http://sidc.oma.be/silso/ssngraphics ) - see the charts underneath. By the summer of 2022, the factual observed sunspot numbers will give a better estimate of the SC25 maximum that can be expected.
Seminar - EUHFORIA
Chirstine Verbeke joined the STCE in 2020. She is the one to implement the EUHFORIA software in our operational Space Weather Centre. EUHFORIA will help us to make even better estimates of the arrival time of a solar plasma cloud.
On January 14, 14:30, she will reveal the secrets of EUHFORIA.
Abstract
EUHFORIA (European Heliospheric Forevasting Information Asset) is a recently developed space weather forecasting-targeted inner heliosphere model that consists of two major components: a coronal model and a heliosphere model including the option to model coronal mass ejections (CMEs). The coronal model provides data-driven solar wind plasma parameters at 0.1 AU. These are then used as boundary conditions to drive a three-dimensional time-dependent magnetohydrodynamics model of the inner heliosphere up to 2 AU. CMEs are injected into the ambient solar wind modeled using the cone model or a linear force-free spheromak model.
We provide an extensive introduction to the model and will explain the general workflow of modeling a CME event. We will discuss how to install and run the model on the SpacePole cluster, how to run the empirical model and the heliospheric model including the addition of CMEs, while discussing the input parameters of the model. Lastly, we present a short overview on some of the studies that have been performed recently with EUHFORIA.
Join the seminar
Job vacancy at KULeuven - BISA
A full-time tenure track academic vacancy as an independent academic staff (50 percent) - work leader (50 percent) is vacant within the framework of the BIRA-IASB FED-tWIN research programme between the Science, Engineering and Technology Group, Faculty of Science, Department of Mathematics, Division of Plasma-astrophysics and the Federal Scientific Institute BIRA-IASB.
The KU Leuven team has considerable expertise in space and solar physics, in using Machine Learning and in the development of simulations and models of space and solar plasmas to track the development of energetic particles.
BIRA-IASB is a Belgian Federal Scientific Institute conducting research and providing services in space aeronomy, i.e. the physics and chemistry of Earth's atmosphere and other planets, and outer space. BIRA-IASB has strong experience in space weather and in developing kinetic models of solar wind interactions with the terrestrial magnetosphere.
....
You can apply for this job no later than February 15, 2021.
Check the BIRA-website: https://www.aeronomie.be/index.php/en/vacancies/fed-twin-tenure-track-ku-leuven-bira-iasb-workleader-royal-belgian-institute-space
2020 was good for another Solar Radio Burst
Date and hour: 27 December 2020 11:35 - 11:40
Radio event: Group of type III bursts, with type U
context: B3.4 flare (11:37 UT, peak time) in NOAA AR 2795
quick look:
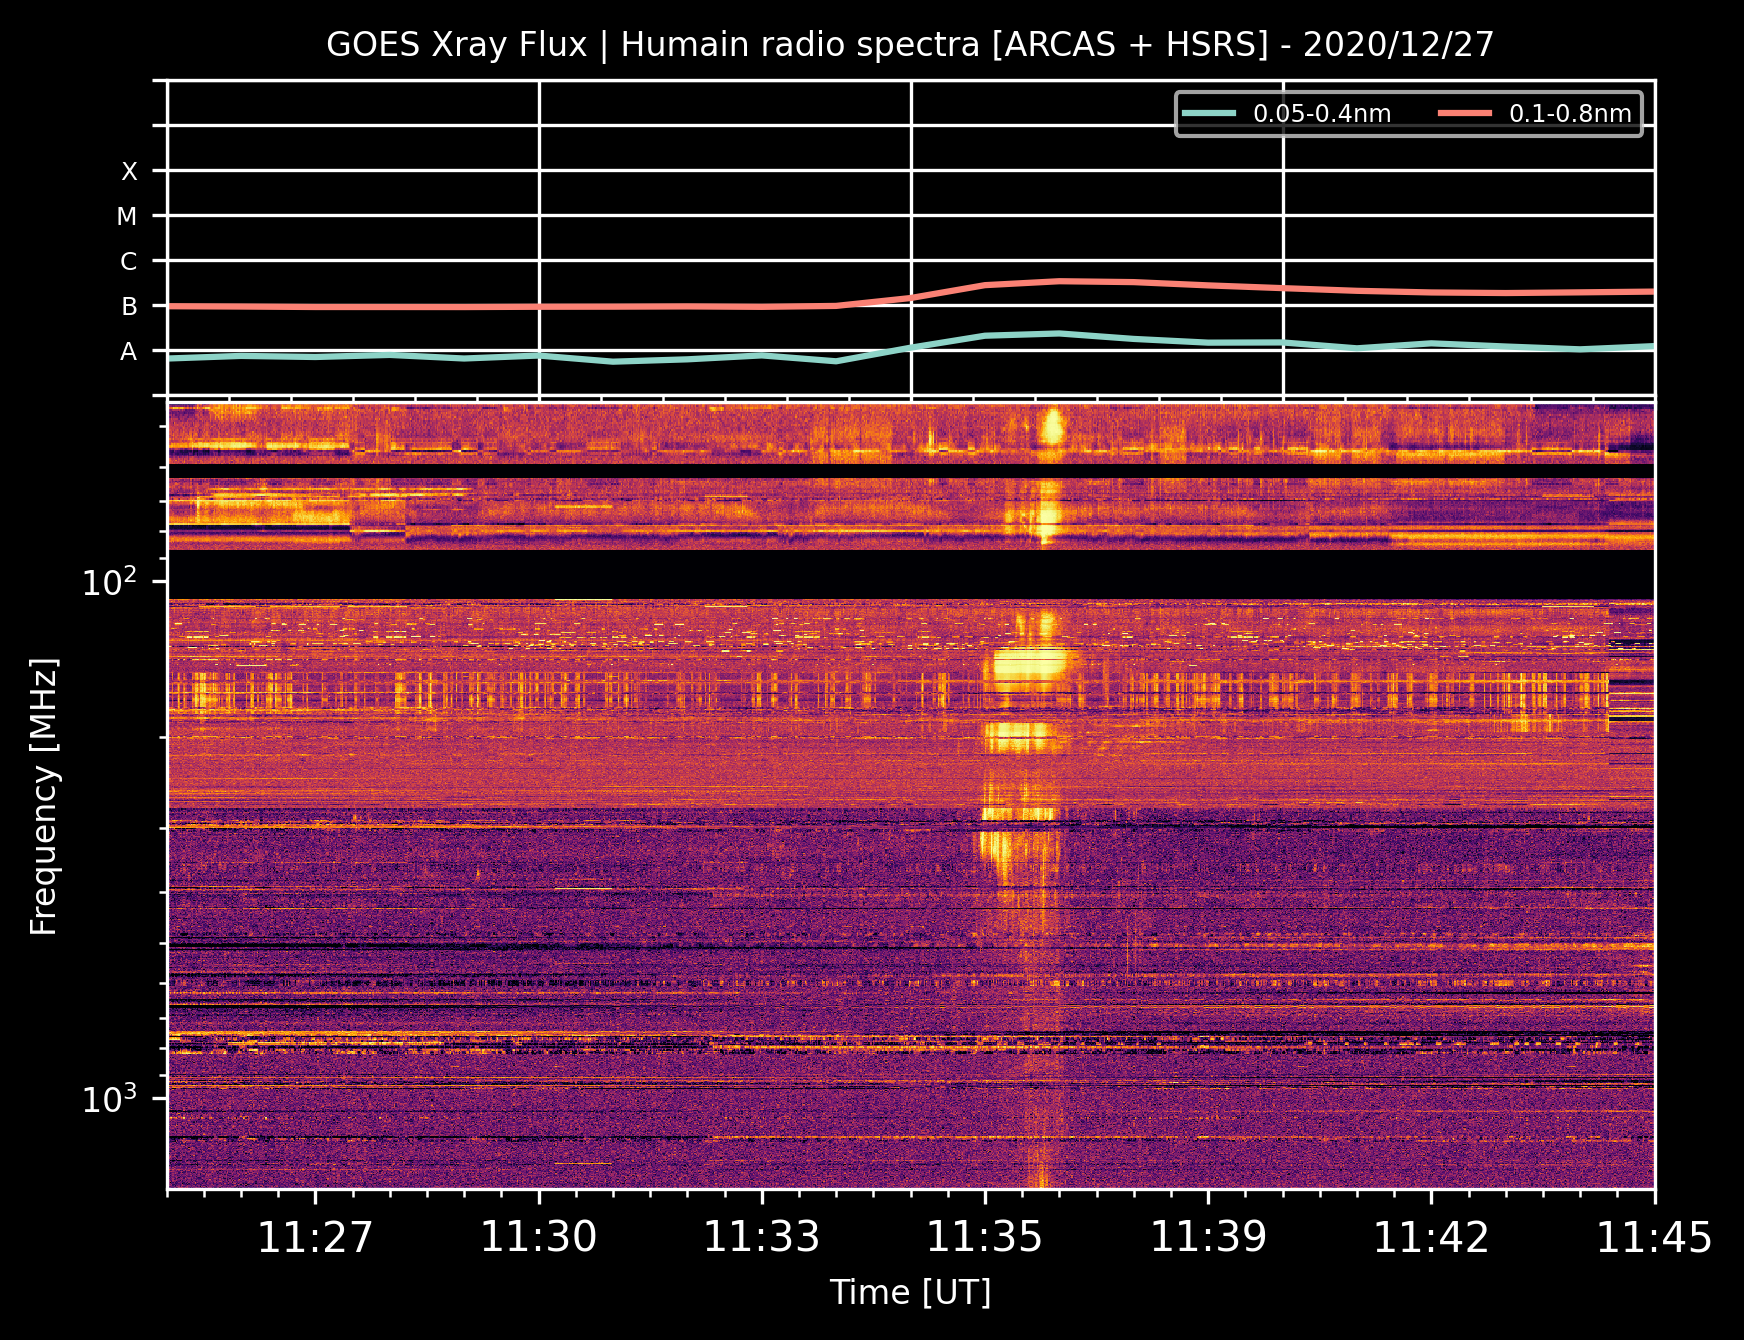
The complete list of SRB of solar cycle 25: http://sidc.be/humain/hsrs_events_cycle_25.php
Review of solar activity (21 Dec 2020 - 27 Dec 2020)
Solar activity was at very low levels.
The Sun had 4 southern active regions (AR 2792, 2793, 2794 and 2795) that crossed the disk. A number of A and B class flares were registered.
The 10.7cm solar radio flux ranged mostly between 79 and 88 sfu. A southern negative polarity coronal hole crossed central meridian on Dec 26.
No Earth directed Coronal Mass Ejections have been observed in coronagraph data.
The greater than 10 MeV proton flux was at background values.
The greater than 2 MeV electron flux was at nominal levels values at the start of the week, became elevated on Dec 23 and crossed the 1000 pfu event threshold on Dec 24, 25 and 27.
The greater than 2 MeV electron fluence was at nominal levels at the beginning of the week, becoming enhanced from Dec 24 onwards.
Review of Geomagnetic activity (21 Dec 2020 - 27 Dec 2020)
The solar wind was mostly at the slow regime at the beginning of the week. From Dec 22 until Dec 25 the high speed stream associated to the two extensions of the positive northern coronal hole increased the wind parameters, with the speed reaching values of 645 km/s (DSCOVR+ACE), before returning to nominal levels by the end of the week. Solar wind speed ranged between 345 and 645 km/s, with Bz varying between -12 and +16 nT. The direction of the interplanetary magnetic field was positive for the majority of the week, with some variations to the negative sector.
Geomagnetic activity was at quiet to unsettled levels for the majority of the week, with two active time-periods on Dec 22 and Dec 23.
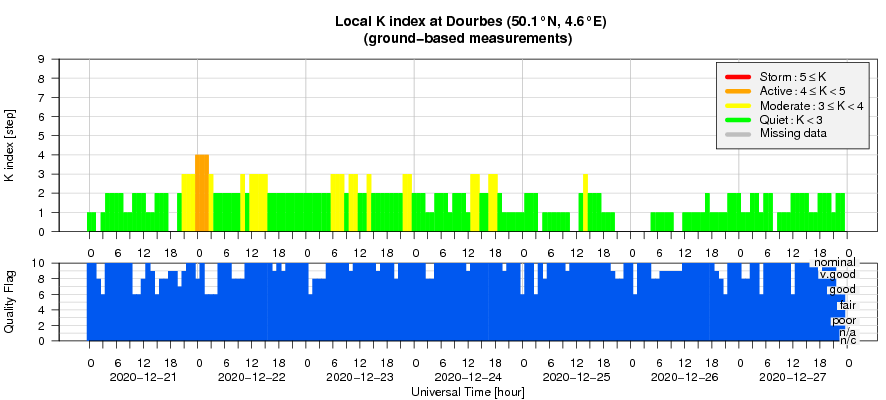
Geomagnetic Observations at Dourbes (21 Dec 2020 - 27 Dec 2020)
The SIDC Space Weather Briefing - Dec 20-27, 2020
The Space Weather Briefing presented by the forecaster on duty from Dec 20 to 27, 2020. It reflects in images and graphs what is written in the Solar and Geomagnetic Activity report.

Pdf-version: http://www.stce.be/briefings/20201228_SWbriefing.pdf
The movie: http://www.stce.be/briefings/20201228_SWbriefing.m4v
Review of ionospheric activity (21 Dec 2020 - 27 Dec 2020)
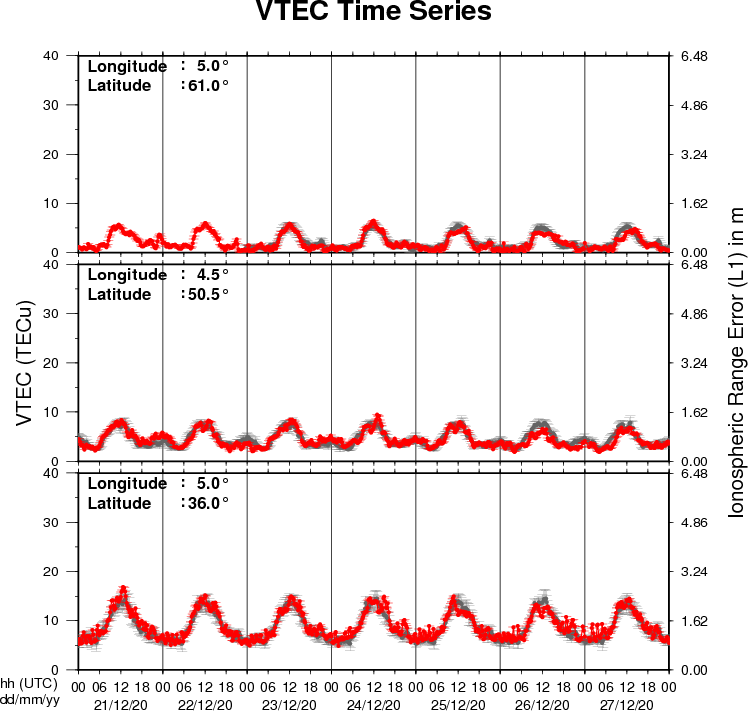
The figure shows the time evolution of the Vertical Total Electron Content (VTEC) (in red) during the last week at three locations:
a) in the northern part of Europe(N61°, 5°E)
b) above Brussels(N50.5°, 4.5°E)
c) in the southern part of Europe(N36°, 5°E)
This figure also shows (in grey) the normal ionospheric behaviour expected based on the median VTEC from the 15 previous days.
The VTEC is expressed in TECu (with TECu=10^16 electrons per square meter) and is directly related to the signal propagation delay due to the ionosphere (in figure: delay on GPS L1 frequency).
The Sun's radiation ionizes the Earth's upper atmosphere, the ionosphere, located from about 60km to 1000km above the Earth's surface.The ionization process in the ionosphere produces ions and free electrons. These electrons perturb the propagation of the GNSS (Global Navigation Satellite System) signals by inducing a so-called ionospheric delay.
See http://stce.be/newsletter/GNSS_final.pdf for some more explanations ; for detailed information, see http://gnss.be/ionosphere_tutorial.php
Review of solar activity (28 Dec 2020 - 3 Jan 2021)
Solar activity was at very low levels.
Two active regions (ARs) were visible: NOAA AR 2794 and AR 2795. The active regions did not produce any significant flares. NOAA AR2794 was most active at the start of the week, producing B6.6 flare on Dec 29. However, by the end of week, the region had decayed into a plage region. NOAA AR 2795 (alpha) remained stable and rotated over the limb on Jan 02.
The daily 10.7cm solar radio flux decreased over the week, from an initial value of 88 to 80 sfu by the end of the period.
Two CMEs were observed, originating from a series of filament eruptions from the south-west quadrant on Jan 01 and Jan 02. The second eruption was faster than the first and might interact with the first eruption when it catches up.
The greater than 10 MeV proton flux was at nominal values.
The greater than 2 MeV electron flux exceeded the 1000 pfu alert threshold on Dec 27. It continued to be enhanced for the rest of the week, but did not exceed the alert threshold again.
The greater than 2 MeV electron fluence was at nominal levels for the week.
Review of geomagnetic activity (28 Dec 2020 - 3 Jan 2021)
Solar wind parameters were at elevated levels for the first half of the week, with a measured speed of over 500 km/s, as the Earth continued to be under the influence of the high-speed stream associated with the negative polarity coronal hole (CH) that traversed the central meridian on December 26. In the second half of the week, the solar wind speed declined from to around 300 km/s. Bz varied between -7 and +7 nT over the week. The direction of the interplanetary magnetic field was predominantly directed towards the Sun (phi angle in the negative sector) until Jan 03 when it switched sectors.
Geomagnetic activity was at quiet to unsettled levels for the first half of the week. From Jan 01, the geomagnetic activity then returned to quiet conditions.
PROBA2 Observations (28 Dec 2020 - 3 Jan 2021)
Solar Activity
Solar flare activity was very low during the week.
In order to view the activity of this week in more detail, we suggest to go to the following website from which all the daily (normal and difference) movies can be accessed: https://proba2.oma.be/ssa
This page also lists the recorded flaring events.
A weekly overview movie can be found here (SWAP week 562): https://proba2.sidc.be/swap/data/mpg/movies/weekly_movies/weekly_movie_2020_12_28.mp4
Details about some of this week's events can be found further below.
If any of the linked movies are unavailable they can be found in the P2SC movie repository here: https://proba2.oma.be/swap/data/mpg/movies/
Tuesday Dec 29
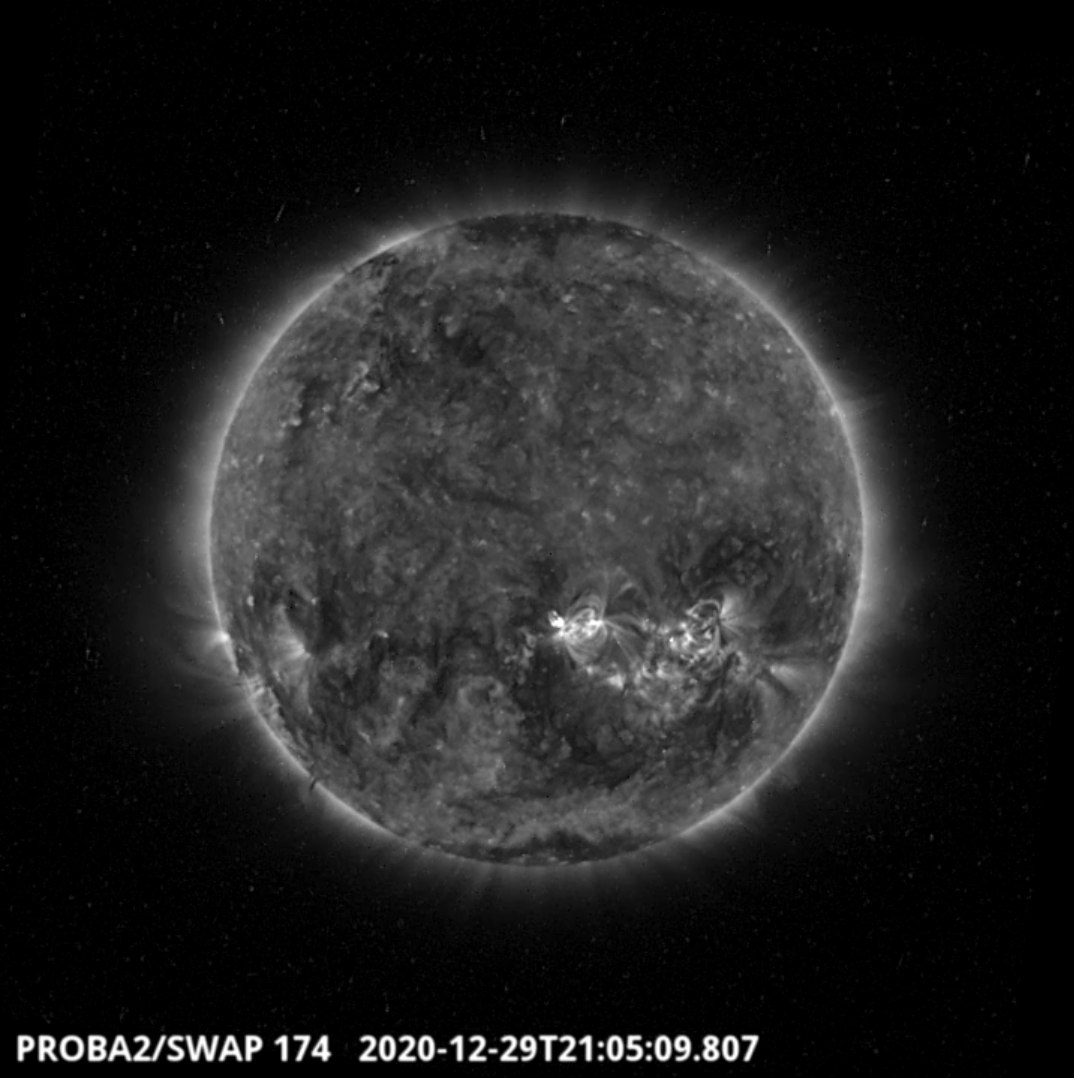
The largest flare of the week was a B6.6 flare, which was observed by SWAP and LYRA on 2020-Dec-29. The flare occurred near the central meridian in the southern hemisphere of the Sun, as shown in the SWAP image above taken at 21:05 UT.
Find a movie of the event here: https://proba2.sidc.be/swap/movies/20201229_swap_movie.mp4 (SWAP movie)
Saturday Jan 02
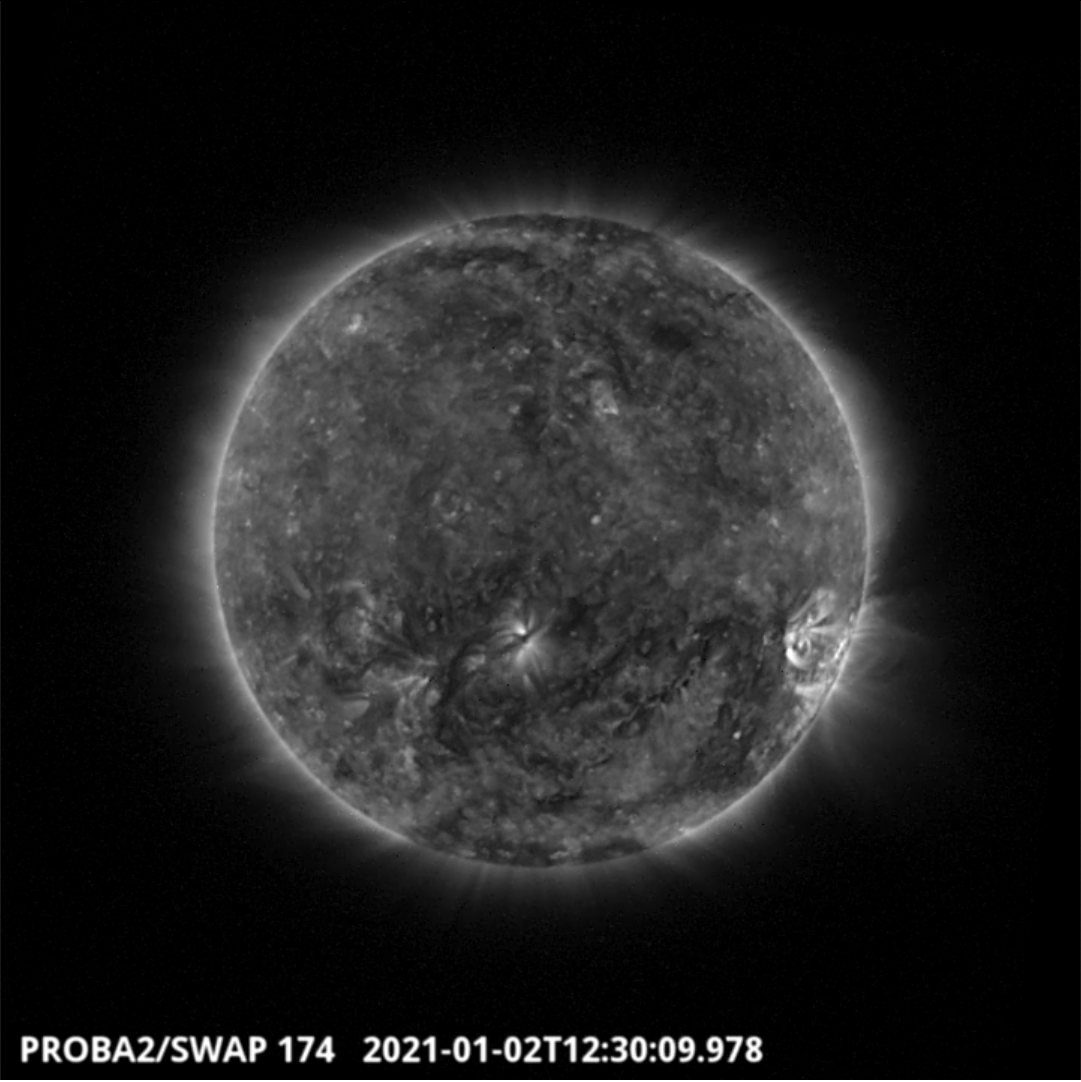
A filament eruption was observed by SWAP in the south-west quadrant of the solar disk on 2021-Jan-02, as shown in the SWAP image above taken at 12:30 UT. This was one of three filament eruptions over two days.
Find a movie of the entire day here: https://proba2.sidc.be/swap/movies/20210102_swap_movie.mp4 (SWAP movie).
The International Sunspot Number by SILSO
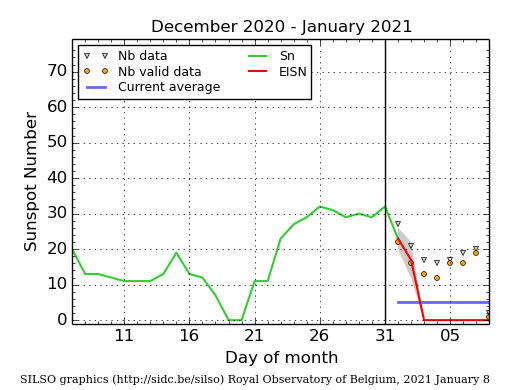
The daily Estimated International Sunspot Number (EISN, red curve with shaded error) derived by a simplified method from real-time data from the worldwide SILSO network. It extends the official Sunspot Number from the full processing of the preceding month (green line). The plot shows the last 30 days (about one solar rotation). The horizontal blue line shows the current monthly average. The yellow dots gives the number of stations that provided valid data. Valid data are used to calculate the EISN. The triangle gives the number of stations providing data. When a triangle and a yellow dot coincide, it means that all the data is used to calculate the EISN of that day.
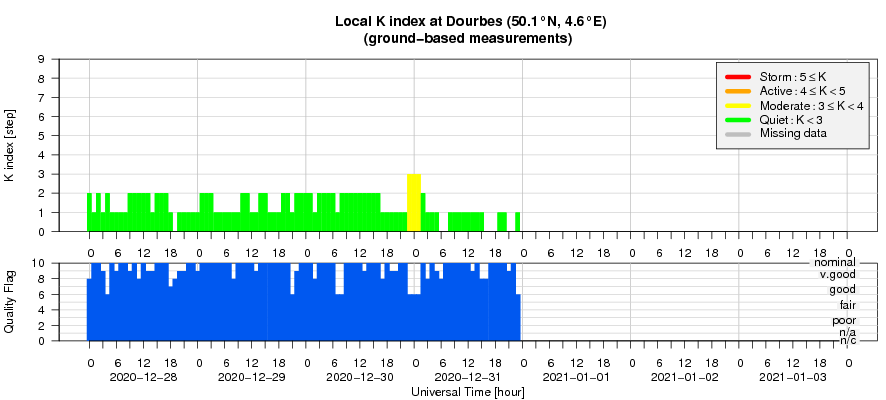
Geomagnetic Observations at Dourbes (28 Dec 2020 - 3 Jan 2021)
The SIDC Space Weather Briefing - Dec 28, 2020 - Jan 03, 2021
The Space Weather Briefing presented by the forecaster on duty from Dec 27, 2020 to Jan 3, 2021 . It reflects in images and graphs what is written in the Solar and Geomagnetic Activity report.

Pdf-version: http://www.stce.be/briefings/20210104_SWbriefing.pdf
The movie: http://www.stce.be/briefings/20210104_SWbriefing.m4v
Review of ionospheric activity (28 Dec 2020 - 3 Jan 2021)
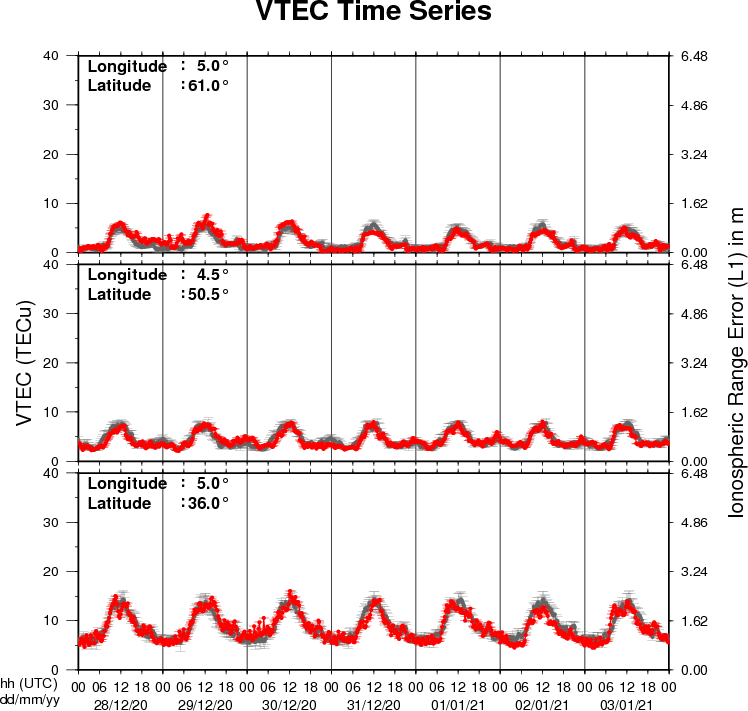
The figure shows the time evolution of the Vertical Total Electron Content (VTEC) (in red) during the last week at three locations:
a) in the northern part of Europe(N61°, 5°E)
b) above Brussels(N50.5°, 4.5°E)
c) in the southern part of Europe(N36°, 5°E)
This figure also shows (in grey) the normal ionospheric behaviour expected based on the median VTEC from the 15 previous days.
The VTEC is expressed in TECu (with TECu=10^16 electrons per square meter) and is directly related to the signal propagation delay due to the ionosphere (in figure: delay on GPS L1 frequency).
The Sun's radiation ionizes the Earth's upper atmosphere, the ionosphere, located from about 60km to 1000km above the Earth's surface.The ionization process in the ionosphere produces ions and free electrons. These electrons perturb the propagation of the GNSS (Global Navigation Satellite System) signals by inducing a so-called ionospheric delay.
See http://stce.be/newsletter/GNSS_final.pdf for some more explanations ; for detailed information, see http://gnss.be/ionosphere_tutorial.php