- Table of Content
- 1.A filament lea...
- 2.An appetizer
- 3.Review of sola...
- 4.The Internatio...
- 5.PROBA2 Observa...
- 6.Review of geom...
- 7.Geomagnetic Ob...
- 8.The SIDC Space...
- 9.Review of iono...
2. An appetizer
3. Review of solar activity
4. The International Sunspot Number by Silso
5. PROBA2 Observations (1 Feb 2021 - 7 Feb 2021)
6. Review of geomagnetic activity
7. Geomagnetic Observations at Dourbes (1 Feb 2021 - 7 Feb 2021)
8. The SIDC Space Weather Briefing
9. Review of ionospheric activity (1 Feb 2021 - 7 Feb 2021)
A filament leaving the Sun
Solar prominences are clouds of charged particles ("plasma") above the solar surface squeezed between magnetic regions of opposite polarity. Being cooler and denser than the plasma underneath and their surroundings, they appear as bright blobs when seen near the solar limb and as dark lines when seen on the solar disk (then they are called "filaments"). Special filters are required to observe these features, such as in the Hydrogen-alpha (H-alpha) line in the red part of the solar spectrum, or in some extreme ultraviolet (EUV) passbands.
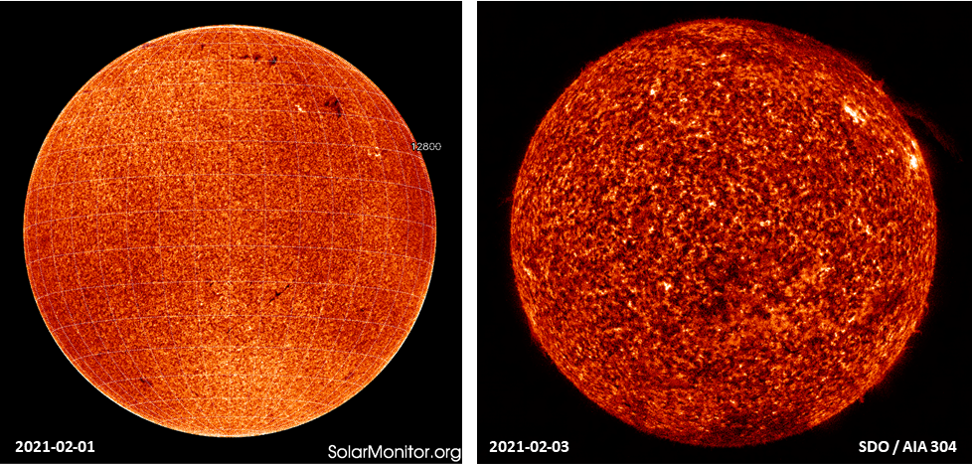
Late on 2 February, a filament near the northwestern solar limb became unstable and visible as an eruptive prominence. The H-alpha image on 1 February clearly reveals the presence of a long but fragmented filament in the northern solar hemisphere. Two days later, the solar rotation had moved the solar filament much closer to the northwestern solar limb, where it erupted. Note also that the northen portion is involved in the process, with material raining back along the magnetic field lines onto the solar surface.
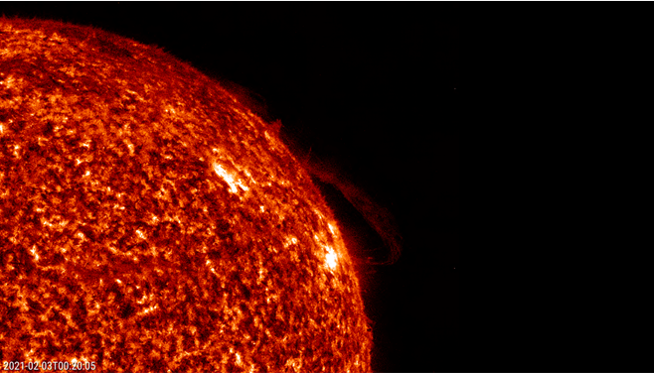
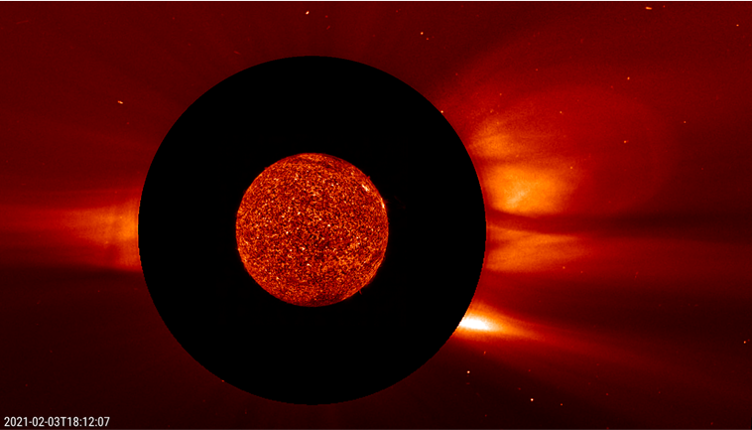
A coronal mass ejection (CME) was associated with this filament eruption, but is was very slow with a speed of only about 100 km/s. It was also not directed towards Earth. Movies of this event can be found at https://www.stce.be/news/514/welcome.html
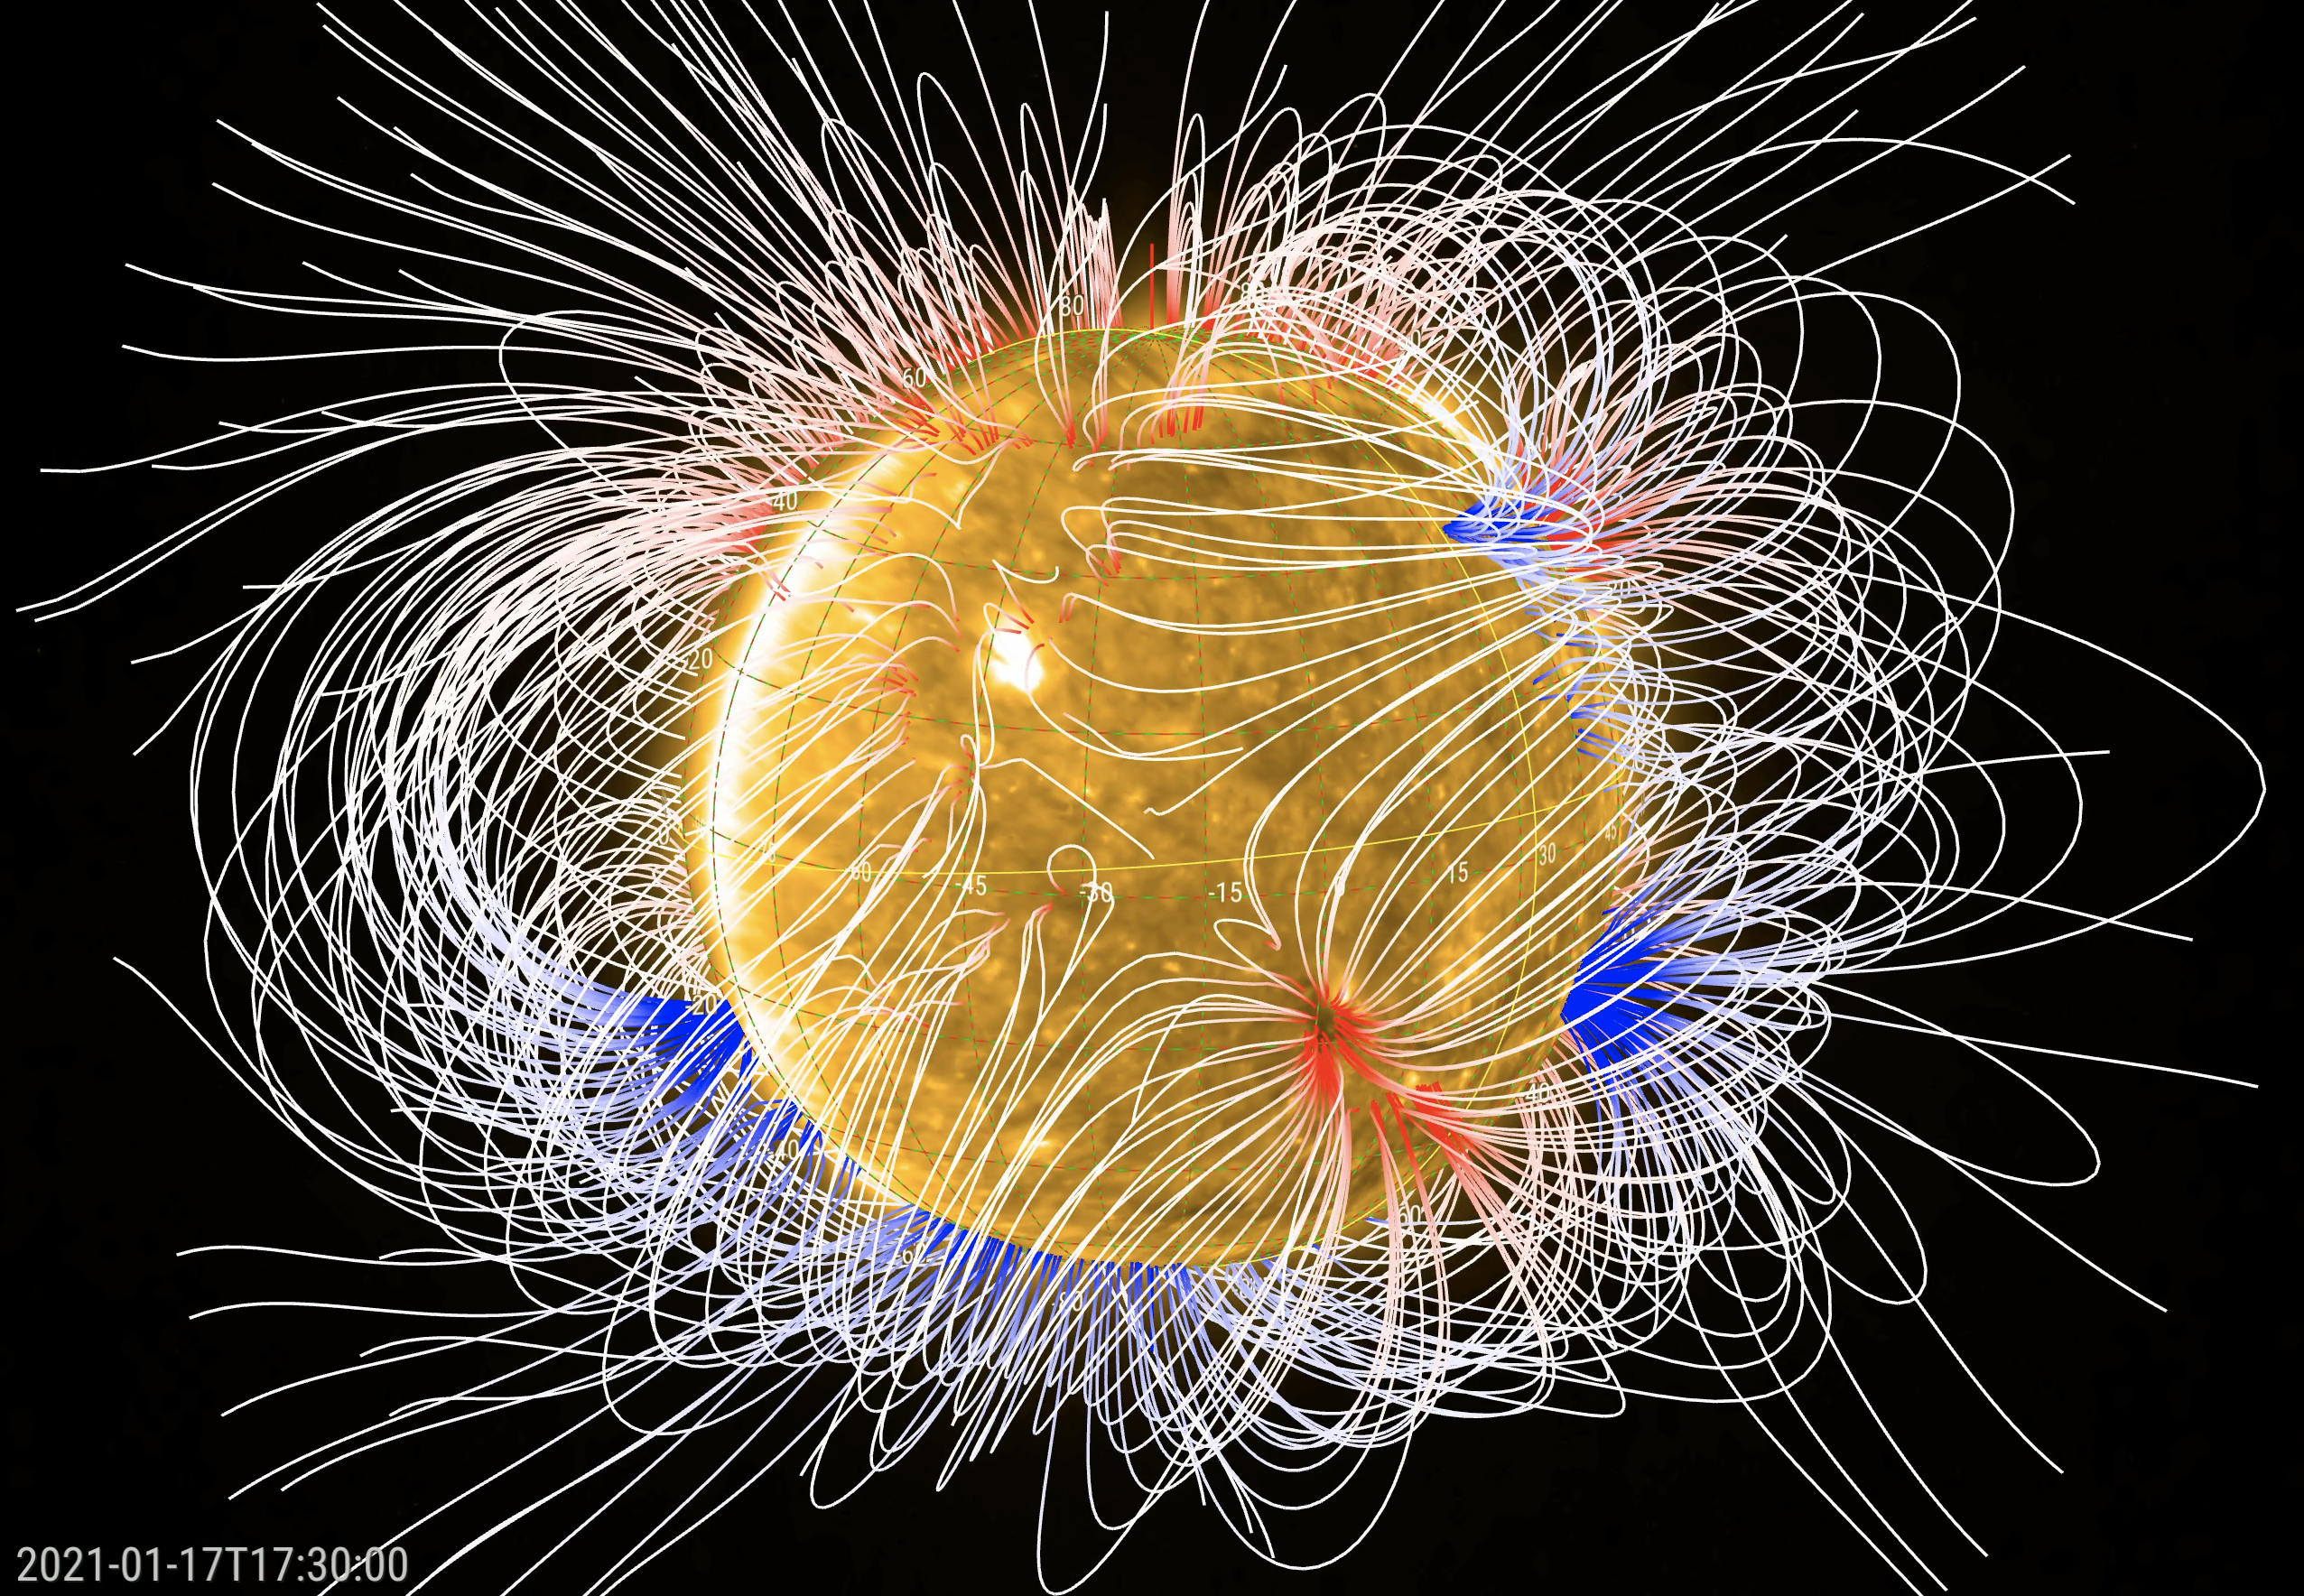
An appetizer
On Feb 10, it was 1 year that the EUI telescope is on its First Class seat on Solar Orbiter watching a solar movie and becoming the leading expert in solar campfires.
This is an appetizer for next week '1 year' EUI news item: the Sun with its hair messed up.
Review of solar activity
The week started with a spotless Sun. On February 3, NOAA AR 2801 appeared, the only AR of the week. It evolved from a beta to an alpha magnetic field configuration in a day, and disappeared in two days. No flares occurred.
No Earth directed Coronal Mass Ejections (CMEs) have been detected in the available coronagraphic imagery.
A positive polarity equatorial coronal hole traversed central meridian on February 3.
The greater than 10 MeV proton flux was at nominal values.
The greater than 2 MeV electron flux was elevated shortly only on February 1 and 6.
The greater than 2 MeV electron fluence started the week at moderate levels, and went on February 2 to normal levels.
The International Sunspot Number by Silso
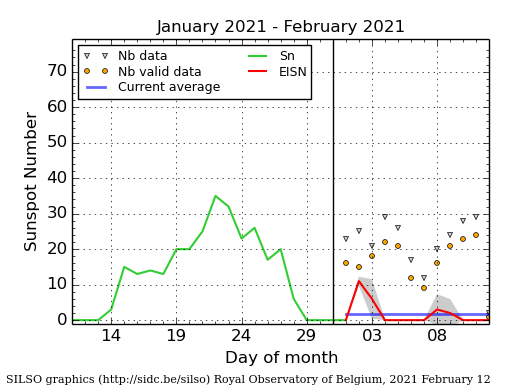
The daily Estimated International Sunspot Number (EISN, red curve with shaded error) derived by a simplified method from real-time data from the worldwide SILSO network. It extends the official Sunspot Number from the full processing of the preceding month (green line), a few days more than one solar rotation. The horizontal blue line shows the current monthly average. The yellow dots gives the number of stations that provided valid data. Valid data are used to calculate the EISN. The triangle gives the number of stations providing data. When a triangle and a yellow dot coincide, it means that all the data is used to calculate the EISN of that day.
PROBA2 Observations (1 Feb 2021 - 7 Feb 2021)
Solar Activity
Solar flare activity was very low during the week.
In order to view the activity of this week in more detail, we suggest to go to the following website from which all the daily (normal and difference) movies can be accessed: https://proba2.oma.be/ssa
This page also lists the recorded flaring events.
A weekly overview movie can be found here (SWAP week 567). http://proba2.oma.be/swap/data/mpg/movies/weekly_movies/weekly_movie_2021_02_01.mp4
Details about some of this week's events can be found further below.
If any of the linked movies are unavailable they can be found in the P2SC movie repository here https://proba2.oma.be/swap/data/mpg/movies/
Wednesday Feb 03
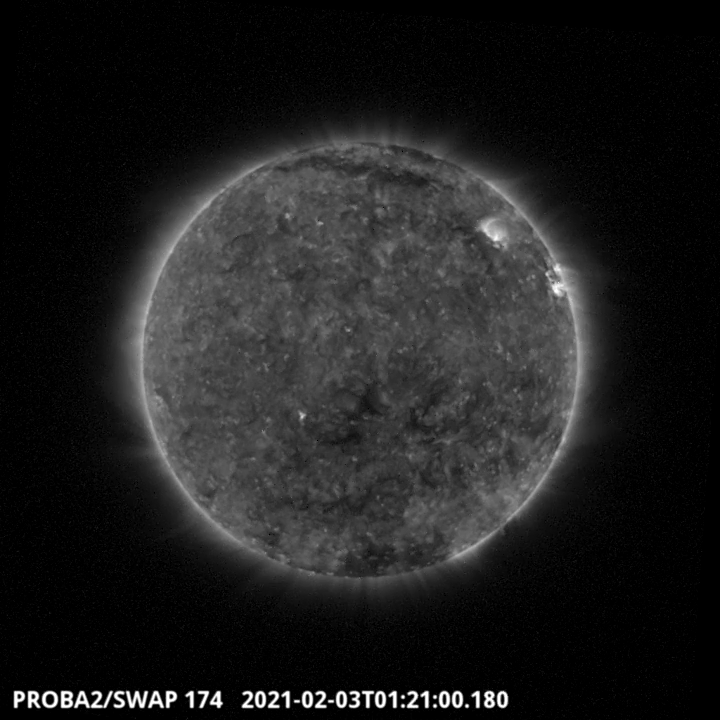
A central coronal hole crossed the central meridian around 1:21UT on 2021-02-03. It is visible on the SWAP image above. Find a movie of the events here (SWAP movie) http://proba2.oma.be/swap/data/mpg/movies/20210203_swap_movie.mp4
Review of geomagnetic activity
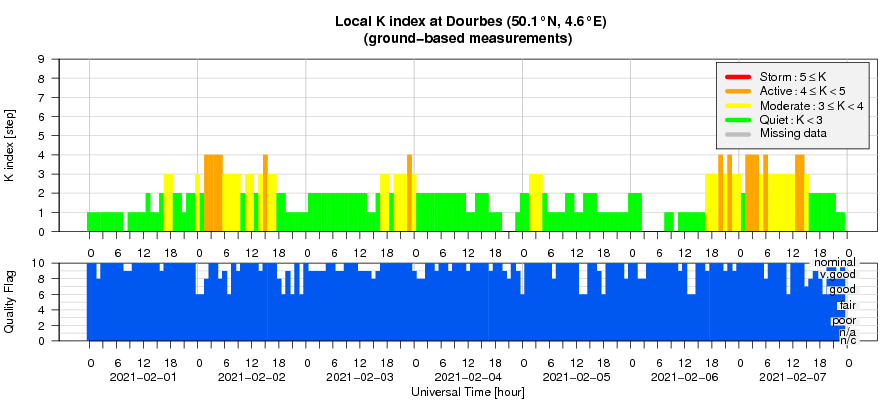
On February 1, the high-speed stream from the negative polarity coronal hole that crossed the central meridian on January 28 arrived to the Earth. Speeds reached 615 km/s, the total magnetic field strength reached 20 nT and Bz had a minimum value of -13 nT. Geomagnetic conditions reached active levels both locally at Dourbes (K = 4) and at planetary levels (Kp = 4), on February 2 and 3.
On February 6, the high-speed stream from the positive polarity coronal hole that crossed the central meridian on February 3 arrived to the Earth. Speeds reached 540 km/s, the total magnetic field strength reached 13 nT and Bz had a minimum value of -8 nT. Geomagnetic conditions reached active levels locally at Dourbes (K = 4) and minor storm at planetary levels (Kp = 5), on February 6 and 7.
Geomagnetic Observations at Dourbes (1 Feb 2021 - 7 Feb 2021)
The SIDC Space Weather Briefing
The Space Weather Briefing presented by the forecaster on duty from Jan 31 to Feb 7. It reflects in images and graphs what is written in the Solar and Geomagnetic Activity report.

A pdf-version: https://www.stce.be/briefings/20210208_SWbriefing.pdf
The movie: https://www.stce.be/briefings/20210208_SWbriefing.m4v
Review of ionospheric activity (1 Feb 2021 - 7 Feb 2021)
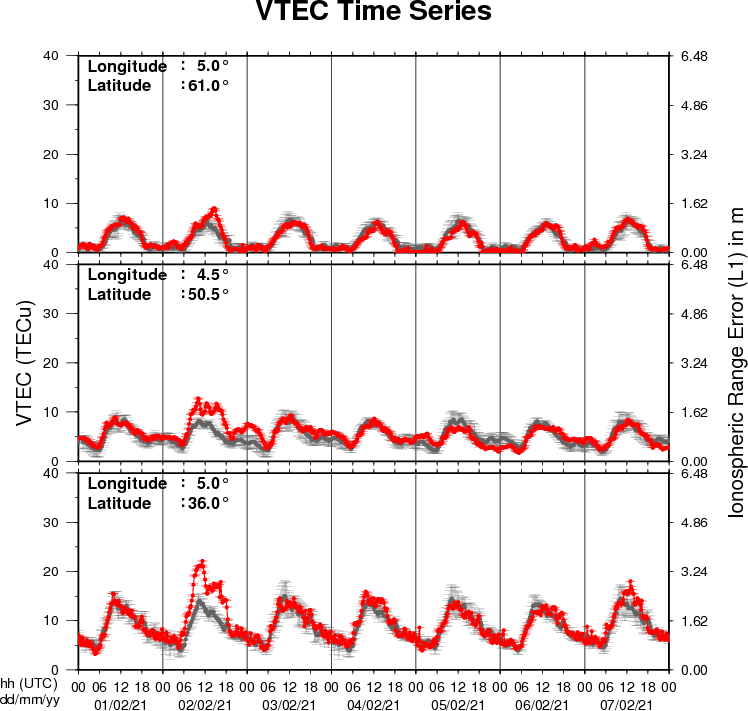
The figure shows the time evolution of the Vertical Total Electron Content (VTEC) (in red) during the last week at three locations:
a) in the northern part of Europe(N61°, 5°E)
b) above Brussels(N50.5°, 4.5°E)
c) in the southern part of Europe(N36°, 5°E)
This figure also shows (in grey) the normal ionospheric behaviour expected based on the median VTEC from the 15 previous days.
The VTEC is expressed in TECu (with TECu=10^16 electrons per square meter) and is directly related to the signal propagation delay due to the ionosphere (in figure: delay on GPS L1 frequency).
The Sun's radiation ionizes the Earth's upper atmosphere, the ionosphere, located from about 60km to 1000km above the Earth's surface.The ionization process in the ionosphere produces ions and free electrons. These electrons perturb the propagation of the GNSS (Global Navigation Satellite System) signals by inducing a so-called ionospheric delay.
See http://stce.be/newsletter/GNSS_final.pdf for some more explanations ; for detailed information, see http://gnss.be/ionosphere_tutorial.php