- Table of Content
- 1.13-14 March: t...
- 2.Review of sola...
- 3.PROBA2 Observa...
- 4.The Internatio...
- 5.Review of geom...
- 6.Geomagnetic Ob...
- 7.The SIDC Space...
- 8.Review of iono...
2. Review of solar activity
3. PROBA2 Observations (8 Mar 2021 - 14 Mar 2021)
4. The International Sunspot Number by Silso
5. Review of geomagnetic activity
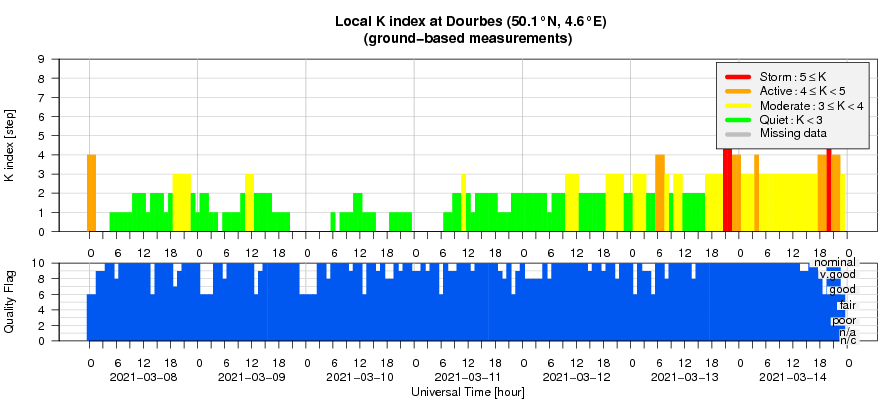
6. Geomagnetic Observations at Dourbes (8 Mar 2021 - 14 Mar 2021)
7. The SIDC Space Weather Briefing
8. Review of ionospheric activity (8 Mar 2021 - 14 Mar 2021)
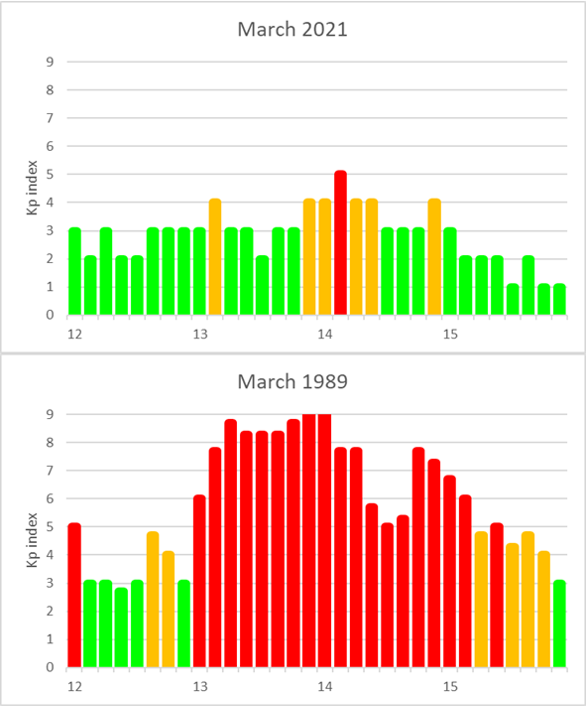
13-14 March: two geomagnetic storms compared
Last weekend, geomagnetic activity reached minor storm levels (Kp = 5) on 14 March, with active levels recorded on 13 March. The source of this activity was the arrival of a recurrent, negative polarity (i.e. magnetic field pointing sunwards) high-speed solar wind stream related to an extension from the southern polar coronal hole. Exactly on the same days, 32 years ago, the earth environment also experienced a geomagnetic storm, however this one reached extremely severe levels (Kp = 9) following the arrival of 2 coronal mass ejections (CMEs) launched by the huge sunspot group NOAA 5395 during the preceding days (Boteler, 2019 - https://agupubs.onlinelibrary.wiley.com/doi/full/10.1029/2019SW002278 ). The difference in geomagnetic activity can be seen in the plots underneath, with the upper diagram showing the evolution of the Kp index from 12 till 15 March 2021, and the lower diagram covering the same period but for the year 1989 (see the newsitem at https://www.stce.be/news/243/welcome.html for more info on the Kp index). No surprize then that the 13-14 March geomagnetic storm is considered as one of the strongest of the entire 20th century.
The space weather effects from this 1989 storm are well known. Aurorae were visible as far south as Cuba, while in Québec the power grid collapsed leaving millions without electricity for 9 hours. The number of "new" objects around Earth (space debris and satellites changing orbits due to atmospheric drag) rose from a daily average of 1000 to more than 6000 during and in the days following this geomagnetic storm. It took nearly a week to link and re-identify these "new" objects to known ones. The Solar Maximum Mission (SMM) for example, orbiting at about 450 km in altitude, was reported to have lost nearly 5 kilometers in altitude during this period. Radio communications became erratic, with some frequencies such as HF (High Frequency, 3-30 MHz) not working at all, while other frequencies such as certain VHF (Very High Frequency, 30-300 MHz) suddenly becoming available. A little known anecdote is that automatic garage doors in a California coastal suburb suddenly began to open and close without apparent reason. This curious phenomenon was eventually traced to a Navy ship that was using a special shore-based system in an attempt to maintain remote radio communications while HF radio was out of operation (Allen et al. 1989 - https://agupubs.onlinelibrary.wiley.com/doi/epdf/10.1029/89EO00409 )!

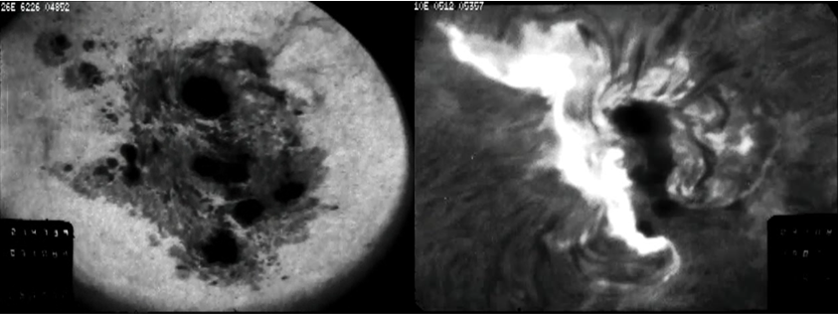
All together, NOAA 5395 produced 11 X- and 48 M-class flares during its solar transit from 6 till 19 March 1989. Underneath a view in white light and in H-alpha of the region on 10 March as recorded by telescopes at the Big Bear Solar Observatory. The H-alpha image shows an X4.5 flare in progress. The CME related to this flare is thought to be the first of the two CMEs leading to the 13-14 March geomagnetic storm. Images retrieved via the Solar Film Digitization project from the New Jersey Institute of Technology (http://sfd.njit.edu/ ).
Review of solar activity
A single C1.6 flare was recorded over the week. The X-ray flux remained below C-level with just a few other B flares. NOAA region 2806 turned over the West limb in the beginning of the week. NOAA region 2807 showed some renewed spot emergence in the intermediate part, but remained quiet as it also reached the West limb. Most if not all activity came from NOAA 2808 as soon as it turned over the East limb. While on disc, it only briefly formed spots in its trailing part but was mostly dominated by the sunspot in the leading part. Another region (NOAA 2809) formed on disc but spot formation in that region was also weak and it decayed quickly into plage.
No Earth-directed Coronal Mass Ejections (CMEs) have been observed in coronagraph data.
The greater than 10 MeV proton flux was at nominal levels over the entire week.
In the wake of the high speed stream at the start of the week, the greater than 2 MeV electron flux peaked over the 1000 pfu event threshold at most days during the diurnal maxima. The 24h electron fluence was mostly in the moderate levels. Only on Mach 12-13 the fluence was at normal levels following the sector boundary crossing in the solar wind, before levels started to slowly rise again in relation to the following high speed stream.
PROBA2 Observations (8 Mar 2021 - 14 Mar 2021)
Solar Activity
Solar flare activity fluctuated between very low and low during the week.
In order to view the activity of this week in more detail, we suggest to go to the following website from which all the daily (normal and difference) movies can be accessed: https://proba2.oma.be/ssa
This page also lists the recorded flaring events.
A weekly overview movie can be found here (SWAP week 572): https://proba2.sidc.be/swap/data/mpg/movies/weekly_movies/weekly_movie_2021_03_08.mp4
Details about some of this week's events can be found further below.
If any of the linked movies are unavailable they can be found in the P2SC movie repository here: https://proba2.oma.be/swap/data/mpg/movies/
Tuesday Mar 09
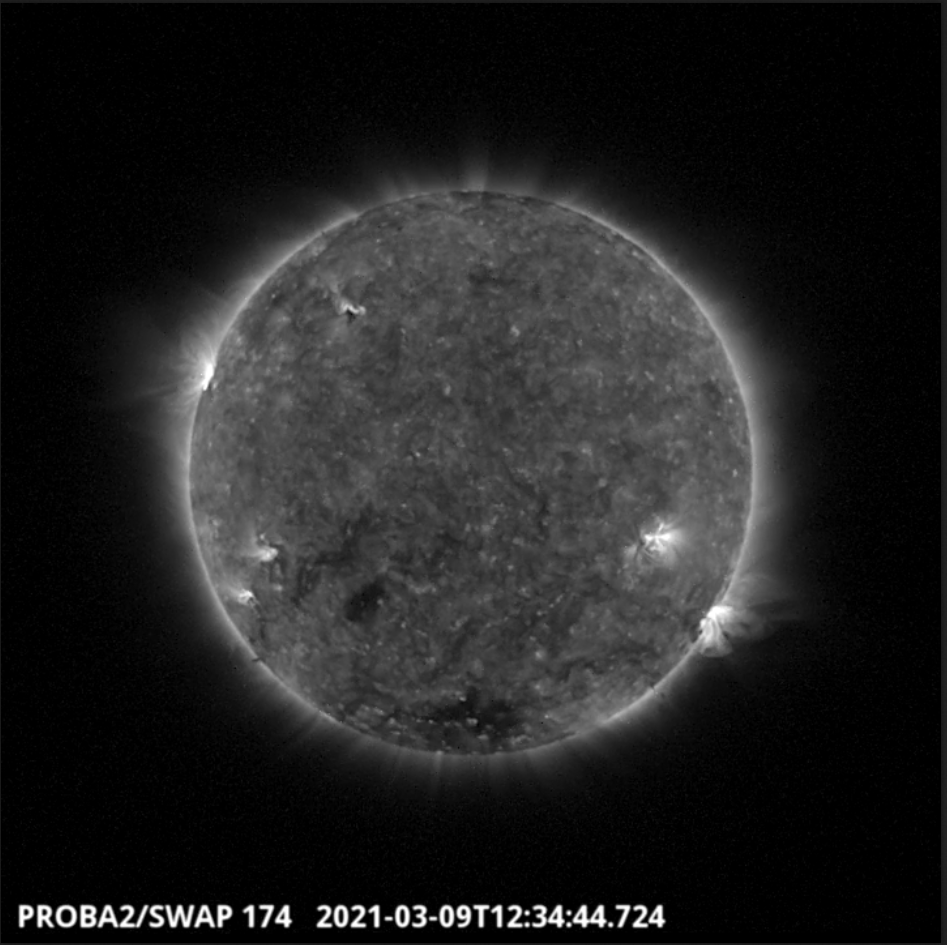
The largest flare of the week was a C1.6 flare, which was observed by SWAP and LYRA on 2021-Mar-09. The flare occurred on the north-eastern limb of the solar disk, as shown in the SWAP image above taken at 12:34 UT.
Find a movie of the event here: https://proba2.sidc.be/swap/movies/20210309_swap_movie.mp4 (SWAP movie)
The International Sunspot Number by Silso
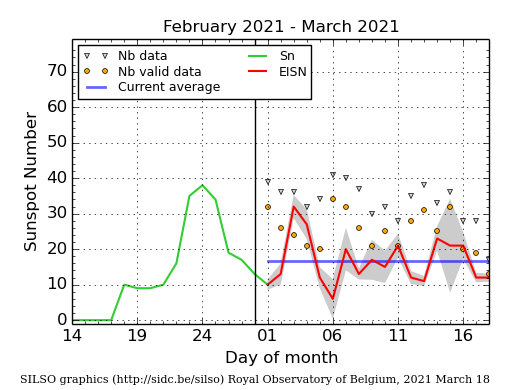
The daily Estimated International Sunspot Number (EISN, red curve with shaded error) derived by a simplified method from real-time data from the worldwide SILSO network. It extends the official Sunspot Number from the full processing of the preceding month (green line), a few days more than one solar rotation. The horizontal blue line shows the current monthly average. The yellow dots gives the number of stations that provided valid data. Valid data are used to calculate the EISN. The triangle gives the number of stations providing data. When a triangle and a yellow dot coincide, it means that all the data is used to calculate the EISN of that day.
Review of geomagnetic activity
Solar wind conditions showed a gradual return from the high speed stream conditions at the start of the week. From over 500 km/s at the start of the week, the solar wind speed dropped to well under 400 km/s by March 12. A sector boundary crossing into the negative sector (towards the Sun) occurred in the morning of March 12. Leading up to and following the boundary crossing, the interplanetary magnetic field increased to over 9 nT, with Bz negative for a persistent period. March 13 was then marked by the onset of another high speed stream with the total magnetic field, in the compression region ahead of it, reaching 15nT with peaks down to -11nT for the Bz component. The wind velocities came close to 600 km/s by the end of the week.
Geomagnetic conditions reached initially still some unsettled and active periods in the wake of high speed stream before returning to mostly quiet conditions throughout March 9-11. Unsettled conditions were recorded around the sector boundary crossing on March 12, and then leading up to active conditions and later some episodes of minor geomagnetic storming associated to the ongoing high speed stream conditions at the end of the week.
Geomagnetic Observations at Dourbes (8 Mar 2021 - 14 Mar 2021)
The SIDC Space Weather Briefing
The Space Weather Briefing presented by the forecaster on duty from March 7 to 14. It reflects in images and graphs what is written in the Solar and Geomagnetic Activity report.

A pdf-version: https://www.stce.be/briefings/20210315_SWbriefing.pdf
The movie: https://www.stce.be/briefings/20210315_SWbriefing.m4v
Review of ionospheric activity (8 Mar 2021 - 14 Mar 2021)
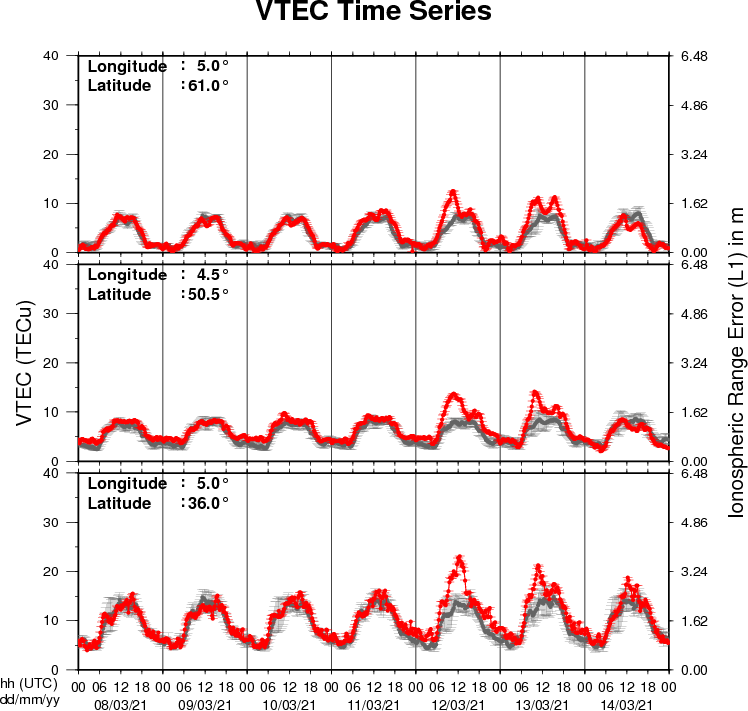
The figure shows the time evolution of the Vertical Total Electron Content (VTEC) (in red) during the last week at three locations:
a) in the northern part of Europe(N61°, 5°E)
b) above Brussels(N50.5°, 4.5°E)
c) in the southern part of Europe(N36°, 5°E)
This figure also shows (in grey) the normal ionospheric behaviour expected based on the median VTEC from the 15 previous days.
The VTEC is expressed in TECu (with TECu=10^16 electrons per square meter) and is directly related to the signal propagation delay due to the ionosphere (in figure: delay on GPS L1 frequency).
The Sun's radiation ionizes the Earth's upper atmosphere, the ionosphere, located from about 60km to 1000km above the Earth's surface.The ionization process in the ionosphere produces ions and free electrons. These electrons perturb the propagation of the GNSS (Global Navigation Satellite System) signals by inducing a so-called ionospheric delay.
See http://stce.be/newsletter/GNSS_final.pdf for some more explanations ; for detailed information, see http://gnss.be/ionosphere_tutorial.php