- Table of Content
- 1.SOHO catches 3...
- 2.Review of sola...
- 3.PROBA2 Observa...
- 4.The Internatio...
- 5.Review of geom...
- 6.Geomagnetic Ob...
- 7.Review of iono...
- 8.STCE in action...
2. Review of solar activity
3. PROBA2 Observations (1 Mar 2021 - 7 Mar 2021)
4. The International Sunspot Number by Silso
5. Review of geomagnetic activity
6. Geomagnetic Observations at Dourbes
7. Review of ionospheric activity (29 Mar 2021 - 4 Apr 2021)
8. STCE in action: upcoming events
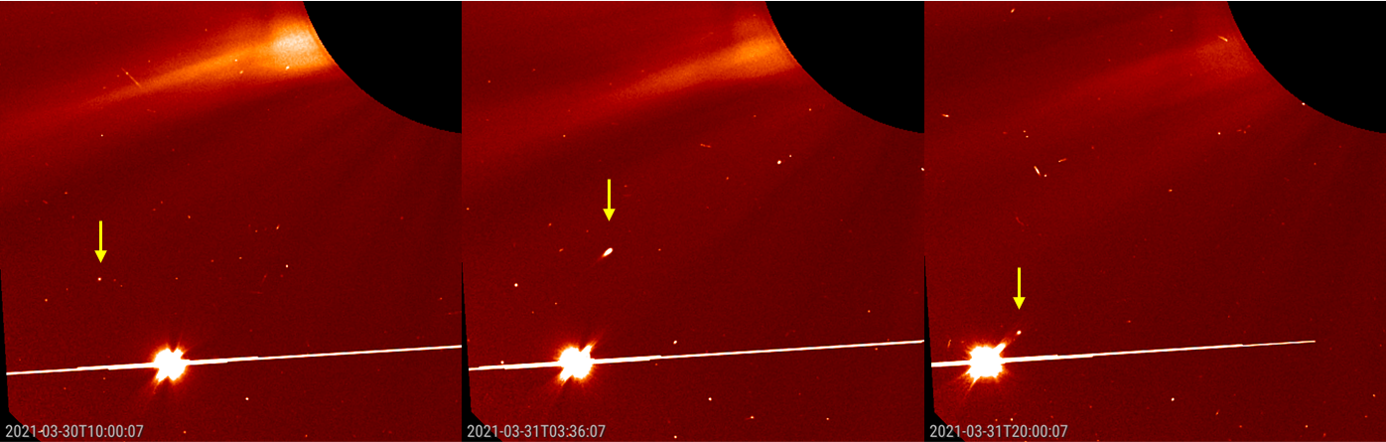
SOHO catches 3 new comets
From 29 till 31 March, a number of small chunks of ice and rock approached the Sun and became visible as tiny comets in the LASCO/C2 coronagraph on board the SOHO spacecraft (https://sohowww.nascom.nasa.gov/home.html ). A coronagraph is an instrument that blocks out the solar disk so that the immediate vicinity around the Sun becomes visible, similar to what our Moon does during a total solar eclipse. Though SOHO's coronagraph is used to observe coronal mass ejections (CME), it has also made SOHO the most successful comet hunter so far. Indeed, late February, it had already 4138 comets on its very long list of comet discoveries since its launch in 1995. Quite a few of those detections were actually made by amateur astronomers ("citizen scientists") who were examining SOHO's imagery. SOHO's coronagraphs were never intended to chase comets, but their high sensitivity, wide field of view, and around-the-clock observing capability make them perfectly suited to see comets, in particular the ones that come very close to the Sun.
The 3 comets are visible in the annotated LASCO/C2 images underneath (a clip is at https://www.stce.be/news/521/welcome.html , with the comets moving from the lower-left to the upper-right). The bright dot at the lower-left is the planet Venus. Only the second comet developed a visible (small) tail, the other two remained mainly dot-like in the C2 imagery. None of the three comets survived their close encounter with the Sun. In fact, as can be seen in the clip, they evaporated before they even came close to the Sun. The comets are members of the Kreutz family. This is a group of comets that all follow pretty much the same orbit that brings them very close to the Sun ("sungrazers"). It is believed that they are all fragments of a comet that broke apart several centuries ago. Most of the Kreutz members do not survive their intimate rendez-vous with the Sun. There are several other comet families, and a list with their apparent orbits as seen by the SOHO coronagraphs can be found at The Sungrazer project https://sungrazer.nrl.navy.mil/ website (C2/C3 comet tracks: https://sungrazer.nrl.navy.mil/C2_C3_Comet_Tracks ).
Review of solar activity
Solar activity was low levels over the past week. Early in the week, Catania sunspot group 83 (NOAA-AR 2812) and Catania sunspot group 82 (NOAA-AR 2811) decayed into plages. The largest flare was a B7.4 flare peaking on Mars 30, at 20:18 UTC. It was released from Catania sunspot group 82.
No Earth-directed coronal mass ejections (CMEs) were observed in the available coronagraph imagery.
The greater than 10 MeV proton flux was at nominal levels.
The greater than 2 MeV electron flux exceeded the 1000 pfu threshold on April 02, between 17:15 UTC and 17:40 UTC.
The electron fluence was at nominal levels.
PROBA2 Observations (1 Mar 2021 - 7 Mar 2021)
Solar Activity
Solar flare activity was very low during the week.
In order to view the activity of this week in more detail, we suggest to go to the following website from which all the daily (normal and difference) movies can be accessed: https://proba2.oma.be/ssa
This page also lists the recorded flaring events.
A weekly overview movie can be found here (SWAP week 575). https://proba2.oma.be/swap/data/mpg/movies/weekly_movies/weekly_movie_2021_03_29.mp4
Details about some of this week's events can be found further below.
If any of the linked movies are unavailable they can be found in the P2SC movie repository here https://proba2.oma.be/swap/data/mpg/movies/
Tuesday Mar 30
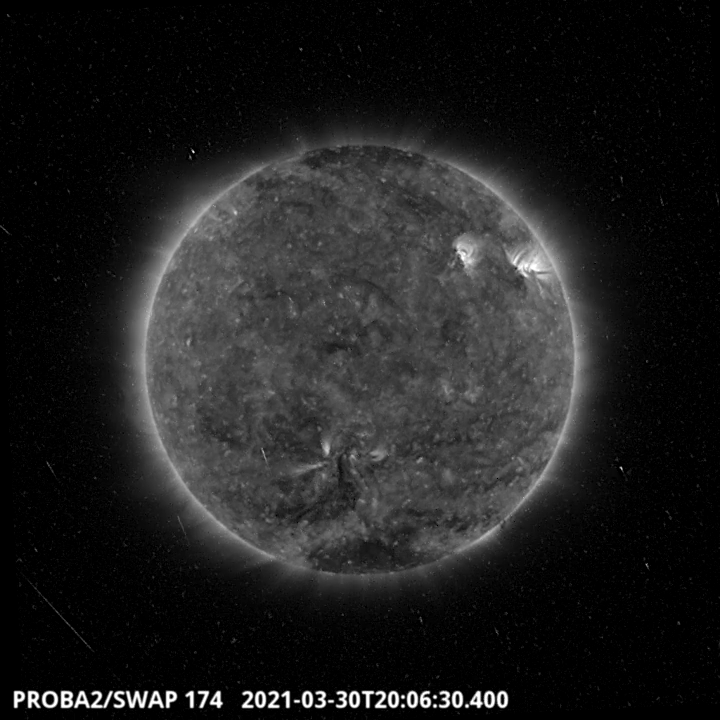
Flows on the North West of the solar disk on the SWAP image above around 20:06 UT.
This flare is the largest of the week. It has been classified as a B7.4-class event coming from the NOAA active region 2811. Find a movie of the events here (SWAP movie) https://proba2.oma.be/swap/data/mpg/movies/20210330_swap_movie.mp4
The International Sunspot Number by Silso
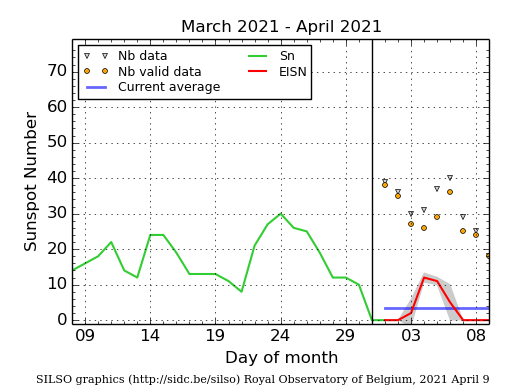
The daily Estimated International Sunspot Number (EISN, red curve with shaded error) derived by a simplified method from real-time data from the worldwide SILSO network. It extends the official Sunspot Number from the full processing of the preceding month (green line), a few days more than one solar rotation. The horizontal blue line shows the current monthly average. The yellow dots gives the number of stations that provided valid data. Valid data are used to calculate the EISN. The triangle gives the number of stations providing data. When a triangle and a yellow dot coincide, it means that all the data is used to calculate the EISN of that day.
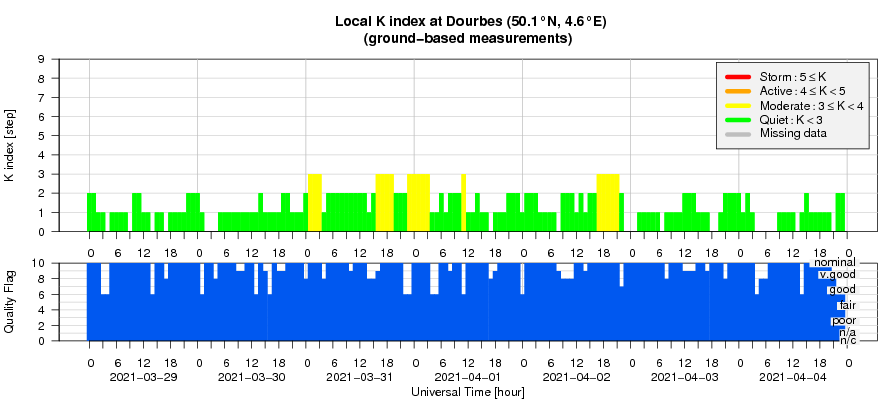
Review of geomagnetic activity
The solar wind parameters (ACE and DSCOVR) were slightly enhanced due to the solar wind stream associated with the small and patchy equatorial coronal hole (in the south hemisphere, with negative polarity): The solar wind speed ranged between 300 km/s and 440 km/s. The interplanetary magnetic field magnitude peaked at 9.0 nT on April 02, and the Bz component varied between -7.5 nT and 6.6 nT.
Geomagnetic conditions were quiet to unsettled (Kp and K-Dourbes: 1-3) due to the slight enhancement of the solar wind.
Geomagnetic Observations at Dourbes
Review of ionospheric activity (29 Mar 2021 - 4 Apr 2021)
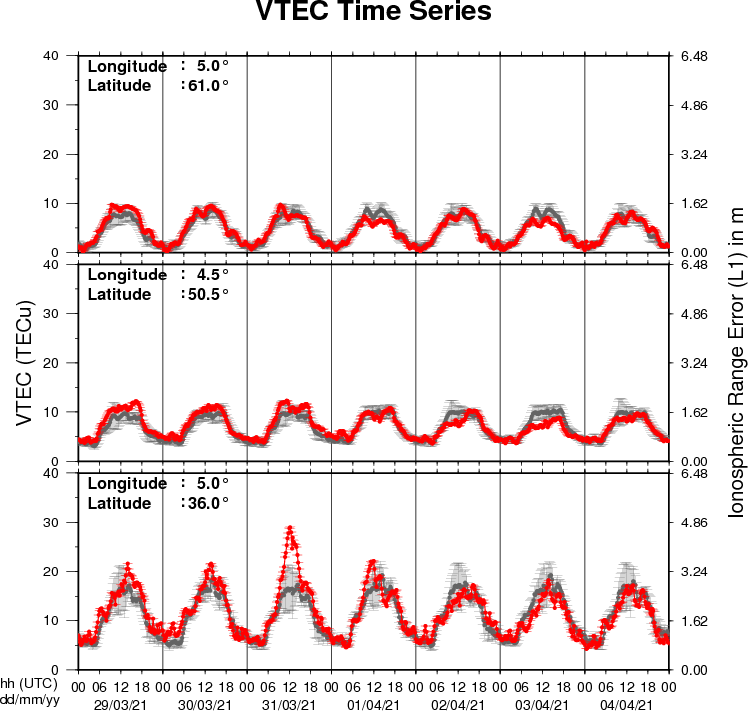
The figure shows the time evolution of the Vertical Total Electron Content (VTEC) (in red) during the last week at three locations:
a) in the northern part of Europe(N61°, 5°E)
b) above Brussels(N50.5°, 4.5°E)
c) in the southern part of Europe(N36°, 5°E)
This figure also shows (in grey) the normal ionospheric behaviour expected based on the median VTEC from the 15 previous days.
The VTEC is expressed in TECu (with TECu=10^16 electrons per square meter) and is directly related to the signal propagation delay due to the ionosphere (in figure: delay on GPS L1 frequency).
The Sun's radiation ionizes the Earth's upper atmosphere, the ionosphere, located from about 60km to 1000km above the Earth's surface.The ionization process in the ionosphere produces ions and free electrons. These electrons perturb the propagation of the GNSS (Global Navigation Satellite System) signals by inducing a so-called ionospheric delay.
See http://stce.be/newsletter/GNSS_final.pdf for some more explanations ; for detailed information, see http://gnss.be/ionosphere_tutorial.php
STCE in action: upcoming events
Check out our activity calendar: activities and encounters with space weather as main theme. We provide occasions to get submerged in the space weather world through educational, informative and instructive activities.
Due to COVID, these activities and events are organised online.
April 15 - seminar: deflection of prominence-CME events
May 17,18,20,21: SWx introductory course (registration is not open yet)
Details on: https://www.stce.be/calendar