- Table of Content
- 1.The great stor...
- 2.New load of SW...
- 3.Review of sola...
- 4.The Internatio...
- 5.Review of geom...
- 6.Geomagnetic Ob...
- 7.The SIDC Space...
- 8.Review of iono...
2. New load of SWx forecasters and operators
3. Review of solar activity
4. The International Sunspot Number by Silso
5. Review of geomagnetic activity
6. Geomagnetic Observations at Dourbes (10 May 2021 - 16 May 2021)
7. The SIDC Space Weather Briefing
8. Review of ionospheric activity (10 May 2021 - 16 May 2021)
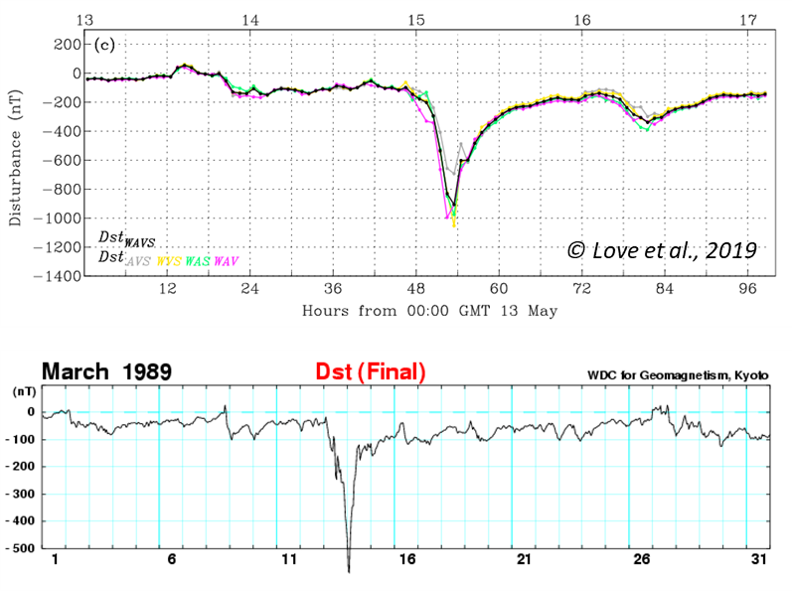
The great storm of 15 May 1921
On 15 May 1921, the strongest geomagnetic storm of the entire 20th century took place. With a reconstructed Dst index of 907 +/- 132 nT (Love et al., 2019 - for links to the papers see the online version of this article at https://www.stce.be/news/529/welcome.html), it was significantly stronger than the March 1989 storm (-589 nT ; see the comparison underneath) and of comparable strength as the Carrington storm in 1859 (Dst between -850 (Siscoe et al., 2006) and -1050 nT (Gonzalez et al., 2011). The Dst ("storm-time disturbance") index is calculated by 4 near-equatorial geomagnetic observatories and reflects variations in the intensity of the ring current. The stronger the disturbance, the more negative is the Dst index. Underneath a comparison of the storms from 1921 (black curve, Dst reconstructed from 4 observatories; from Love et al. 2019) and 1989 (from the Kyoto World Data Center for Geomagnetism). Mind the difference in scalings of both the horizontal (time) and vertical (Dst) axis.
This strong geomagnetic storm induced electrical currents in the Earth's crust which found their way in telegraph/telephone systems, the key technologies at that time. Telegraph service was severely disturbed worldwide. Telegraph systems in Paris were unable to receive messages from the rest of Europe, or from the United States, during the night of 14/15 May. In Karlstadt (Sweden), currents were so strong they created a fire in the telegraph and telephone station. In Brewster (New York state), a railroad station got destroyed following a fire which was attributed to srong electrical currents in the telegraph system. Another fire destroyed a railroad control tower near New York City's Grand Central station, also and significantly delaying train traffic. However, recent research by Hapgood (2019) has indicated that the latter incident occurred well after the main storm phase and was probably due to technical failures. Nonetheless, the labelling of this geomagnetic storm as the "New York Railroad Storm" has remained, in view of the Brewster incident.
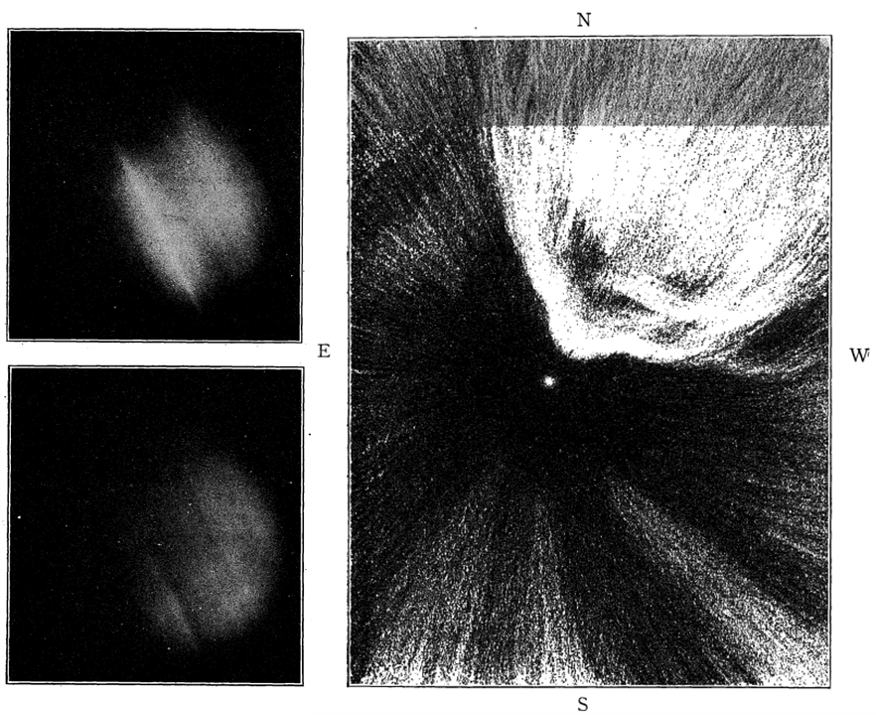
The polar lights were particularly bright, despite the first-quarter moon (Campbell, 1921). They were even seen from Samoa, which is only 14 degrees south of the Earth's equator, where intense red aurora were reported as high as 22 degrees in the sky (Hapgood, 2019). Other reports from southern locations were coming from Texas, Arizona, California, and Hawaii. In France, aurora were observed by Bernard Lyot and colleagues at Meudon. Three maxima of auroral intensity were reported (at 01:14, 02:10 and 03:05 GMT). The second maximum was most intense, obscuring some second magnitude stars and providing enough light to read watches and make notes. In New York, visitors from movie theatres returning home were treated on an encore performance by the night sky theatre, where aurora were so brilliant they easily outshone the Broadway lights. The two pictures below left were taken from the Lowell Observatory in Flagstaff, Arizona (!), USA and reported by Truman in the Popular Astronomy magazine (1921). The aurora were about 10 to 20 degrees above the northwestern horizon, the pictures bringing out very well the auroral streamers. The drawing on the right was made by L. J. Wilson from New York City (published in Popular Astronomy (1921), who commented that the shining auroral cloud was moving to Arcturus (the bright dot near the middle) from the northwest, and that it had colors of pale green and lavender.
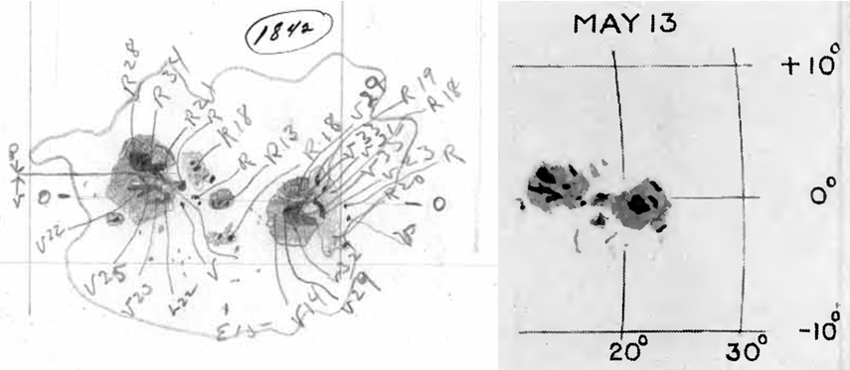
The source region of all this excitement was sunspot group Greenwich 933404, which rounded the Sun's east limb on 8 May. Its maximum area was reached on 11 May, and was about 10 times the total surface area of the Earth (see the Solar Cycle Science webpage), making it a large sunspot region, but not extremely so. Analysis of Mount Wilson drawings and magnetograms indicated that the sunspot group, here called Mount Wilson 1842, contained several magnetic delta's in its main portions. Delta's are spots of opposite magnetic polarity separated by less than 2 degrees and situated within the common penumbra. See the STCE Space Weather Classifications page for more information. These magnetic structures are known to increase the likelihood on very strong flares, which may be associated with solid coronal mass ejections. The figure above on the left is a Mount Wilson drawing of the group on 13 May, indicating the magnetic polarity and intensity of the sunspots. "V" means a direction of the magnetic field towards the Sun, "R" means away from the Sun, and the 2 numbers express the magnetic field strength in Gauss divided by 100. Typical values for sunspots are between 2600 and 2900 Gauss (Borrero et al., 2011). The drawing above on the right was made by projection with the 15-inch equatorial by the Rev. H. Macklin, S.J. from the Stonyhurst College Observatory on the same day (from Cortie, 1921).
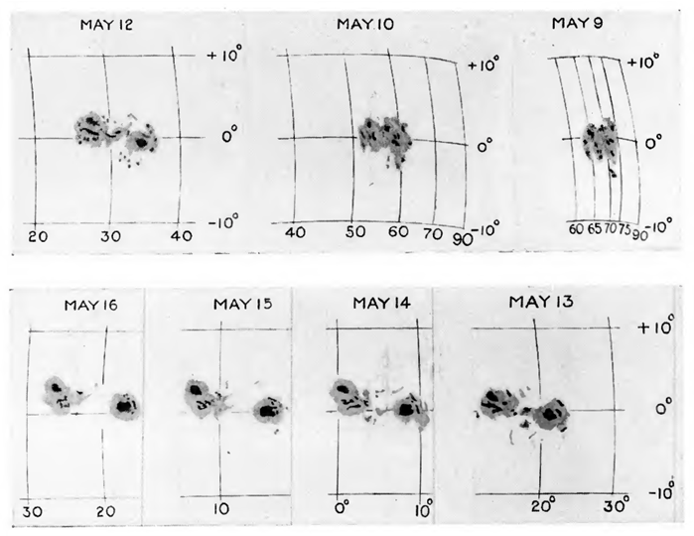
The drawings above illustrate the development and evolution of the sunspot group, for the period of 9 till 16 May 1921. They are accurate copies of the drawings made by the Rev. H. Macklin, S.J. from the Stonyhurst College Observatory (Cortie, 1921).
New load of SWx forecasters and operators
At the moment of writing, 4 people are doing the ultimate Space Weather Introductory Course Test. It is the final test after 4 days of being bombarded with space weather science and data.
Review of solar activity
NOAA Active Region (AR) 2822 (Catania sunspot group 93) produced three C-class flares. Following the flares, the region started decaying. NOAA AR 2823 (Catania sunspot group 94) produced only B-class flares and also decayed significantly.
A partial halo, front-sided, Coronal Mass Ejection (CME) was observed at 19:00UT 13 May by SOHO/LASCO C2. Based on LASCO C2, the speed of the CME is measured to be proximately 300 km/s, but this speed is a lower limit. The CME was not observed by STEREO-A/Cor2 which is better placed to estimate its speed.
A negative, equatorial coronal hole crossed the central meridian on 15 May. The coronal hole is small sized and patchy.
The greater than 10 MeV proton flux was at nominal levels.
The greater than 2 MeV electron flux remained below the 1000 pfu.
The 24-hour electron fluence was at nominal levels.
The International Sunspot Number by Silso
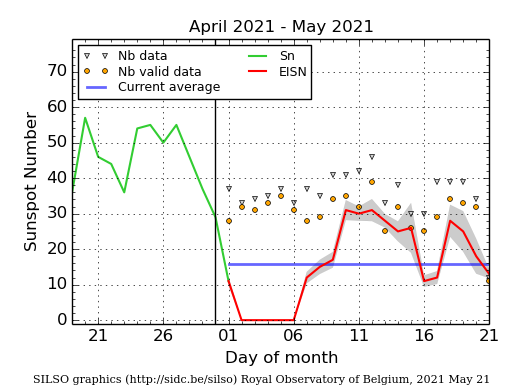
The daily Estimated International Sunspot Number (EISN, red curve with shaded error) derived by a simplified method from real-time data from the worldwide SILSO network. It extends the official Sunspot Number from the full processing of the preceding month (green line), a few days more than one solar rotation. The horizontal blue line shows the current monthly average. The yellow dots gives the number of stations that provided valid data. Valid data are used to calculate the EISN. The triangle gives the number of stations providing data. When a triangle and a yellow dot coincide, it means that all the data is used to calculate the EISN of that day.
Review of geomagnetic activity
The Earth was under the influence of the slow solar wind between 10 May and the morning of 12 May.
At 05:49 UT 12 May the Interplanetary Coronal Mass Ejection (ICME) caused by the CME of 10 May arrived as predicted.
It was headed by a fast forward shock and caused a speed jump from 320 to 430 km/s, a magnetic field rise from 5 to 22 nT, a density increase from 10 to 20 cm-3, and a temperature jump from 50.000 K to 250.000 K.
The ICME itself caused the speed to increase up to 500 km/s and the Bz component to fluctuate between -20 nT and 20 nT. The interplanetary magnetic field angle had positive values (directed away from the Sun) until 06:35UT 12 May and then started fluctuating, with mostly negative values.
The effects of the ICME to the solar wind parameters lasted approximately one day, after which the solar wind returned to a slow wind regime.
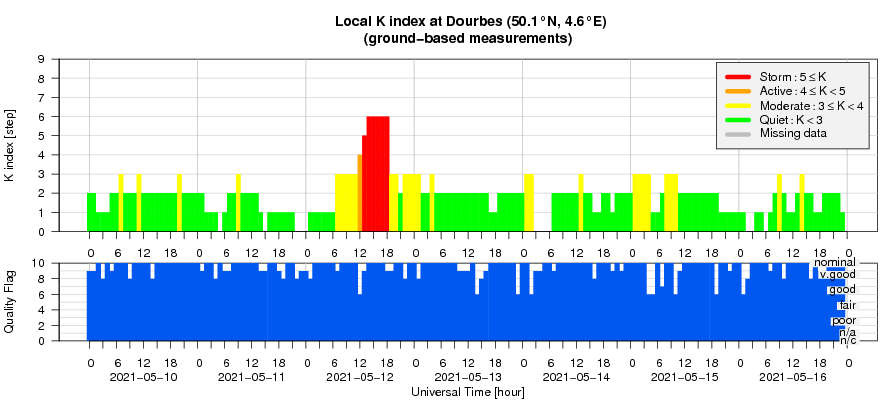
The geomagnetic conditions were quiet to unsettled (NOAA Kp and local K Dourbes 1-3) between 10 and 12 May.
The arrival of the ICME at 05:49 UT 12 May with southward magnetic orientation caused a geomagnetic storm with NOAA Kp 7 and local K Dourbes 6 between 1200-1800UT 12 May.
From 1800UT 12 May onward the conditions became again quiet to unsettled (NOAA Kp and local K Dourbes 1-3).
Geomagnetic Observations at Dourbes (10 May 2021 - 16 May 2021)
The SIDC Space Weather Briefing
The Space Weather Briefing presented by the forecaster on duty from May 9 to 16. It reflects in images and graphs what is written in the Solar and Geomagnetic Activity report.

A pdf-version: https://www.stce.be/briefings/20210517_SWbriefing.pdf
The movie: https://www.stce.be/briefings/20210517_SWbriefing.m4v
Review of ionospheric activity (10 May 2021 - 16 May 2021)
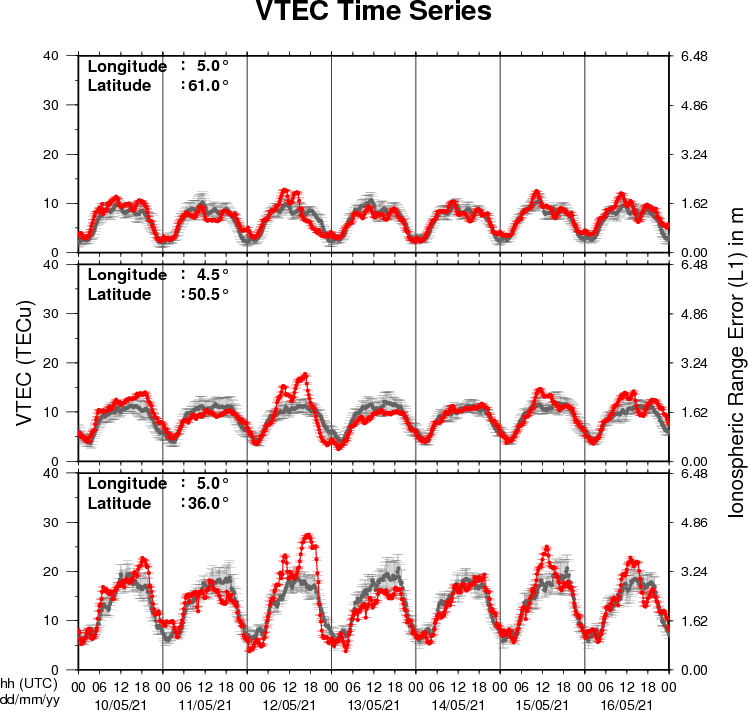
The figure shows the time evolution of the Vertical Total Electron Content (VTEC) (in red) during the last week at three locations:
a) in the northern part of Europe(N61°, 5°E)
b) above Brussels(N50.5°, 4.5°E)
c) in the southern part of Europe(N36°, 5°E)
This figure also shows (in grey) the normal ionospheric behaviour expected based on the median VTEC from the 15 previous days.
The VTEC is expressed in TECu (with TECu=10^16 electrons per square meter) and is directly related to the signal propagation delay due to the ionosphere (in figure: delay on GPS L1 frequency).
The Sun's radiation ionizes the Earth's upper atmosphere, the ionosphere, located from about 60km to 1000km above the Earth's surface.The ionization process in the ionosphere produces ions and free electrons. These electrons perturb the propagation of the GNSS (Global Navigation Satellite System) signals by inducing a so-called ionospheric delay.
See http://stce.be/newsletter/GNSS_final.pdf for some more explanations ; for detailed information, see http://gnss.be/ionosphere_tutorial.php