- Table of Content
- 1.Where's the su...
- 2.Review of sola...
- 3.The Internatio...
- 4.PROBA2 Observa...
- 5.Review of geom...
- 6.Geomagnetic Ob...
- 7.The SIDC Space...
- 8.Review of iono...
2. Review of solar activity
3. The International Sunspot Number by Silso
4. PROBA2 Observations (21 Jun 2021 - 27 Jun 2021)
5. Review of geomagnetic activity
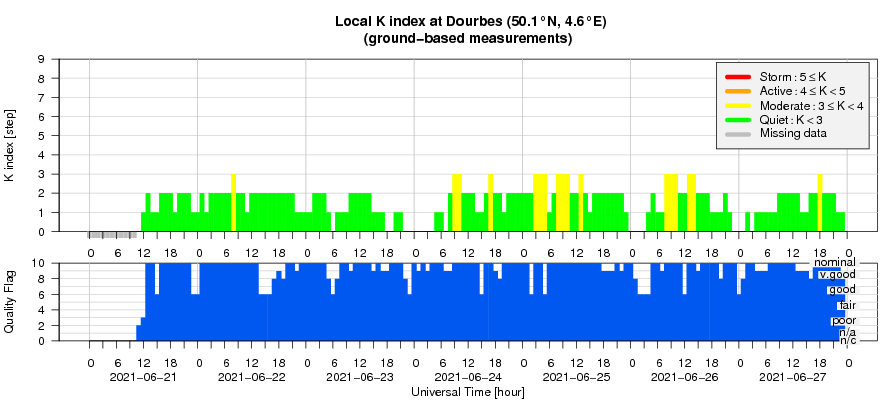
6. Geomagnetic Observations at Dourbes (21 Jun 2021 - 27 Jun 2021)
7. The SIDC Space Weather Briefing
8. Review of ionospheric activity (21 Jun 2021 - 27 Jun 2021)
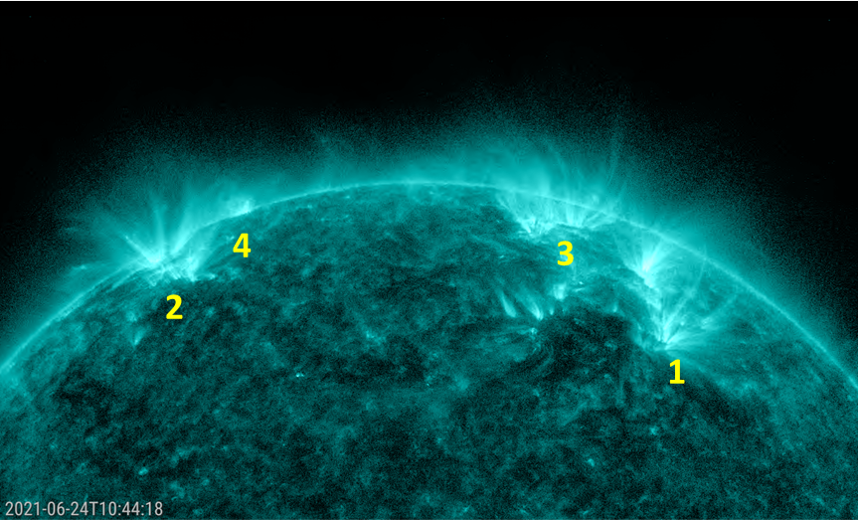
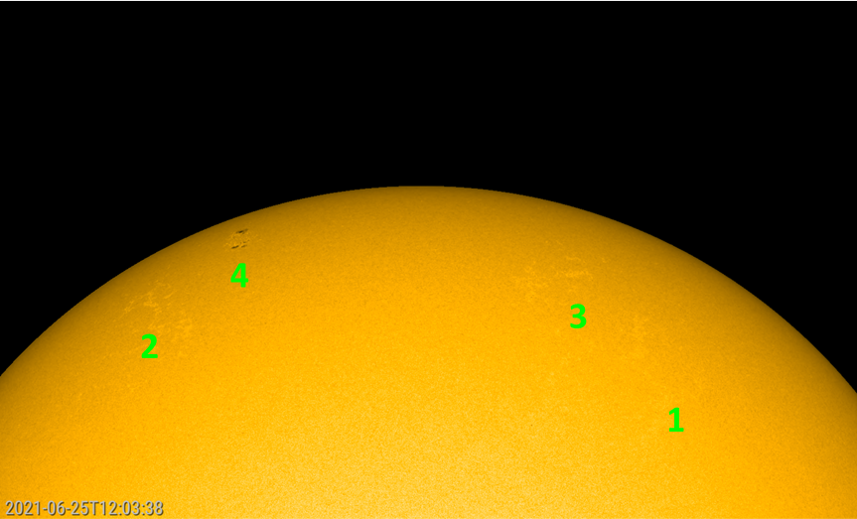
Where's the sunspot region?
From about 20 June onwards, extreme ultraviolet images (SDO/AIA - https://sdo.gsfc.nasa.gov/data/aiahmi/ ) showed several active regions approaching the Sun's east limb. They were characterized by dynamic large coronal loops, and one region even produced a C3 flare early on 23 June. This was region number 3 in the annotated images underneath, the regions being numbered here in order as they rounded the east limb. The images have been rotated 90 degrees clockwise, so with east to the top and north to the right. The activity raised hopes that several sunspot regions might soon round the east limb and become visible in white light (SDO/HMI). Alas, this was not the case. The active towering coronal loops were associated with large and bright faculae fields, devoid of any sunspots... except one (number 4 in the annotated images) which got numbered on 25 June (NOAA 2835). Faculae fields are areas of enhanced magnetic fields on the Sun. They can be the craddle for the development of new sunspots, and exist days to weeks after the sunspots have disappeared. Interestingly, while already on the visible solar disk, sunspots started to develop in active region 2 and got numbered as NOAA 2836 by the end of the week. The other two regions (numbers 1 and 3) remained spotless and so didn't get a number. Clips in EUV and white light of these regions can be found at the online version of this article at https://www.stce.be/news/538/welcome.html
Review of solar activity
Two active regions were observed on the side of the Sun facing Earth (NOAA AR 2833, 2835). The GOES satellite measured 2 C-class flare and numerous B-class flares. The largest reported flare was a C3.4 flare observed on June 22 which originated from the plage region located on the north western part of the solar disk and close to the solar limb at that time.
No Earth directed Coronal Mass Ejections (CMEs) have been observed in coronagraph data.
The greater than 2MeV electron flux dropped bellow the 1000 pfu threshold on June 22, when the 24h electron fluence decreased to normal levels as well.
The International Sunspot Number by Silso
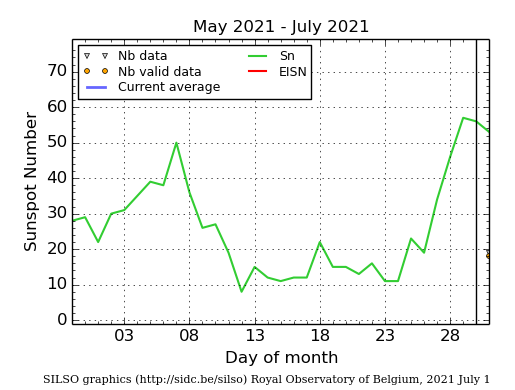
The daily Estimated International Sunspot Number (EISN, red curve with shaded error) derived by a simplified method from real-time data from the worldwide SILSO network. It extends the official Sunspot Number from the full processing of the preceding month (green line), a few days more than one solar rotation. The horizontal blue line shows the current monthly average. The yellow dots gives the number of stations that provided valid data. Valid data are used to calculate the EISN. The triangle gives the number of stations providing data. When a triangle and a yellow dot coincide, it means that all the data is used to calculate the EISN of that day.
PROBA2 Observations (21 Jun 2021 - 27 Jun 2021)
Solar Activity
Solar flare activity fluctuated between very low to low during the week.
In order to view the activity of this week in more detail, we suggest to go to the following website from which all the daily (normal and difference) movies can be accessed: https://proba2.oma.be/ssa
This page also lists the recorded flaring events.
A weekly overview movie can be found here (SWAP week 587): https://proba2.sidc.be/swap/data/mpg/movies/weekly_movies/weekly_movie_2021_06_21.mp4
Details about some of this week's events can be found further below.
If any of the linked movies are unavailable they can be found in the P2SC movie repository here: https://proba2.oma.be/swap/data/mpg/movies/
Wednesday Jun 23
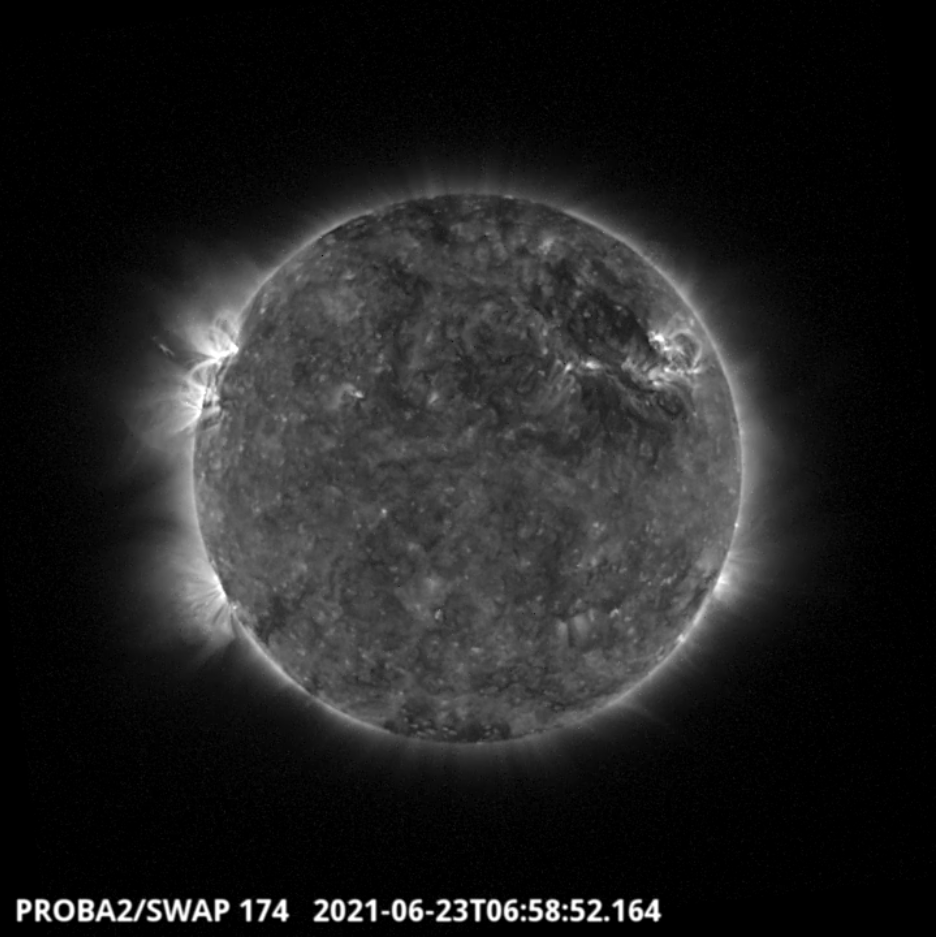
The largest flare of the week, a C3.4 flare, was observed by SWAP and LYRA on 2021-Jun-23. The flare and associated eruption is visible on the north-east limb of the solar disk, as shown in the SWAP image above taken at 06:58 UT.
Find a movie of the event here (SWAP movie): https://proba2.sidc.be/swap/movies/20210623_swap_movie.mp4
Review of geomagnetic activity
In situ (L1) observations show the passage of three magnetic structures, possibly two ICMEs (June 20 and June 22)and one magnetic cloud (June 24 20:00UT). The impact of the June 20 and 22 magnetic structures was small, leading to a slight increases of the solar wind temperature and density, and a drop of the speed. The magnetic field strength was slightly increased (reaching just under 9 nT on June 22) and the Bz component dropped to -7 nT. During both passages, the phi angle switched positive for a few hours.
The effects of the magnetic cloud were more prevalent with Bz going down to -10 nT. The phi angle switched positive for a few hours, but other plasma parameters (density, temperature and the solar wind speed) did not show any change.
Early June 25, a drop in solar wind density and increase of solar wind speed values indicated the high speed stream expected from the two coronal holes that crossed central meridian June 20. Another northern positive polarity coronal hole crossed central meridian June 27.
The geomagnetic conditions were quiet.
Geomagnetic Observations at Dourbes (21 Jun 2021 - 27 Jun 2021)
The SIDC Space Weather Briefing
The Space Weather Briefing presented by the forecaster on duty from June 20 to 27. It reflects in images and graphs what is written in the Solar and Geomagnetic Activity report.

A pdf-version: https://www.stce.be/briefings/20210628_SWbriefing.pdf
The movie: https://www.stce.be/briefings/20210628_SWbriefing.m4v
Review of ionospheric activity (21 Jun 2021 - 27 Jun 2021)
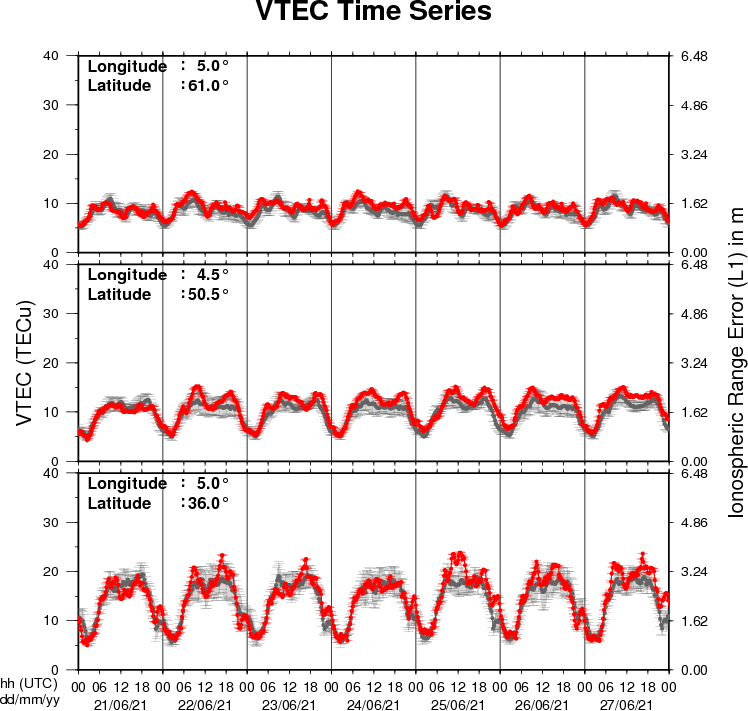
The figure shows the time evolution of the Vertical Total Electron Content (VTEC) (in red) during the last week at three locations:
a) in the northern part of Europe(N61°, 5°E)
b) above Brussels(N50.5°, 4.5°E)
c) in the southern part of Europe(N36°, 5°E)
This figure also shows (in grey) the normal ionospheric behaviour expected based on the median VTEC from the 15 previous days.
The VTEC is expressed in TECu (with TECu=10^16 electrons per square meter) and is directly related to the signal propagation delay due to the ionosphere (in figure: delay on GPS L1 frequency).
The Sun's radiation ionizes the Earth's upper atmosphere, the ionosphere, located from about 60km to 1000km above the Earth's surface.The ionization process in the ionosphere produces ions and free electrons. These electrons perturb the propagation of the GNSS (Global Navigation Satellite System) signals by inducing a so-called ionospheric delay.
See http://stce.be/newsletter/GNSS_final.pdf for some more explanations ; for detailed information, see http://gnss.be/ionosphere_tutorial.php