- Table of Content
- 1.On farside act...
- 2.Review of sola...
- 3.PROBA2 Observa...
- 4.The Internatio...
- 5.Review of geom...
- 6.Geomagnetic Ob...
- 7.The SIDC Space...
- 8.Review of iono...
2. Review of solar activity
3. PROBA2 Observations (12 Jul 2021 - 18 Jul 2021)
4. The International Sunspot Number by Silso
5. Review of geomagnetic activity
6. Geomagnetic Observations at Dourbes (12 Jul 2021 - 18 Jul 2021)
7. The SIDC Space Weather Briefing
8. Review of ionospheric activity (12 Jul 2021 - 18 Jul 2021)
On farside activity and proton fluxes
Last week, subscribers to the alert messages issued by the SIDC/RWC (https://wwwbis.sidc.be/registration/registration_main.php ) were surprized to receive several alerts on halo or partial halo coronal mass ejections (CMEs) as detected by the CACTus software (https://wwwbis.sidc.be/cactus/ ). Two halo CMEs visible in SOHO/LASCO C2 coronagraphic imagery (https://sohowww.nascom.nasa.gov/ ) on 13 and 15 July seemed especially threatening, having speeds estimated to be between 1000 and 1500 km/s. Fortunately, analysis by the SIDC space weather forecaster on duty quickly revealed these CMEs had their origin on the Sun's farside, and were not directed to Earth.
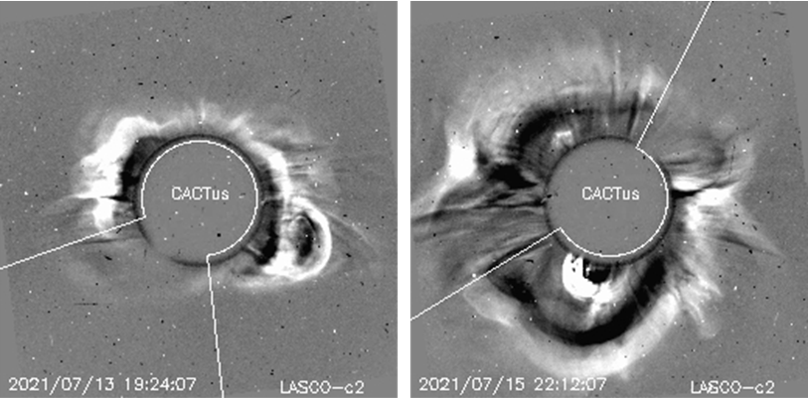
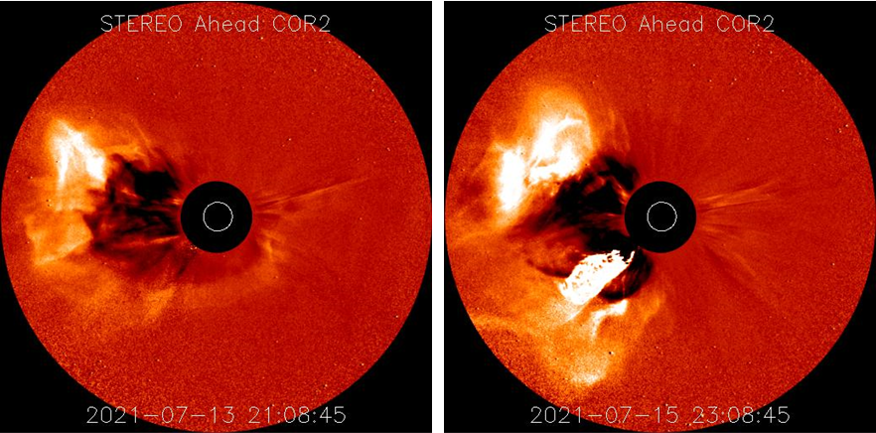
These CMEs were just 2 events in a long series of CMEs detected by CACTus (see the STCE's Acronym list at https://www.stce.be/educational/acronym ) that started on 3 July when the active sunspot region NOAA 2838 produced an X-class flare and rounded the Sun's northwest limb a day later (see this STCE Newsitem at https://www.stce.be/news/539/welcome.html ). Though we don't have a satellite keeping an extreme ultraviolet (EUV) eye on that side of the Sun, imagery by STEREO-A/EUVI -currently trailing the Earth by about 45 degrees- revealed some stirring in the corona over the northeast limb between 18 and 19 UT on 13 July, making NOAA 2838 the likely source of this eruption. The CME of 13 July clearly had a main component towards the northeast (see imagery underneath). NOAA 2838 returned as the not very impressive sunspot group NOAA 2846 on 19 July.
Activity then gradually seemed to move to regions in the southern solar hemisphere, and the CME from 15 July originated indeed from a region near the southeast limb. This CME was quite spectacular, with a solid core filament ejected mainly towards the south. The source region may be NOAA 2835 or one or more regions that have developed close-by. NOAA 2835 was a rather big but mostly inactive sunspot region, producing only some low-level C-class flares while transiting the solar disk from 25 June till 6 July. As the entire active area is only now (20 July) starting to round the southeast solar limb, it's still a bit too soon to say anything about the sunspot group(s).
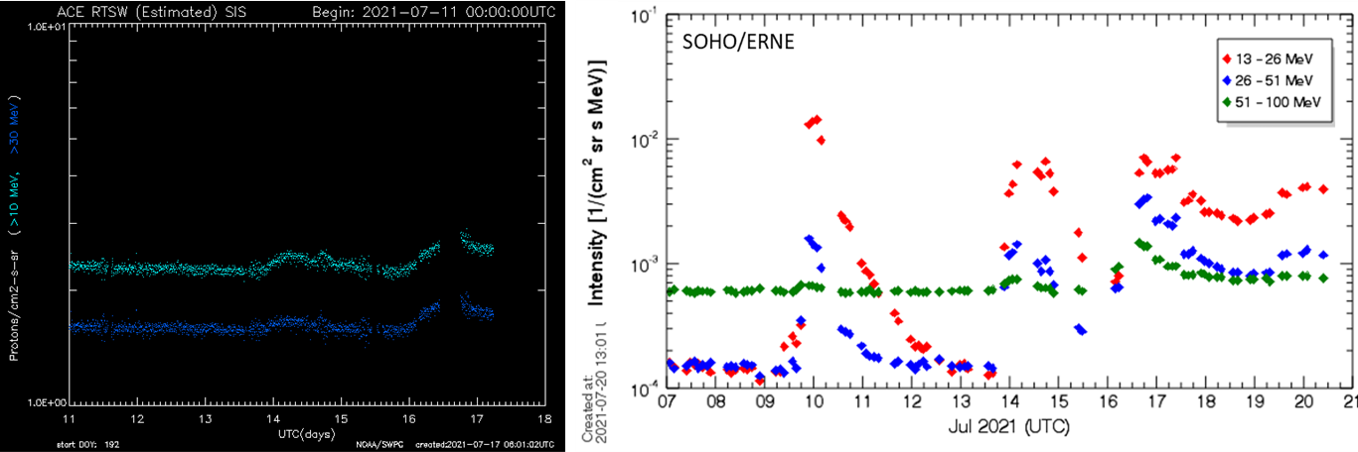
With all these CMEs originating on the farside of the Sun, one would be tempted to expect that the earth environment would remain unaffected. However, instruments recording the proton flux levels at the L1 point (first Lagrangian point, about 1.5 million km from the Earth in the direction of the Sun) such as the ERNE instrument on board SOHO https://srl.utu.fi/erne_data/nrt/proton_spec.html and the SIS instrument on board ACE (https://www.swpc.noaa.gov/products/ace-real-time-solar-wind ), showed a different picture. Obvious increases recorded on 14 July and on 16-17 July correspond to the farside activity on 13 and 15 July as discussed above. The GOES proton flux shows barely any increase at all.
Proton events usually originate from an erupting source on the western solar hemisphere as seen from Earth, because the Sun's magnetic field lines are much better connected from there to the Earth environment (Parker's spiral). However, it is well known that proton events and enhancements can originate from the Sun's farside too. Typical examples are the 23 July 2012 event (https://www.stce.be/news/152/welcome.html ) and the 1 September 2014 proton enhancement (https://www.stce.be/news/266/welcome.html ). The exact mechanism behind this is not entirely understood yet.
Review of solar activity
Solar activity was at low levels with two C-class flares detected on 15 July. Five Active Regions (AR) on the side of the Sun facing Earth were present over the course of the week. NOAA AR 2841, 2842, and 2844 were pre-existing and decayed throughout the week, having exhausted their C-class flare producing ability during the week of 5-11 July. NOAA AR 2843 and 2845 emerged during the week of 12-18 July, and NOAA AR 2843 became complex enough to produce the only two C-class flares of the week.
An Earth-directed Corona Mass Ejection (CME) was observed by LASCO-C2/SOHO on 17-July. It is expected to reach Earth around 20 July.
The greater than 10 MeV proton flux was at nominal levels. The greater than 2 MeV electron flux remained below the 1000 pfu alert threshold and the 24h electron fluence was at nominal levels.
PROBA2 Observations (12 Jul 2021 - 18 Jul 2021)
Solar Activity
Solar flare activity fluctuated between very low to low during the week.
In order to view the activity of this week in more detail, we suggest to go to the following website from which all the daily (normal and difference) movies can be accessed: https://proba2.oma.be/ssa
This page also lists the recorded flaring events.
A weekly overview movie can be found here (SWAP week 590): https://proba2.sidc.be/swap/data/mpg/movies/weekly_movies/weekly_movie_2021_07_12.mp4
Details about some of this week's events can be found further below.
If any of the linked movies are unavailable they can be found in the P2SC movie repository here: https://proba2.oma.be/swap/data/mpg/movies/
Friday Jul 16
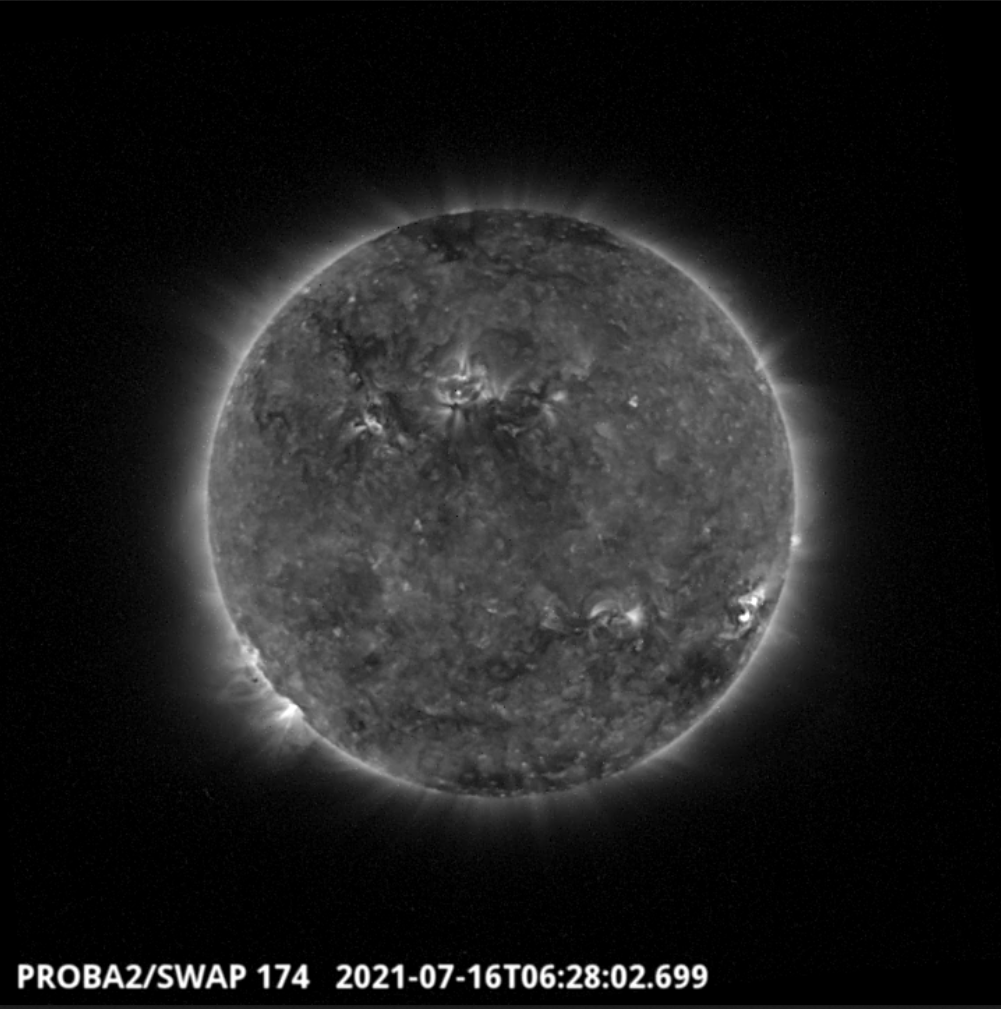
An eruption was observed by SWAP in the south-east limb of the solar disk on 2021-Jul-16, as shown in the SWAP image above taken at 06:28 UT.
Find a movie of the entire day here (SWAP movie): https://proba2.sidc.be/swap/movies/20210716_swap_movie.mp4
The International Sunspot Number by Silso
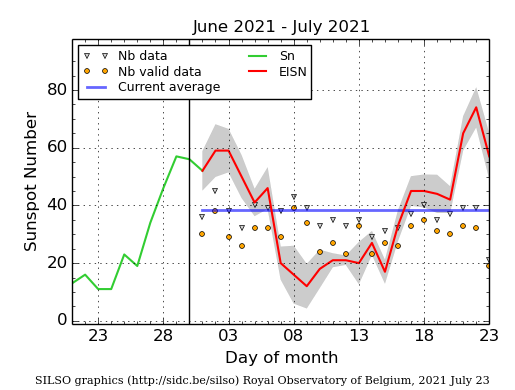
The daily Estimated International Sunspot Number (EISN, red curve with shaded error) derived by a simplified method from real-time data from the worldwide SILSO network. It extends the official Sunspot Number from the full processing of the preceding month (green line), a few days more than one solar rotation. The horizontal blue line shows the current monthly average. The yellow dots gives the number of stations that provided valid data. Valid data are used to calculate the EISN. The triangle gives the number of stations providing data. When a triangle and a yellow dot coincide, it means that all the data is used to calculate the EISN of that day.
Review of geomagnetic activity
The Earth was under the influence of the slow solar wind for the majority of the week. A very weak High Speed Stream (HSS) arrived at 09:00UT July 14 and had a minor effect on the solar wind for about one day. The solar wind speed was 350 km/s at the start of the week, increased to 490 km/s as a result of the HSS, and then dropped as low as 340 km/s towards the end of the week. The magnetic field varied between 1 and 13 nT, while the Bz varied between -12 and 7 nT. The interplanetary magnetic field phi angle was predominantly in the negative sector (directed towards from the Sun).
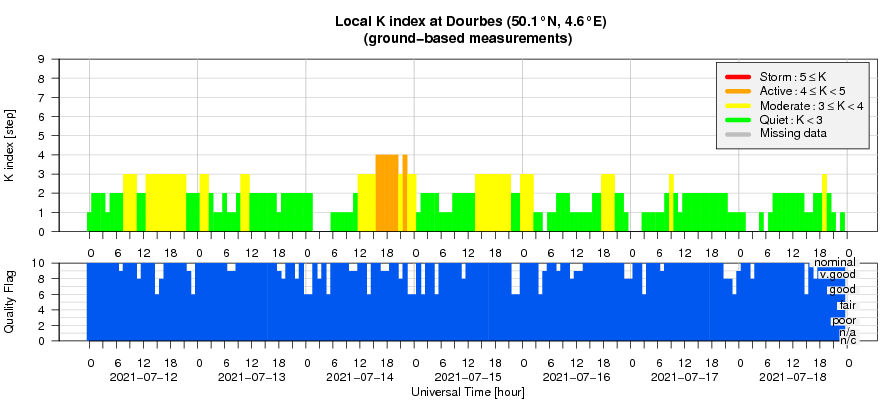
The geomagnetic conditions were quiet, except for July 14 were the planetary and local K index became 4.
Geomagnetic Observations at Dourbes (12 Jul 2021 - 18 Jul 2021)
The SIDC Space Weather Briefing
The Space Weather Briefing presented by the forecaster on duty from July 11 to 18. It reflects in images and graphs what is written in the Solar and Geomagnetic Activity report.
A pdf-version: https://www.stce.be/briefings/20210719_SWbriefing.pdf
The movie: https://www.stce.be/briefings/20210719_SWbriefing.m4v
Review of ionospheric activity (12 Jul 2021 - 18 Jul 2021)

The figure shows the time evolution of the Vertical Total Electron Content (VTEC) (in red) during the last week at three locations:
a) in the northern part of Europe(N61°, 5°E)
b) above Brussels(N50.5°, 4.5°E)
c) in the southern part of Europe(N36°, 5°E)
This figure also shows (in grey) the normal ionospheric behaviour expected based on the median VTEC from the 15 previous days.
The VTEC is expressed in TECu (with TECu=10^16 electrons per square meter) and is directly related to the signal propagation delay due to the ionosphere (in figure: delay on GPS L1 frequency).
The Sun's radiation ionizes the Earth's upper atmosphere, the ionosphere, located from about 60km to 1000km above the Earth's surface.The ionization process in the ionosphere produces ions and free electrons. These electrons perturb the propagation of the GNSS (Global Navigation Satellite System) signals by inducing a so-called ionospheric delay.
See http://stce.be/newsletter/GNSS_final.pdf for some more explanations ; for detailed information, see http://gnss.be/ionosphere_tutorial.php