- Table of Content
- 1.High-latitude ...
- 2.Review of sola...
- 3.PROBA2 Observa...
- 4.The Internatio...
- 5.Review of geom...
- 6.Geomagnetic Ob...
- 7.The SIDC Space...
- 8.Review of iono...
2. Review of solar activity
3. PROBA2 Observations (19 Jul 2021 - 25 Jul 2021)
4. The International Sunspot Number by Silso
5. Review of geomagnetic activity
6. Geomagnetic Observations at Dourbes (19 Jul 2021 - 25 Jul 2021)
7. The SIDC Space Weather Briefing
8. Review of ionospheric activity (19 Jul 2021 - 25 Jul 2021)
High-latitude sunspot group
From 16 till 18 July, a sunspot was visible near the southeast solar limb at the very high southern latitude of -43 degrees. NOAA 2844 was a quiet and magnetically simple region, and the first region of the new solar cycle 25 of which the latitude exceeded 40 degrees. In the SDO/HMI image dated 17 July (08:30UT) underneath, the position of the small speck is indicated by the red arrow. The previous sunspot group with such a high latitude (+42 degrees) was NOAA 11069 in May 2010, which produced even an M-class flare (see the STCE annual highlights compilation at https://www.stce.be/news/354/welcome.html )

After the sunspot had decayed, the active region continued to transit the solar disk as a spotless faculae field. This is visible in the SDO/HMI images (https://sdo.gsfc.nasa.gov/data/aiahmi/ ) underneath dating from 17, 22 and 26 July, with the faculae field visible as an area that is somewhat brighter than the surrounding solar surface. This is indicative of the presence of enhanced magnetic fields, but not strong enough (anymore) to support a sunspot.

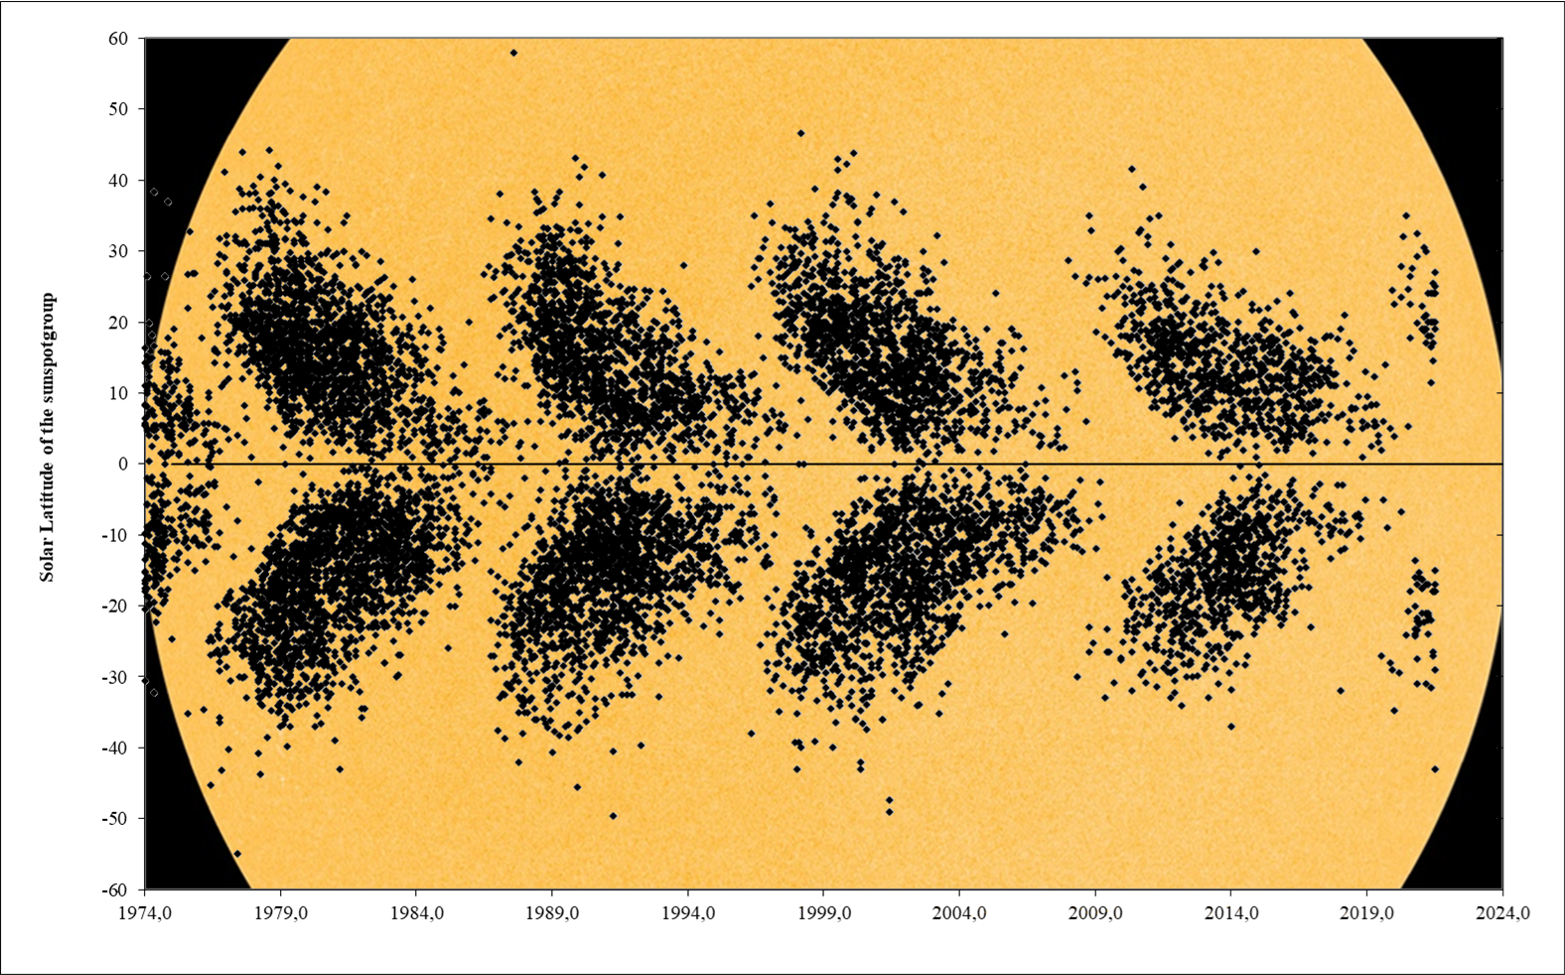
Most sunspot groups appear in the main zone, i.e. a belt from 30 degrees north to 30 degrees south of the solar equator. Sunspot groups with latitudes in excess of 40 degrees are very rare. Since 1976, about 12.000 sunspot groups have been numbered by NOAA, but only 35 groups reached latitudes over 40 degrees. Sunspot regions with latitudes of more than 50 degrees are even rarer, with only 2 such regions observed since 1976: one in June 1977 (NOAA 831 at -55 degrees), and the other one in August 1987 (NOAA 4838 at +58 degrees). These outliers can be seen in the Butterfly diagram underneath (1974-present) showing per month the latitude of each sunspot group (see the STCE Newsitem at https://www.stce.be/news/522/welcome.html for more info on these diagrams).
Review of solar activity
Over the past week, the solar activity varied between very low and low levels. The week started with two C1 flares from behind the east solar limb on July 19th. There were in total seven active regions on the visible solar disk (NOAA 2842 and NOAA 2844-2849), which produced five C-class flares. The most active sunspot group was NOAA 2849 which was responsible for three of these C-class flares, the C4.3 flare on July 23rd being the strongest event of the week. NOAA 2845 produced a single C1 flare on July 21st. The most complex active region was NOAA 2842, which developed into magnetic type beta-gamma soon before its rotation over the west limb and produced a single C1 flare on July 24th. The rest of the active regions exhibited very low levels of activity over the entire week.
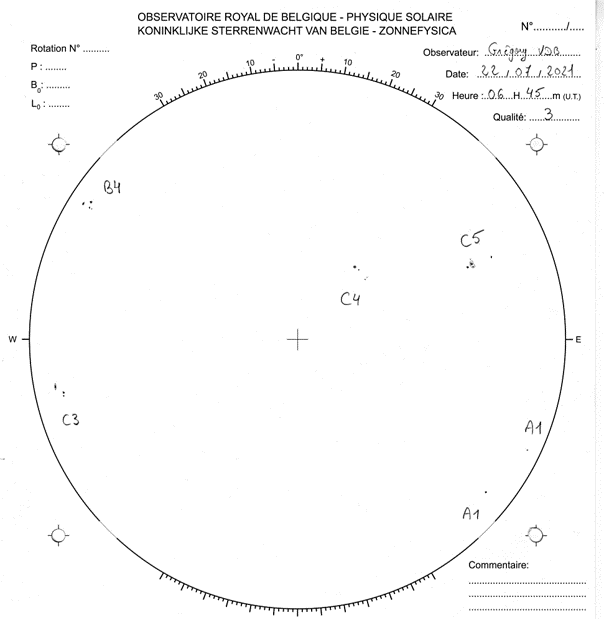
The drawing below from the Uccle Solar Equatorial Table (http://www.sidc.be/uset/ ) shows 6 sunspot groups visible on 22 July. West is to the left, so NOAA 2842 is to the upper left, NOAA 2846 is to the upper right, and NOAA 2849 is the tiny speck to lower right near the limb.
Throughout the week there were several on disk flare-driven Coronal Mass Ejections (CMEs) with prominent coronal dimming and coronal waves, but none of them were estimated to have Earth-directed component. No other Earth-directed CMEs were detected in the available coronagraph imagery and no Interplanetary CMEs (ICMEs) were observed in the available solar wind data.
The greater than 10 MeV proton flux remained at background levels over the entire week. The greater than 2 MeV electron flux remained under the 1000 pfu threshold and the electron fluence was at nominal levels for the entire week.
PROBA2 Observations (19 Jul 2021 - 25 Jul 2021)
Solar Activity
Solar flare activity fluctuated from very low to low during the week.
In order to view the activity of this week in more detail, we suggest to go to the following website from which all the daily (normal and difference) movies can be accessed: https://proba2.oma.be/ssa
This page also lists the recorded flaring events.
A weekly overview movie can be found here (SWAP week 591): https://proba2.sidc.be/swap/data/mpg/movies/weekly_movies/weekly_movie_2021_07_19.mp4
Details about some of this week’s events can be found further below.
If any of the linked movies are unavailable they can be found in the P2SC movie repository here: https://proba2.oma.be/swap/data/mpg/movies/
Saturday Jul 24
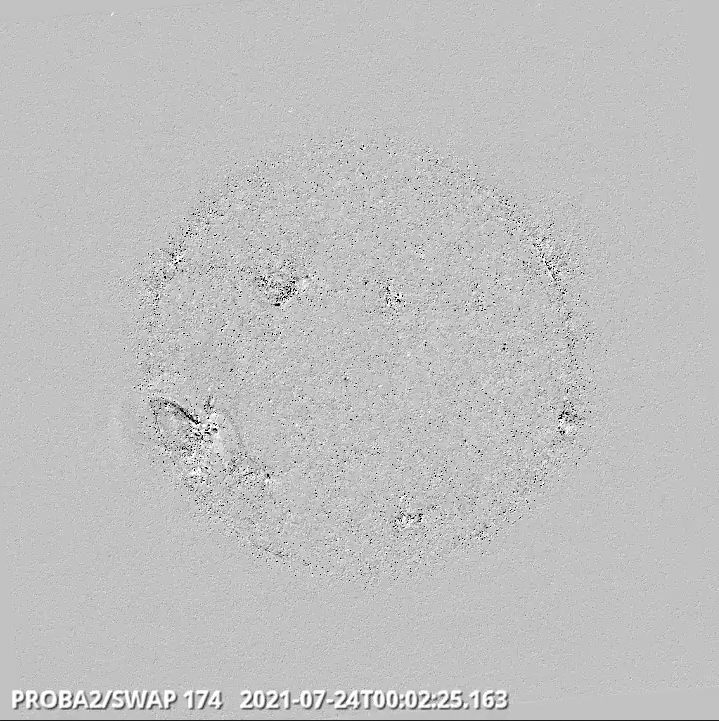
An eruption associated to a C4.3 flare was observed by SWAP in the south-east limb of the solar disk on 2021-Jul-24, as shown in the SWAP difference image above taken at 00:02 UT.
Find a movie of the entire day here (SWAP movie): https://proba2.sidc.be/swap/data/mpg/movies/20210724_swap_movie.mp4
The International Sunspot Number by Silso
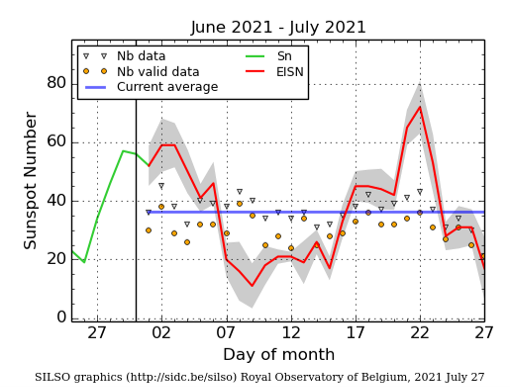
The daily Estimated International Sunspot Number (EISN, red curve with shaded error) derived by a simplified method from real-time data from the worldwide SILSO network. It extends the official Sunspot Number from the full processing of the preceding month (green line), a few days more than one solar rotation. The horizontal blue line shows the current monthly average. The yellow dots gives the number of stations that provided valid data. Valid data are used to calculate the EISN. The triangle gives the number of stations providing data. When a triangle and a yellow dot coincide, it means that all the data is used to calculate the EISN of that day.
Review of geomagnetic activity
The solar wind parameters (based on DSCOVR and ACE data) throughout the week reflected minor enhancements due to the arrival of high speed stream (HSS) from a rather small positive-polarity equatorial coronal hole (CH), which crossed the central meridian on July 17th. The main effect of the HSS associated with this CH was registered in the period of July 19th to July 23rd and has subsided since. The solar wind conditions were most elevated on July 20th and July 21st registering moderate solar wind speeds above 500km/s. The total magnetic field was rather weak throughout the entire week, in the range of 0.9 nT to 7.7 nT. The minimum recorded Bz component was -7.4 nT.
The geomagnetic conditions were mostly quiet to unsettled throughout the week, mainly under the mild influence of the HSS. Two active intervals were recorded in the Kp index right before noon on July 22nd, with only a single geomagnetically active episode registered locally in Dourbes during the 06-09UT interval.
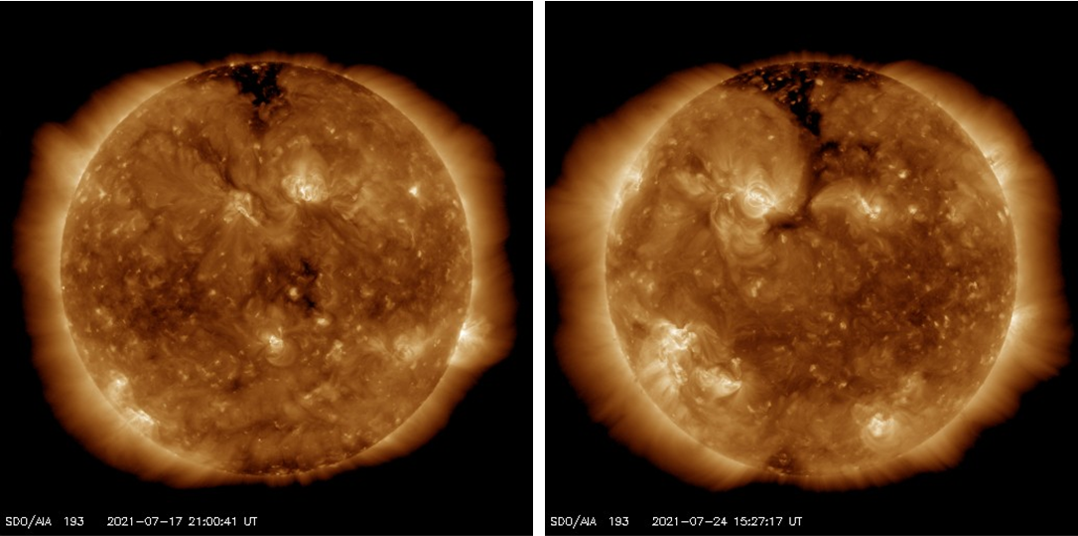
The SDO/AIA 193 images above show the Sun in Extreme Ultraviolet and highlight the extensions of the positive polarity northern polar CH on July 17th (left) and 24th (right).
Geomagnetic Observations at Dourbes (19 Jul 2021 - 25 Jul 2021)

The SIDC Space Weather Briefing
The Space Weather Briefing presented by the forecaster on duty from July 19 to 25. It reflects in images and graphs what is written in the Solar and Geomagnetic Activity reports.

A pdf-version: https://www.stce.be/briefings/20210726_SWbriefing.pdf
The movie: https://www.stce.be/briefings/20210726_SWbriefing.wmv
Review of ionospheric activity (19 Jul 2021 - 25 Jul 2021)

The figure shows the time evolution of the Vertical Total Electron Content (VTEC) (in red) during the last week at three locations:
a) in the northern part of Europe(N61°, 5°E)
b) above Brussels(N50.5°, 4.5°E)
c) in the southern part of Europe(N36°, 5°E)
This figure also shows (in grey) the normal ionospheric behaviour expected based on the median VTEC from the 15 previous days.
The VTEC is expressed in TECu (with TECu=10^16 electrons per square meter) and is directly related to the signal propagation delay due to the ionosphere (in figure: delay on GPS L1 frequency).
The Sun's radiation ionizes the Earth's upper atmosphere, the ionosphere, located from about 60km to 1000km above the Earth's surface.The ionization process in the ionosphere produces ions and free electrons. These electrons perturb the propagation of the GNSS (Global Navigation Satellite System) signals by inducing a so-called ionospheric delay.
See http://stce.be/newsletter/GNSS_final.pdf for some more explanations ; for detailed information, see http://gnss.be/ionosphere_tutorial.php