- Table of Content
- 1.Triumph of the...
- 2.Review of sola...
- 3.PROBA2 Observa...
- 4.The Internatio...
- 5.Review of geom...
- 6.Geomagnetic Ob...
- 7.The SIDC Space...
- 8.Review of iono...
2. Review of solar activity
3. PROBA2 Observations (26 Jul 2021 - 1 Aug 2021)
4. The International Sunspot Number by SILSO
5. Review of geomagnetic activity
6. Geomagnetic Observations at Dourbes (26 Jul 2021 - 1 Aug 2021)
7. The SIDC Space Weather Briefing
8. Review of ionospheric activity (26 Jul 2021 - 1 Aug 2021)
Triumph of the coronal dimmings
Coronal dimmings are often observed in response to solar eruptive events, and are visible in extreme ultraviolet (EUV) imagery of the solar corona as temporary dark voids. They were first observed in Skylab (1970s) and Yohkoh (1990s) data and called transient coronal holes, because of the close resemblance to coronal holes but with much shorter lifetimes. Further studies with the Extreme-ultraviolet Imaging Telescope (EIT) on board the Solar and Heliospheric Observatory (SoHO) revealed their close association to the source of coronal mass ejections (CMEs), and have established that these (EUV) dimmings are a good indicator of the apparent base of the white light CME. Thus, dimmings are usually interpreted as mass depletions due to the loss or rapid expansion of the overlying corona.
Extended statistical studies have found that CMEs also occur without dimmings, and that coronal dimmings are more likely to occur near active regions. They typically show a rapid decrease in emission (darkening) followed by a more gradual recovery lasting from 3 to 12 hours and rarely persisting longer than one day - in contrast to true coronal holes which tend to persist for many days. (See Mason et al. 2014 - https://iopscience.iop.org/article/10.1088/0004-637X/789/1/61 )
Because of their close association with CMEs, coronal dimmings are of particular interest for the space weather community. Indeed, because earth-directed CMEs may result in geomagnetic storms which in turn can adversely affect ground- and space based technology, understanding CMEs and improving predictions for CME properties are important for space weather. Hence, improving our comprehension of coronal dimmings may finetune our prediction accuracy in CME arrival times and impact.
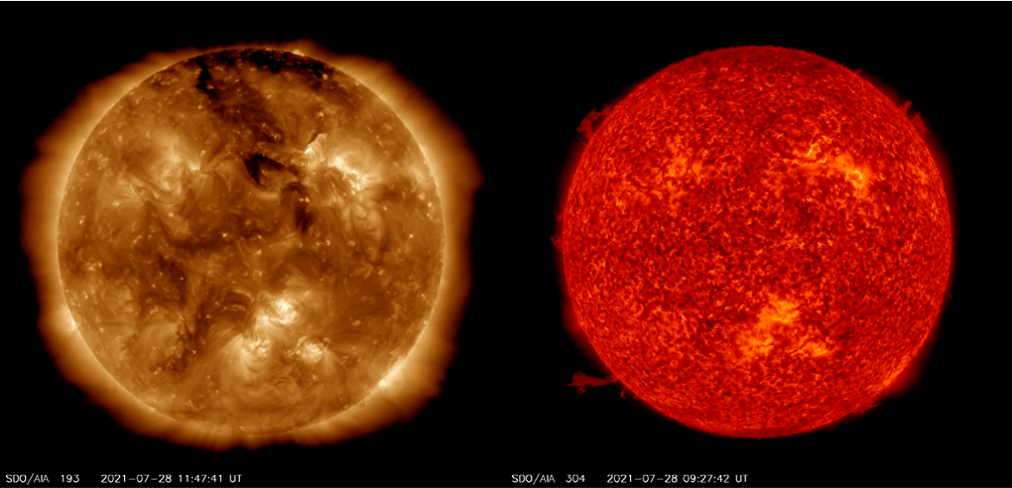
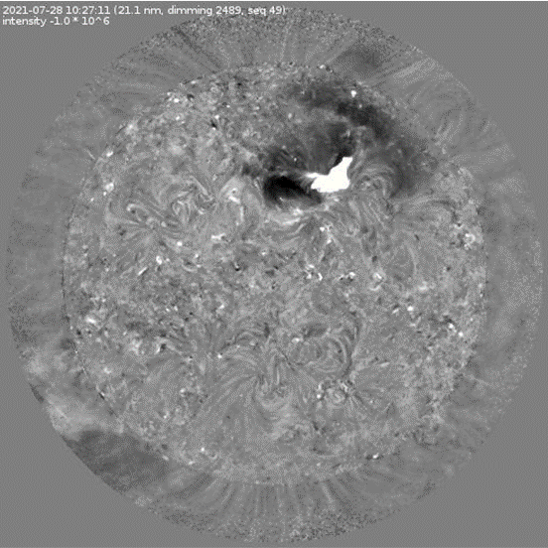
Last week, several coronal dimmings of various sizes were observed in EUV imagery made by the SDO/AIA instrument (https://sdo.gsfc.nasa.gov/data/aiahmi/ ). They were all associated with filament eruptions. The largest of these coronal dimmings took place on 28 July and is shown above, displaying on the left AIA 193 (temperature of about 1.2 million degrees) and on the right AIA 304 (temperature around 80.000 degrees). Just as AIA 211 (at a slightly higher temperature of about 2 million degrees), the AIA 193 passband is particularly well suited for identifying coronal holes and coronal dimmings. The AIA 304 filter captures much better filaments and filament eruptions (prominences and prominence eruptions near the solar limb). Because coronal dimmings are not always easily discernible, STCE scientists developed a tool called "Solar Demon" (https://wwwbis.sidc.be/solardemon/dimmings.php ) a few years ago to automatically detect -amongst other solar features- coronal dimmings in AIA 211 imagery. To this purpose, difference images (one image subtracted from the next, but also compared to the base image) are used. These images are corrected for the solar rotation, with the complete methodology described in Kraaikamp and Verbeeck (2015 - https://www.swsc-journal.org/articles/swsc/abs/2015/01/swsc140062/swsc140062.html ). The result is the imagery underneath (based on the same 28 July event), leaving no doubt on the location and extent of the coronal dimming.
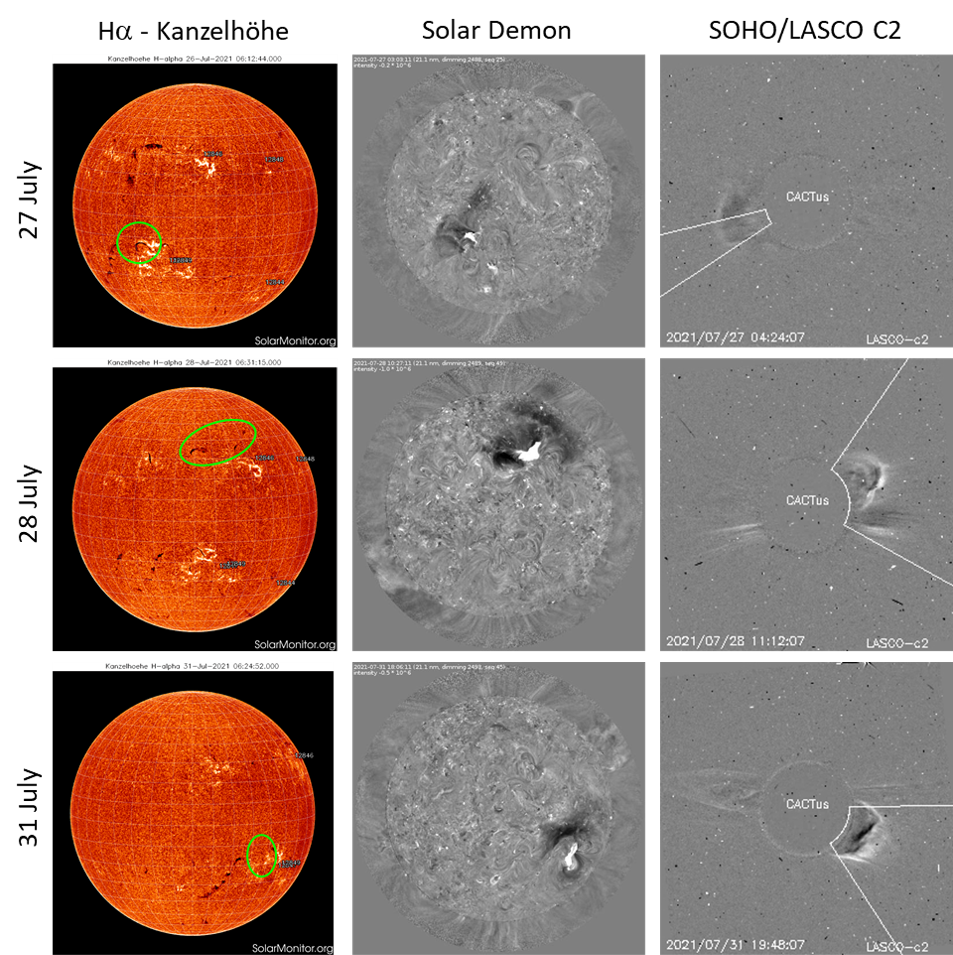
Last week's coronal dimmings were associated with filament eruptions. Underneath the 3 most spectacular events, resp. from 27, 28 and 31 July. The images in the left column are H-alpha images from the Kanzelhöhe Observatory (via https://solarmonitor.org/ ), with the concerned filaments highlighted within a green circle. In the middle are the related coronal dimmings following the filament eruptions, as deduced via Solar Demon from the SDO/AIA 211 images. On the right are the associated CMEs as detected by the CACTus software (https://wwwbis.sidc.be/cactus/ ) in SoHO's LASCO C2 coronagraphic imagery (https://sohowww.nascom.nasa.gov/ ). The related CMEs were relatively faint and had speeds of 300-400 km/s, and the 27 and 28 July events were thought to potentially have an earth-directed component. However, so far it seems only the 28 July CME has influenced the geomagnetic field according to the latest solar wind data, but the impact was strong enough to create a minor geomagnetic storm (estimated Kp of 5) late on 2 August.
Review of solar activity
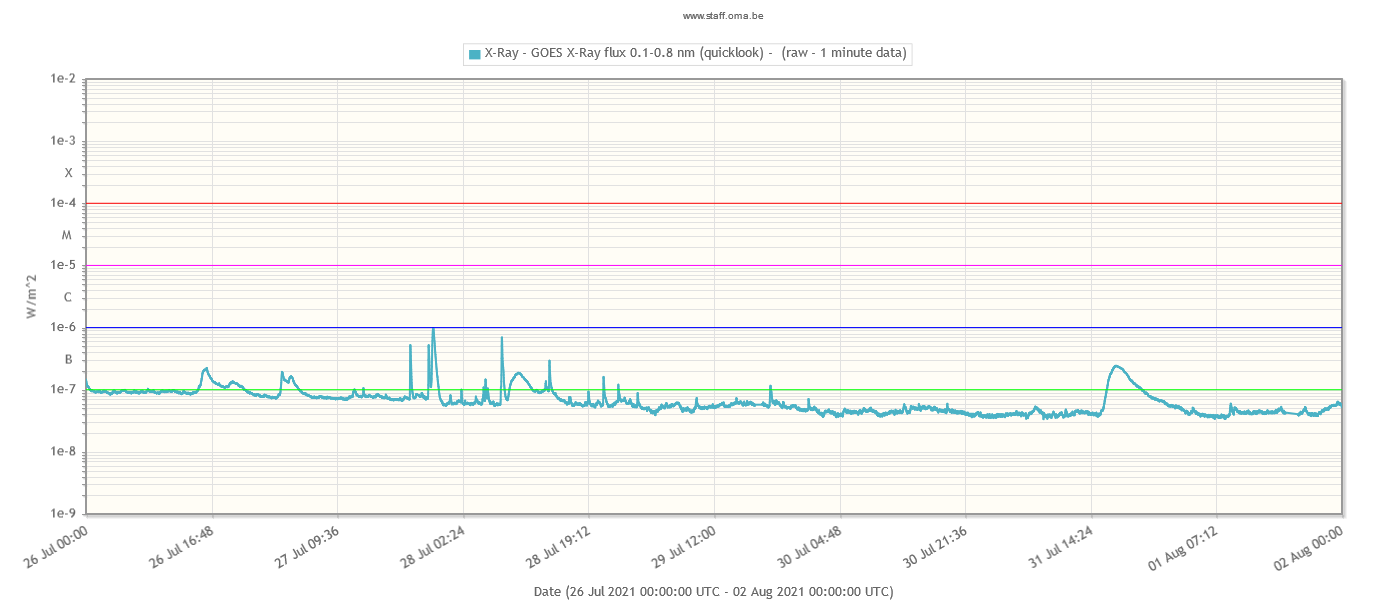
The solar activity has been quiet over the past week, with the X-ray flux below C-level.
Several large coronal dimming events were observed on the visible solar disc associated with B-class flares and filament eruptions. The resulted coronal mass ejections were faint and slow (projected speed of 300-400 km/s). No impact has been observed yet in the solar wind parameters and in the geomagnetic conditions, although some of the CMEs had earth-directed components.
The greater than 10 MeV proton flux was at nominal levels over the past week. The greater than 2 MeV electron flux was below the 1000 pfu threshold in the past week.
PROBA2 Observations (26 Jul 2021 - 1 Aug 2021)
Solar Activity
Solar flare activity was very low during the week.
In order to view the activity of this week in more detail, we suggest to go to the following website from which all the daily (normal and difference) movies can be accessed: https://proba2.oma.be/ssa
This page also lists the recorded flaring events.
A weekly overview movie can be found here (SWAP week 592): https://proba2.sidc.be/swap/data/mpg/movies/weekly_movies/weekly_movie_2021_07_26.mp4
Details about some of this week's events can be found further below.
If any of the linked movies are unavailable they can be found in the P2SC movie repository here: https://proba2.oma.be/swap/data/mpg/movies/
Wednesday Jul 28
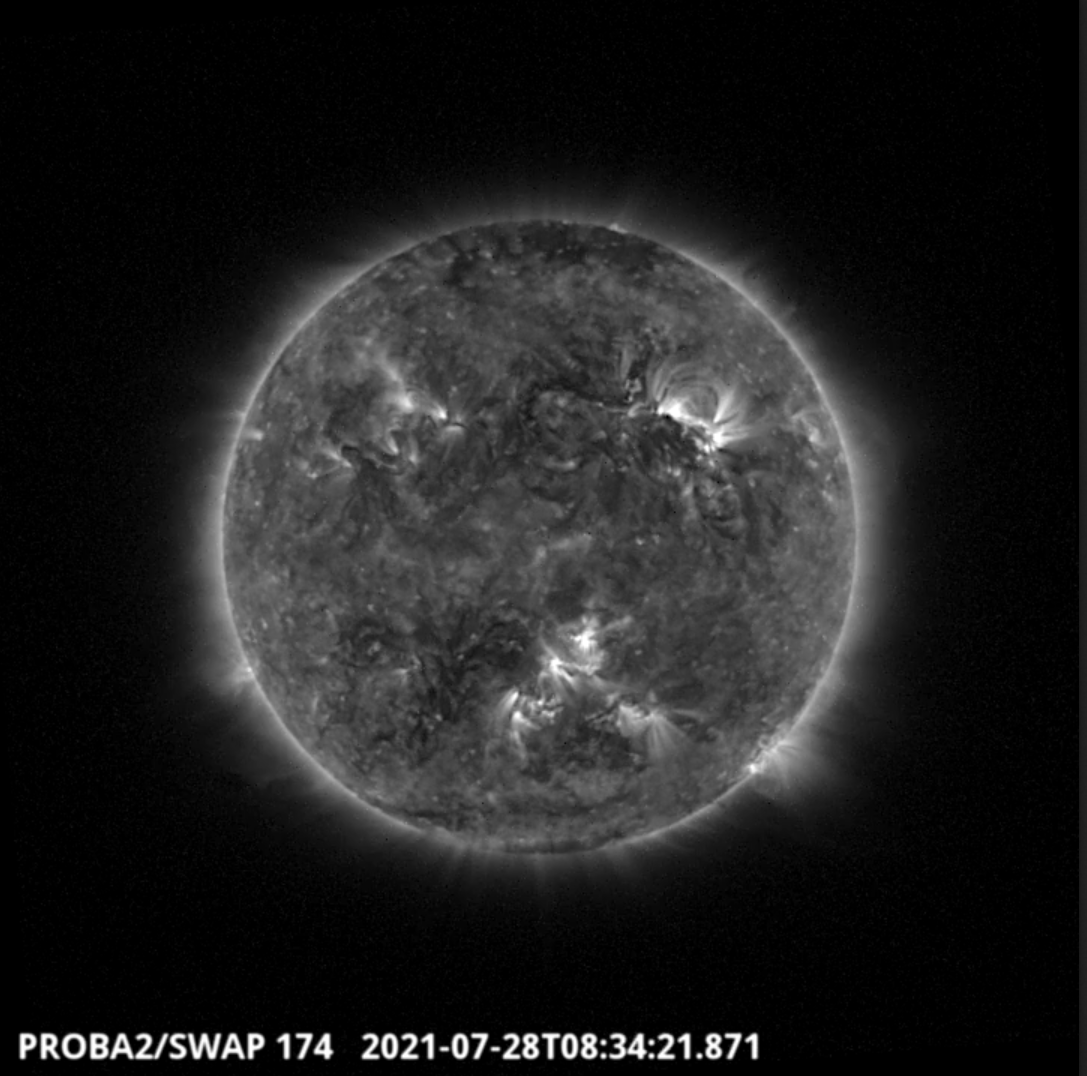
An eruption was observed by SWAP in the north-west of the solar disk on 2021-Jul-28, as shown in the SWAP image above taken at 08:34 UT.
Find a movie of the entire day here https://proba2.sidc.be/swap/movies/20210728_swap_movie.mp4 (SWAP movie) and here https://proba2.sidc.be/swap/movies/20210728_swap_diff.mp4 (SWAP difference movie).
The International Sunspot Number by SILSO
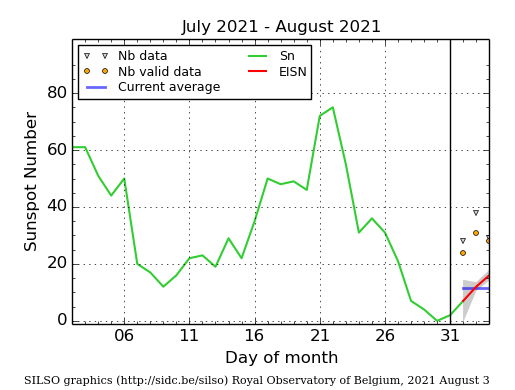
The daily Estimated International Sunspot Number (EISN, red curve with shaded error) derived by a simplified method from real-time data from the worldwide SILSO network. It extends the official Sunspot Number from the full processing of the preceding month (green line), a few days more than one solar rotation. The horizontal blue line shows the current monthly average. The yellow dots gives the number of stations that provided valid data. Valid data are used to calculate the EISN. The triangle gives the number of stations providing data. When a triangle and a yellow dot coincide, it means that all the data is used to calculate the EISN of that day.
Review of geomagnetic activity
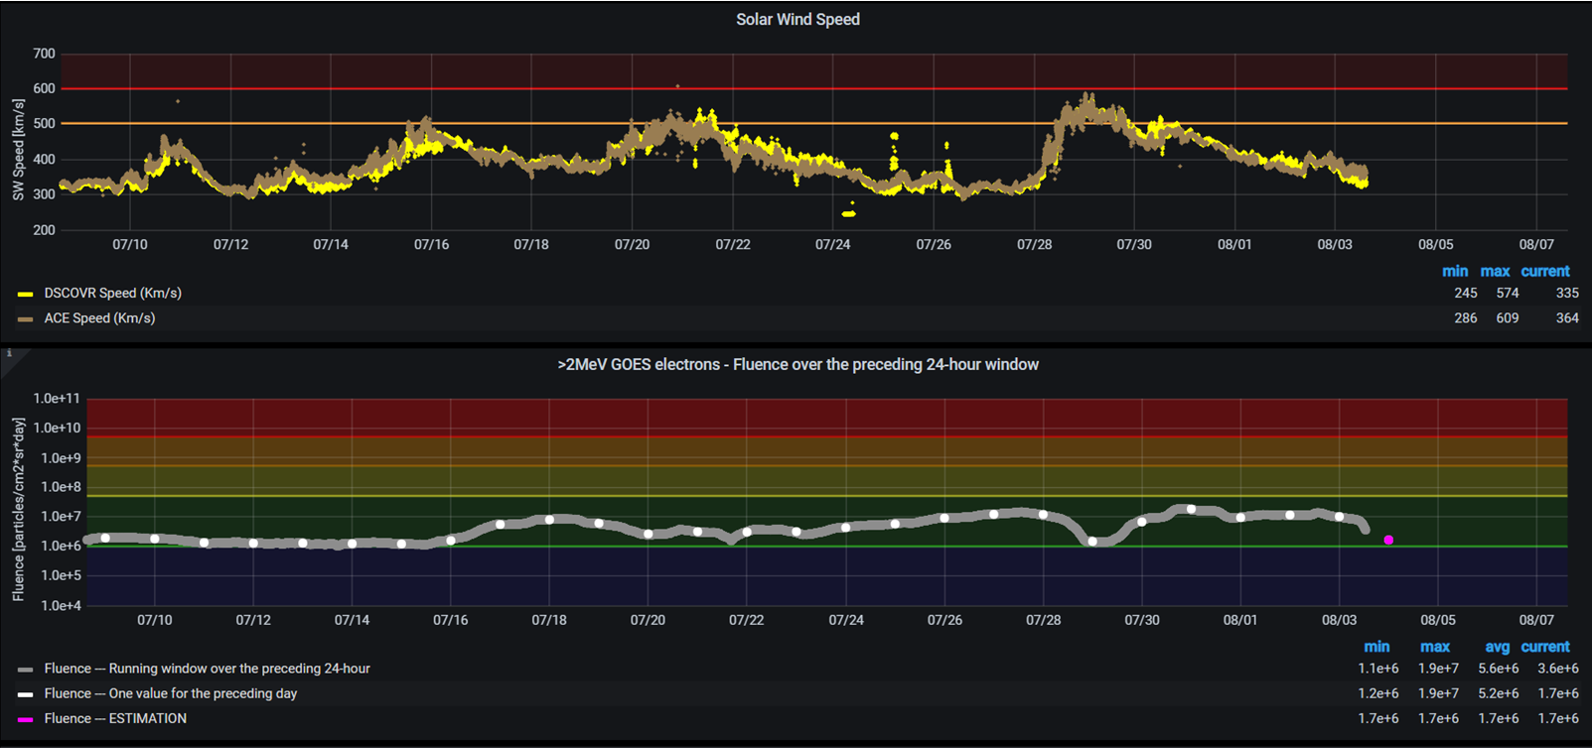
The solar wind parameters (as observed by ACE and DSCOVR) became enhanced due to the high-speed streams associated with the positive polarity northern polar coronal hole, that crossed the central meridian on July 24. The solar wind speed increased to values ranging between 500 km/s and 570 km/s between July 28 around 12:00 UTC and July 30 at 12:00 UTC. The interplanetary magnetic field magnitude reached values up to 14.6 nT on July 28, and the Bz component fluctuated between -11.3 nT and 14.6 nT at about the same time. The enhanced solar wind parameters then returned to nominal values at the end of the week.
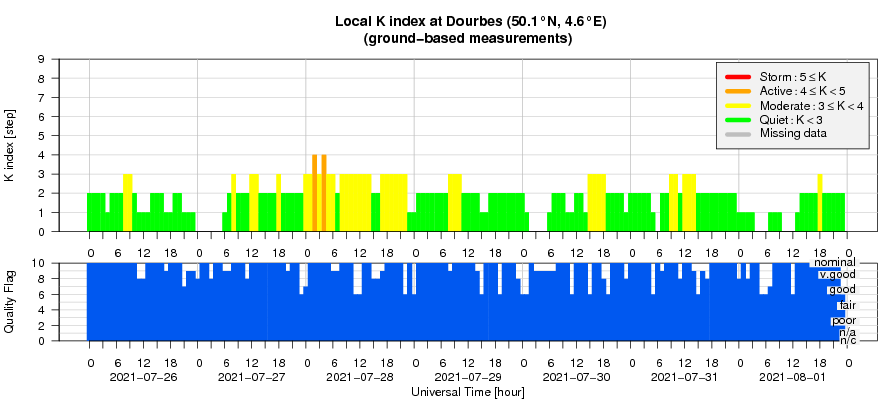
The geomagnetic conditions were mostly quiet over the past week. Unsettled to active conditions were observed in responses to the high-speed streams (NOAA-Kp and K-Dourbes = 3 and 4) on July 28.
The graphs underneath are from the PECASUS dashboard and show from 9 July onwards (top) the solar wind speed as recorded by the DSCOVR and ACE spacecraft, and (bottom) the greater than 2 MeV electron fluence (daily accumulated electron flux). The electron fluence was slightly enhanced but remained at nominal levels, due to the only mildly enhanced solar wind speed from coronal hole related windstreams.
Geomagnetic Observations at Dourbes (26 Jul 2021 - 1 Aug 2021)
The SIDC Space Weather Briefing
The Space Weather Briefing presented by the forecaster on duty from July 26 to August 1. It reflects in images and graphs what is written in the Solar and Geomagnetic Activity reports.
A pdf-version: https://www.stce.be/briefings/20210802_SWbriefing.pdf
The movie: https://www.stce.be/briefings/20210802_SWbriefing.wmv
Review of ionospheric activity (26 Jul 2021 - 1 Aug 2021)
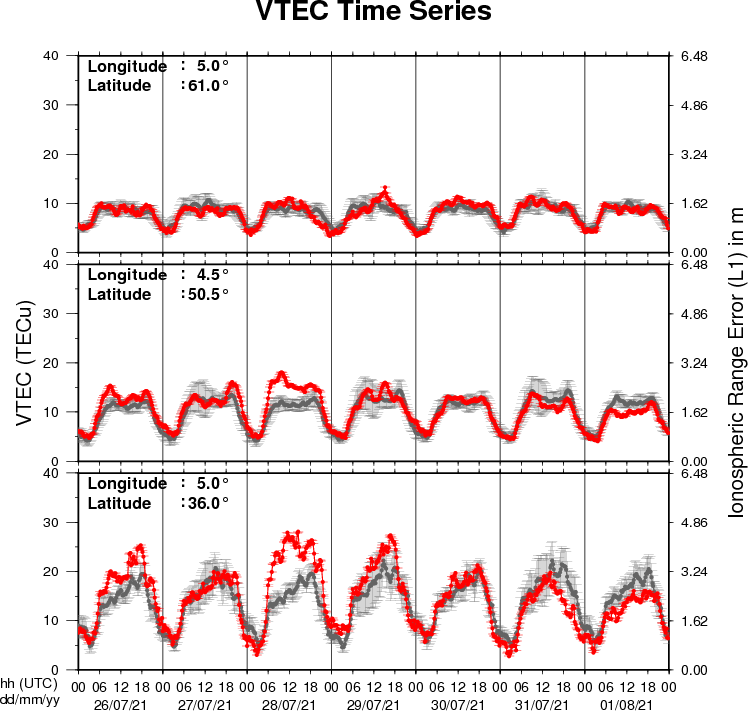
The figure shows the time evolution of the Vertical Total Electron Content (VTEC) (in red) during the last week at three locations:
a) in the northern part of Europe(N61°, 5°E)
b) above Brussels(N50.5°, 4.5°E)
c) in the southern part of Europe(N36°, 5°E)
This figure also shows (in grey) the normal ionospheric behaviour expected based on the median VTEC from the 15 previous days.
The VTEC is expressed in TECu (with TECu=10^16 electrons per square meter) and is directly related to the signal propagation delay due to the ionosphere (in figure: delay on GPS L1 frequency).
The Sun's radiation ionizes the Earth's upper atmosphere, the ionosphere, located from about 60km to 1000km above the Earth's surface.The ionization process in the ionosphere produces ions and free electrons. These electrons perturb the propagation of the GNSS (Global Navigation Satellite System) signals by inducing a so-called ionospheric delay.
See http://stce.be/newsletter/GNSS_final.pdf for some more explanations ; for detailed information, see http://gnss.be/ionosphere_tutorial.php