- Table of Content
- 1.A prominence e...
- 2.Review of sola...
- 3.PROBA2 Observa...
- 4.The Internatio...
- 5.Review of geom...
- 6.Geomagnetic Ob...
- 7.The SIDC Space...
- 8.Review of iono...
- 9.STCE in action...
2. Review of solar activity
3. PROBA2 Observations (6 Sep 2021 - 12 Sep 2021)
4. The International Sunspot Number by Silso
5. Review of geomagnetic activity
6. Geomagnetic Observations at Dourbes (6 Sep 2021 - 12 Sep 2021)
7. The SIDC Space Weather Briefing
8. Review of ionospheric activity (6 Sep 2021 - 12 Sep 2021)
9. STCE in action
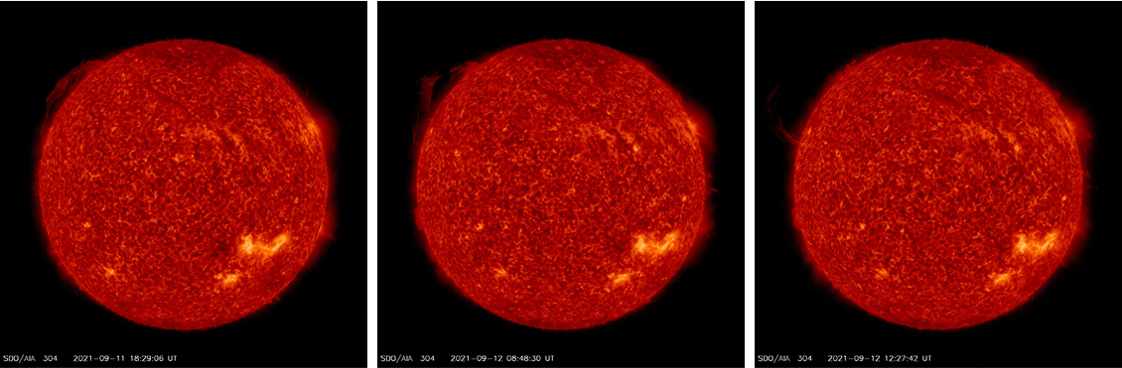
A prominence erupts
A quiescent prominence erupted around noon on 12 September near the Sun's northeast limb. Solar prominences are clouds of charged particles ("plasma") above the solar surface squeezed between magnetic regions of opposite polarity. Being cooler and denser than the plasma underneath and their surroundings, they appear as bright blobs when seen near the solar limb and as dark lines when seen on the solar disk (then they are called "filaments"). Special filters are required to observe these features, such as in the Hydrogen-alpha (H-alpha) line in the red part of the solar spectrum (656.28 nm), or in some extreme ultraviolet (EUV) passbands such as SDO/AIA 304.
The images underneath (for the clip see the online version of this article at https://www.stce.be/news/550/welcome.html ) show the gradual rise of the prominence starting on 11 September, until noon on 12 September when it fully erupts. The images date from around 18UT on 11 September, and 09 and 12UT on 12 September. At its longest, the prominence had an extent of more than 450.000 km, i.e. longer than the average Earth-Moon distance. Note this is a minimum length, as the prominence is seen in profile along the limb. The images are made with the SDO/AIA 304 filter (https://sdo.gsfc.nasa.gov/data/aiahmi/ ), showing the Sun at temperatures near 80.000 degrees. Near the end of the clip, there's also the eruption of a 600.000 km long filament close to the central meridian and starting early on 13 September (before and after image in the online version).
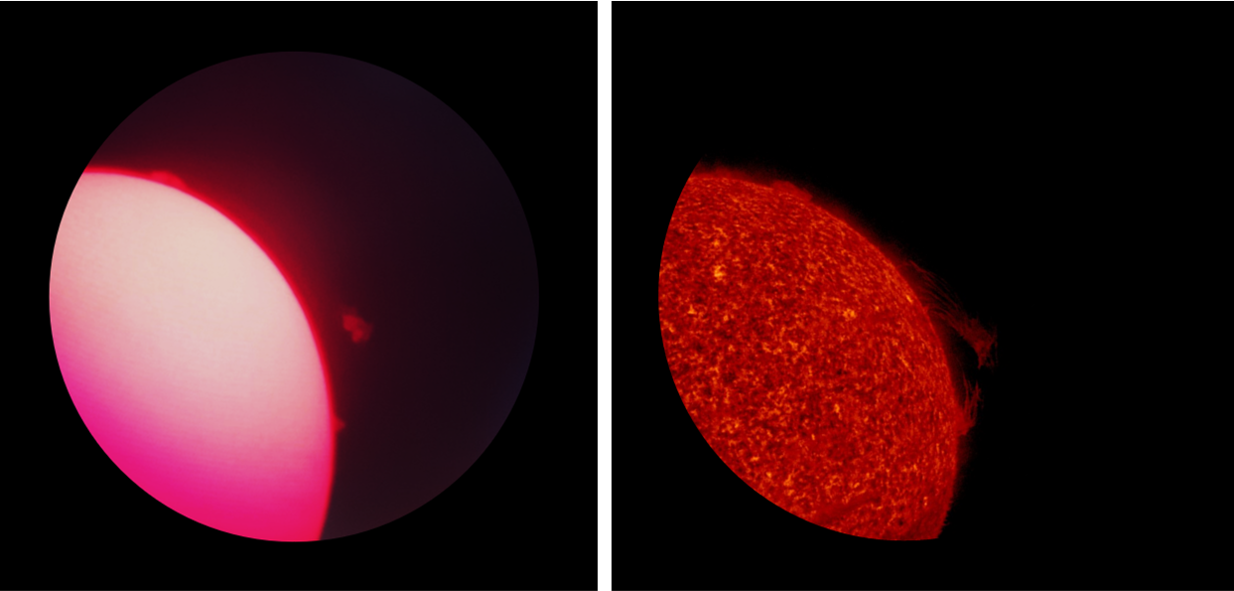
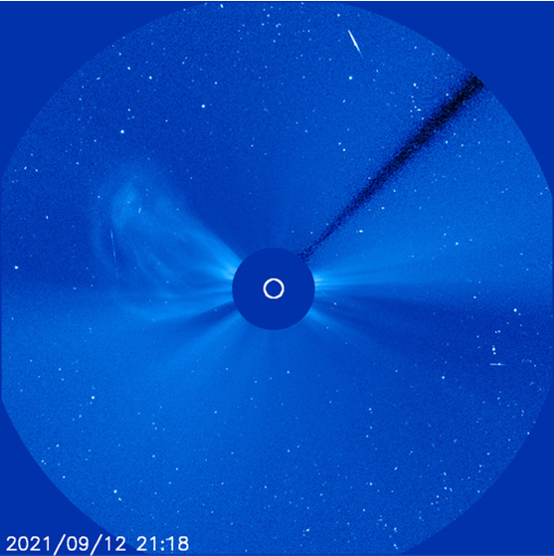
The prominence eruption was also visible with backyard H-alpha telescopes, thus showing the Sun at even lower temperatures near about 10.000 degrees. The picture underneath on the left was recorded with a modest 4cm H-alpha telescope at 08:52UT on 12 September, clearly showing a blob of plasma just hanging in the Sun's atmosphere, only hours before it was slingshotted into space. On the right is an SDO/AIA 304 image taken at about the same time (08:48UT), rotated such that it is oriented more or less in the same way as the H-alpha picture, with the prominence now on the right of the solar image. The comparison shows that the H-alpha blob mostly corresponds to the top of the prominence seen in AIA 304 (hovering about 45.000-60.000 km above the solar limb), and that it was still connected to the solar surface with hotter material not visible in H-alpha, only in AIA 304. The AIA 304 clip shows that part of this material (southern portion) flowed back to the solar surface shortly after the eruption. The associated coronal mass ejection was not directed towards the Earth (SOHO/LASCO - https://soho.nascom.nasa.gov/ ).
Review of solar activity
Flares
Solar activity was very low to low . Seven active regions were seen on the side of the Sun facing Earth: NOAA 2863-2866 and NOAA 2868-2870 producing seven C-flares. Active region NOAA 2866 (beta) was the largest and most complex region at first. Towards the end of the week, NOAA 2868 became gamma-beta overruling the complexity of NOAA 2866.
NOAA 2866 released four C-flares, namely C1.1 on Sept 07th (peak time 09:34 UTC), C1.2 and C8.3 on Sept 08th (with corresponding peak times 10:26 UTC and 17:30 UTC), and C3.5 on Sept 09th (peak time 08:31 UTC).
NOAA 2868 produced a C1.1 on Sept 08th (peak time 03:14 UTC) and another C1.1 on Sept 10th (peak time 21:34 UTC).
NOAA 2864 (beta) produced a long duration C2.3-class flare on Sept 08th (peak time 00:09 UTC).
The other active regions were simpler and exhibited very low levels of activity.
Coronal Mass Ejections
Several coronal mass ejections (CMEs) with a prominent coronal dimming and EIT wave, were detected. The highlight of the week was a faint partial halo CME on Sept 05th following a filament eruption close to a plage region (previously NOAA 2665) and a series of B-flares from the neighbouring active region NOAA 2664. The CME was very slow with a projected velocity less than 150 km/s.
No other Earth-directed CMEs were detected.
Particle flux
The greater than 10 MeV proton flux remained at background levels.
The greater than 2 MeV electron flux was elevated in the beginning of the week, with short crossings above the 1000 pfu threshold from Sept 05th to 07th. On Sept 08th, the greater than 2 MeV electron flux returned to nominal levels and remained so for the rest of the week.
The electron fluence started at moderate levels and returned to nominal levels from Sept 07th onwards.
PROBA2 Observations (6 Sep 2021 - 12 Sep 2021)
Solar Activity
Solar flare activity fluctuated from very low to low during the week.
In order to view the activity of this week in more detail, we suggest to go to the following website from which all the daily (normal and difference) movies can be accessed: https://proba2.oma.be/ssa
This page also lists the recorded flaring events.
A weekly overview movie can be found here (SWAP week 598): https://proba2.sidc.be/swap/data/mpg/movies/weekly_movies/weekly_movie_2021_09_06.mp4
Details about some of this week's events can be found further below.
If any of the linked movies are unavailable they can be found in the P2SC movie repository here: https://proba2.oma.be/swap/data/mpg/movies/
Wednesday Sep 08
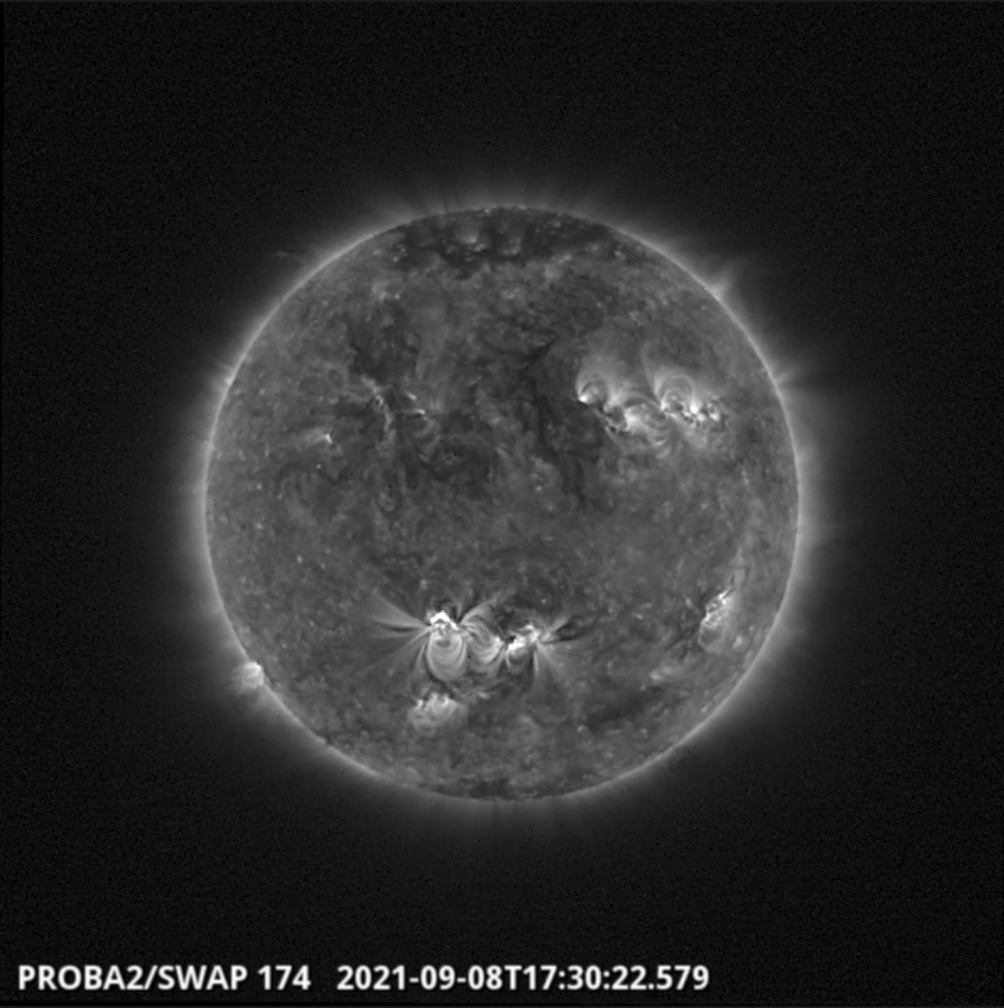
The largest flare of the week, a C8.3 flare, was observed by SWAP and LYRA. The flare is visible near the central meridian in the southern hemisphere of the solar disk on 2021-Sep-08, as shown in the SWAP image above taken at 17:30 UT.
Find a movie of the event here (SWAP movie): https://proba2.sidc.be/swap/movies/20210908_swap_movie.mp4
The International Sunspot Number by Silso
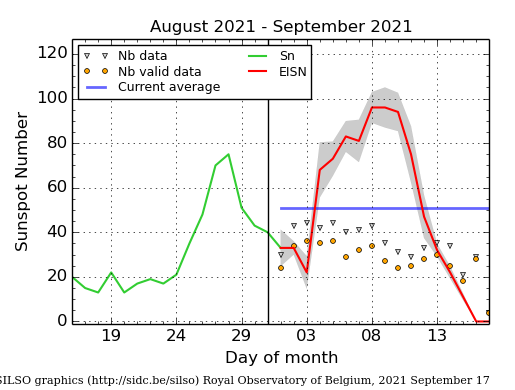
The daily Estimated International Sunspot Number (EISN, red curve with shaded error) derived by a simplified method from real-time data from the worldwide SILSO network. It extends the official Sunspot Number from the full processing of the preceding month (green line), a few days more than one solar rotation. The horizontal blue line shows the current monthly average. The yellow dots gives the number of stations that provided valid data. Valid data are used to calculate the EISN. The triangle gives the number of stations providing data. When a triangle and a yellow dot coincide, it means that all the data is used to calculate the EISN of that day.
Review of geomagnetic activity
Solar wind at L1
The solar wind parameters (based on DSCOVR and ACE data) reflected two enhancements.
On Sept 07th the spacecraft in L1 registered the arrival of a high speed stream (HSS) from a negative polarity coronal hole (CH 96), which crossed the central meridian on Sept 2nd. The effect of the CH continued Sept 08th and subsided after.
On Sept 10th, an interplanetary CME (ICME) passed L1. The ICME was linked to the faint CME of Sept 05. The ICME carried a moderate to enhanced magnetic field. The first part of the magnetic cloud of the ICME passed around 09:45 UTC on Sept 10th. The last part passed around 23:00 UTC the same day.
Despite the HSS and the ICME arrival the solar wind speed was only slightly elevated with maximal speed of 440 km/s for the entire week. The total magnetic field reached up to 14 nT on Sept 11th, with Bz component varying irregularly in the range of -10.5 to 10.5 nT.
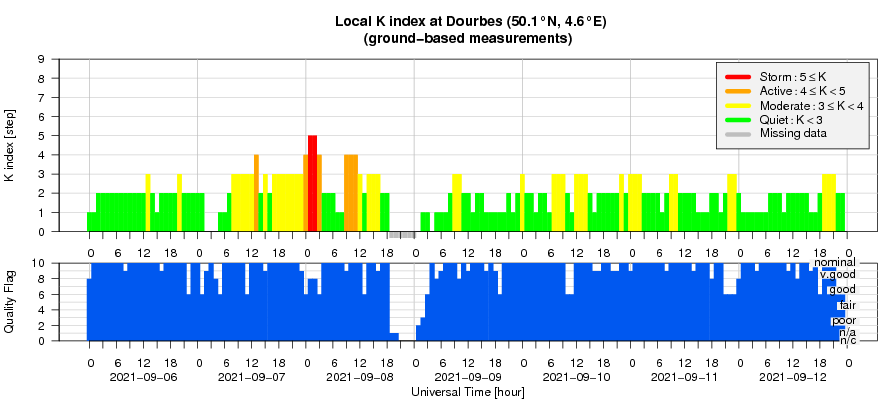
Geomagnetic conditions
The geomagnetic conditions were quiet to unsettled, except for 2 periods.
On Sept 08t, the HSS induced active conditions at planetary level and a minor geomagnetic storm in Dourbes between 00:00 and 02:00 UTC.
On Sept 10th, a short period of active conditions at planetary level was registered coinciding with the passage of the last part of the magnetic cloud.
Geomagnetic Observations at Dourbes (6 Sep 2021 - 12 Sep 2021)
The SIDC Space Weather Briefing
The Space Weather Briefing presented by the forecaster on duty from Sept 05 to 12. It reflects in images and graphs what is written in the Solar and Geomagnetic Activity report.

A pdf-version: https://www.stce.be/briefings/20210913_SWbriefing.pdf
The movie: https://www.stce.be/briefings/20210913_SWbriefing.m4v
Review of ionospheric activity (6 Sep 2021 - 12 Sep 2021)
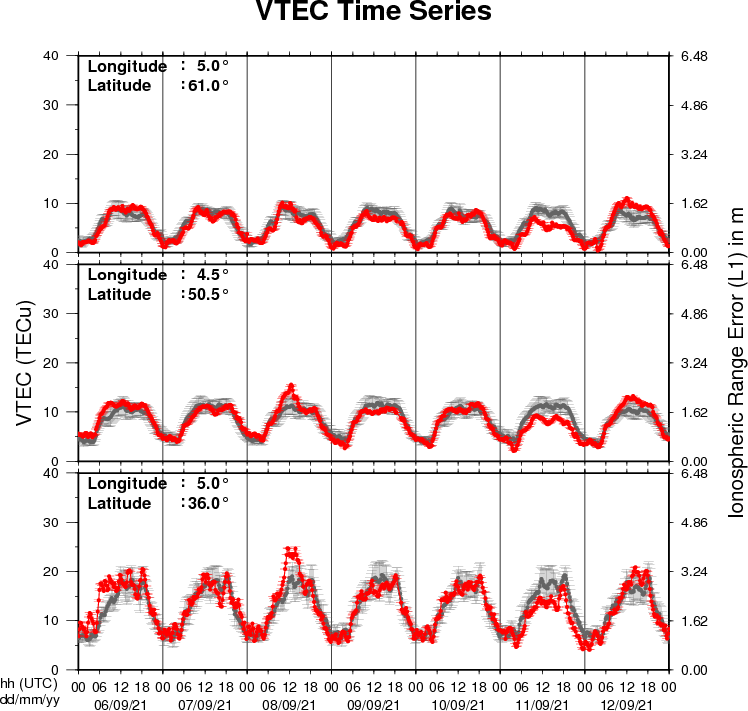
The figure shows the time evolution of the Vertical Total Electron Content (VTEC) (in red) during the last week at three locations:
a) in the northern part of Europe(N61°, 5°E)
b) above Brussels(N50.5°, 4.5°E)
c) in the southern part of Europe(N36°, 5°E)
This figure also shows (in grey) the normal ionospheric behaviour expected based on the median VTEC from the 15 previous days.
The VTEC is expressed in TECu (with TECu=10^16 electrons per square meter) and is directly related to the signal propagation delay due to the ionosphere (in figure: delay on GPS L1 frequency).
The Sun's radiation ionizes the Earth's upper atmosphere, the ionosphere, located from about 60km to 1000km above the Earth's surface.The ionization process in the ionosphere produces ions and free electrons. These electrons perturb the propagation of the GNSS (Global Navigation Satellite System) signals by inducing a so-called ionospheric delay.
See http://stce.be/newsletter/GNSS_final.pdf for some more explanations ; for detailed information, see http://gnss.be/ionosphere_tutorial.php
STCE in action
Check out our activity calendar: activities and encounters with the Sun-Space-Earth system and Space Weather as main themes. We provide occasions to get submerged in our world through educational, informative and instructive activities.
September 24 and 25, science festival Wise Night with STCE activities 'Northern lights: scientific explanation or is it caused by something completely different?' and 'Panic in the Space Weather Room', Brussels, Belgium
October 7, Seminar - A filter concept for reducing random variation in time series: Procedures, limits, applications, organisation by the RMI
October 11 - 15, Online SWx introductory Course (SWIC), organisation by the STCE - complete
October 21, Seminar - Understanding rainfall variability using climate models over the Ethiopian Highlands, organisation by the RMI
October 28, Seminar - Simulating tree growth response to climate change in structurally-complex oak and beech stands across Europe, organisation by the RMI
November 22 - 26, Online SWx introductory Course (SWIC), organisation by the STCE - complete
Check: https://www.stce.be/calendar
We plan again an online SWIC from Jan 31 - Feb 4, 2022 and an on-site SWIC in the week of March 14 - 18, 2022. Registrations are not open yet, but you can note already the dates if you are interested.
