- Table of Content
- 1.Ode to GOES
- 2.Clap clap for ...
- 3.STCE at ESWW20...
- 4.Review of sola...
- 5.PROBA2 Observa...
- 6.The Internatio...
- 7.Review of geom...
- 8.Geomagnetic Ob...
- 9.The SIDC Space...
- 10.Review of iono...
2. Clap clap for ...
3. STCE at ESWW2021
4. Review of solar activity
5. PROBA2 Observations (11 Oct 2021 - 17 Oct 2021)
6. The International Sunspot Number by Silso
7. Review of geomagnetic activity
8. Geomagnetic Observations at Dourbes (11 Oct 2021 - 17 Oct 2021)
9. The SIDC Space Weather Briefing
10. Review of ionospheric activity (11 Oct 2021 - 17 Oct 2021)
Ode to GOES
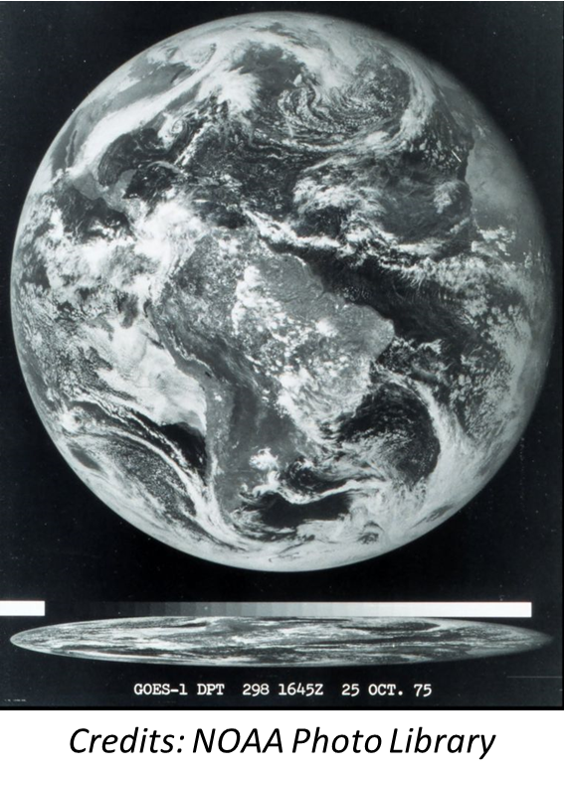
On 16 October 1975, the launch of GOES-1, NOAA's first Geostationary Operational Environmental Satellite (GOES - https://www.noaasis.noaa.gov/GOES/goes_overview.html), took place. Just a few days later, on 25 October 1975, it produced its first near real-time full-disk image of the Earth from a fixed position thousands of kilometers away (figure underneath). The GOES are operated by NOAA, and provide critical meteorological data for weather forecasting, severe storm tracking, and research. They are also paramount in monitoring volcanic activity and associated ash plumes. See the NESDIS webpages at https://www.nesdis.noaa.gov/news/40-years-of-goes-the-anniversary-of-goes-1 for more info on GOES-1.
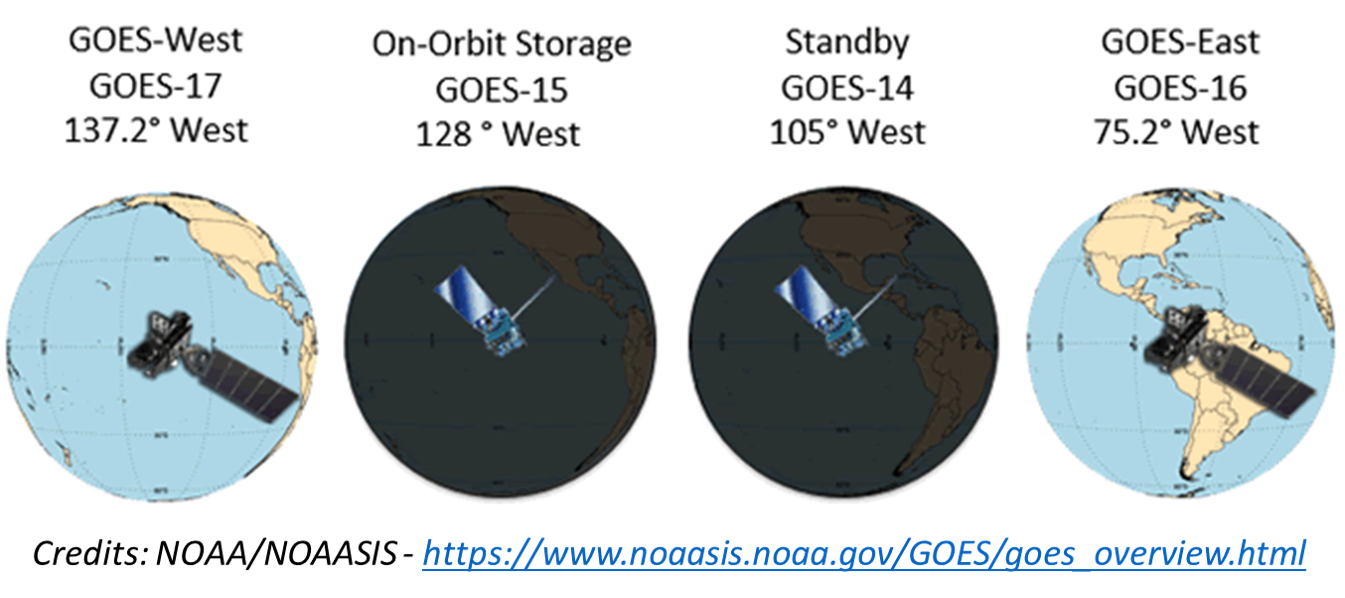
GOES satellites are designated by letters (A, B, C,...). Once a GOES satellite is launched successfully, it gets a number assigned (1, 2, 3,...). For example, GOES-G did not reach its intended orbit afer a premature engine shutdown prohibting the satellite to reach its intended orbit. That's why despite 18 GOES have been launched, the latest GOES carries only the number 17. GOES are operating in a geostationary orbit 35,790 kilometres above the Earth's surface, allowing them to look at the planet from a fixed position. To ground observers it appears motionless, in a fixed position in the sky. That way, earth-based satellite antennas do not have to rotate to track them but can be pointed permanently at the position in the sky where the satellites are located. There are currently 2 GOES operational (GOES -16 and -17), one is in an on-orbit storage mode (GOES-15), and GOES-14 is simply on stand-by.
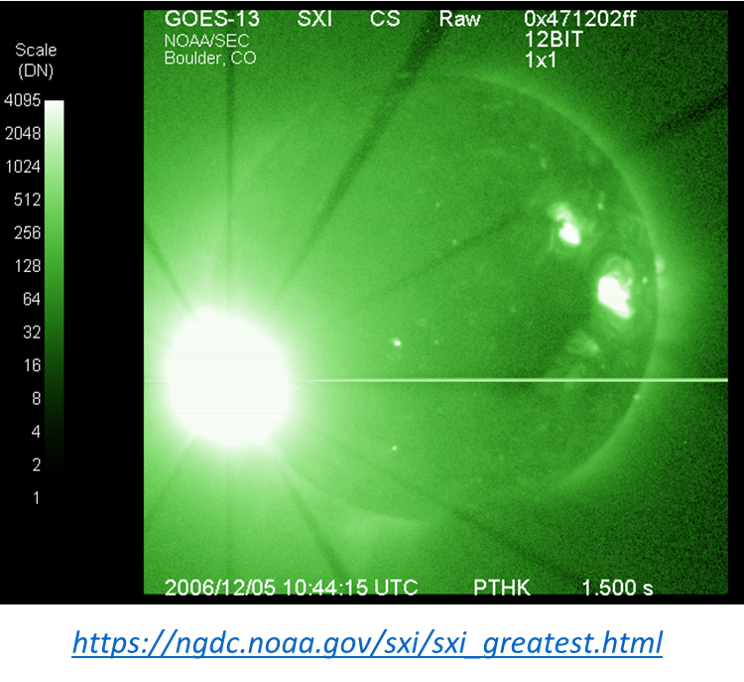
Of course, the space weather community knows GOES from all the data they contribute in the solar-terrestrial domain. Monitoring and forecasting space weather activity would be a whole different story without the indispensable data provided by GOES, such as the solar x-ray flux, proton fluxes for particles of different energies, high-energy electron fluxes, and magnetometer readings amongst other. The latest generation has a Solar Ultraviolet Imager (SUVI - see e.g. this STCE Newsitem at https://www.stce.be/news/484/welcome.html for an example), superseding the Soft X-ray Imager (SXI) present on the previous generations. Space weather activity can also be dangerous to GOES. On 5 December 2006, the SXI on board the GOES-13 was crippled by a strong X9 flare produced by NOAA 0930 (underneath). These outages are rare though, and data delivery is assured by back-up satellites and a consistent GOES launch program. Thank you GOES, and ad multos annos!
Clap clap for ...
Alfredo Micera! He just did his PhD defence with the thesis 'Observations and Modeling of the Solar Wind Kinetics'.
His thesis 'Observations and Modeling of the Solar Wind Kinetics' starts like a scientific fairy tale:
We are only a magnetosphere away from a huge plasma physics laboratory, the solar wind. ...
From reading the first sentence, you know that you are going to feel, taste, imagine, ... science.
If you want to know who is the bad one, the trouble maker, the good one, the beauty and how the story ends, contact us.
Congratulations Alfredo!
.png)
STCE at ESWW2021
The 17th European Space Weather Week takes place from 25 to 29 October 2021.
The STCE is present with a virtual fair stand.

Come and visit us on Wednesday, October 27.
Info on http://esww17.iopconfs.org/Home
Review of solar activity
The GOES X-ray flux background varied between the A6 and B1 level. NOAA regions 2882, 2883, 2884 and 2885 were present on the visible hemisphere of the Sun. Beta-gamma region 2882 produced several high B flares and beta region 2885 released 3 low C flares. The Sun produced no M or X flares.
No Earth-directed Coronal Mass Ejections were observed.
The greater than 10 MeV proton flux was at nominal levels throughout the week.
The greater than 2 MeV electron flux briefly reached moderate levels on October 15 and fluence was nominal throughout the week.
PROBA2 Observations (11 Oct 2021 - 17 Oct 2021)
Solar Activity
Solar flare activity fluctuated from very low to low during the week.
In order to view the activity of this week in more detail, we suggest to go to the following website from which all the daily (normal and difference) movies can be accessed: https://proba2.oma.be/ssa
This page also lists the recorded flaring events.
A weekly overview movie can be found here (SWAP week 603). https://proba2.oma.be/swap/data/mpg/movies/weekly_movies/weekly_movie_2021_10_11.mp4
Details about some of this week's events can be found further below.
If any of the linked movies are unavailable they can be found in the P2SC movie repository here https://proba2.oma.be/swap/data/mpg/movies/
Thursday Oct 14
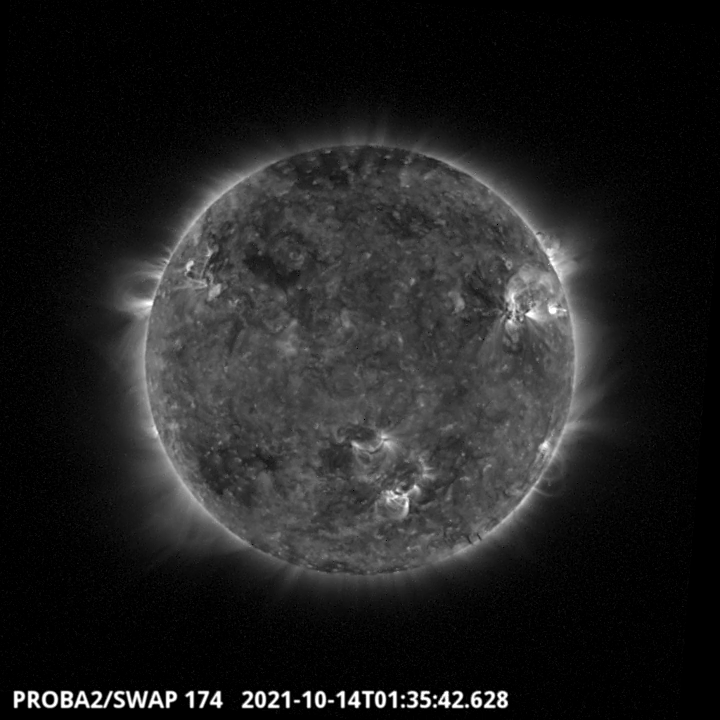
The largest flare of the week has been classified as a C2.2 flare. It originated from the NOAA active region labelled 2885. It is visible on the North West quadrant of the solar disk on the SWAP image above around 1:35 UT. Find a movie of the events here (SWAP movie) https://proba2.oma.be/swap/data/mpg/movies/20211014_swap_movie.mp4
The International Sunspot Number by Silso
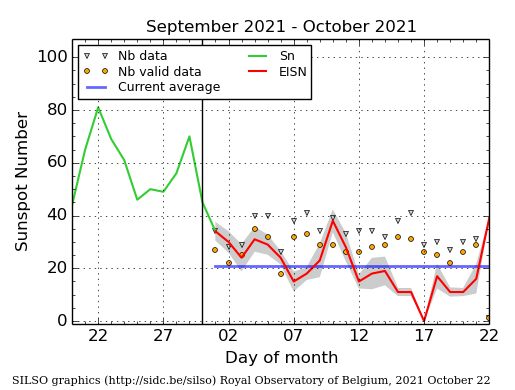
The daily Estimated International Sunspot Number (EISN, red curve with shaded error) derived by a simplified method from real-time data from the worldwide SILSO network. It extends the official Sunspot Number from the full processing of the preceding month (green line), a few days more than one solar rotation. The horizontal blue line shows the current monthly average. The yellow dots gives the number of stations that provided valid data. Valid data are used to calculate the EISN. The triangle gives the number of stations providing data. When a triangle and a yellow dot coincide, it means that all the data is used to calculate the EISN of that day.
Review of geomagnetic activity
An Interplanetary Coronal Mass Ejection (ICME) arrived near Earth around 01:45 UT on October 12, leading to a maximum solar wind speed of around 515 km/s and a maximal Interplanetary Magnetic Field (IMF) magnitude of about 16 nT. This ICME was probably associated with the halo CME and M1.6 flare of October 9. The solar wind was nominal from October 14 onwards.
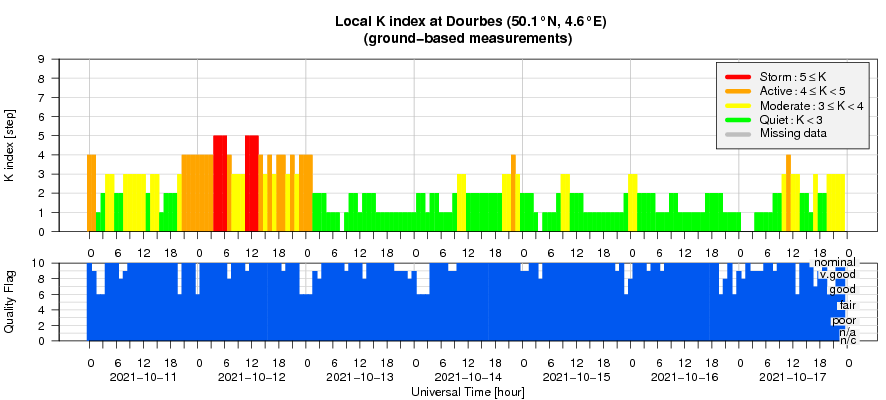
Geomagnetic indexes reached minor storm levels (K Dourbes = 5, NOAA Kp = 6) during a few intervals on October 12, and were mostly quiet to unsettled (K Dourbes less than 4) throughout the rest of the week.
Geomagnetic Observations at Dourbes (11 Oct 2021 - 17 Oct 2021)
The SIDC Space Weather Briefing
The Space Weather Briefing presented by the forecaster on duty from Oct 10 to 17. It reflects in images and graphs what is written in the Solar and Geomagnetic Activity report.

A pdf-version: https://www.stce.be/briefings/20211018_SWbriefing.pdf
The movie: https://www.stce.be/briefings/20211018_SWbriefing.m4v
Review of ionospheric activity (11 Oct 2021 - 17 Oct 2021)
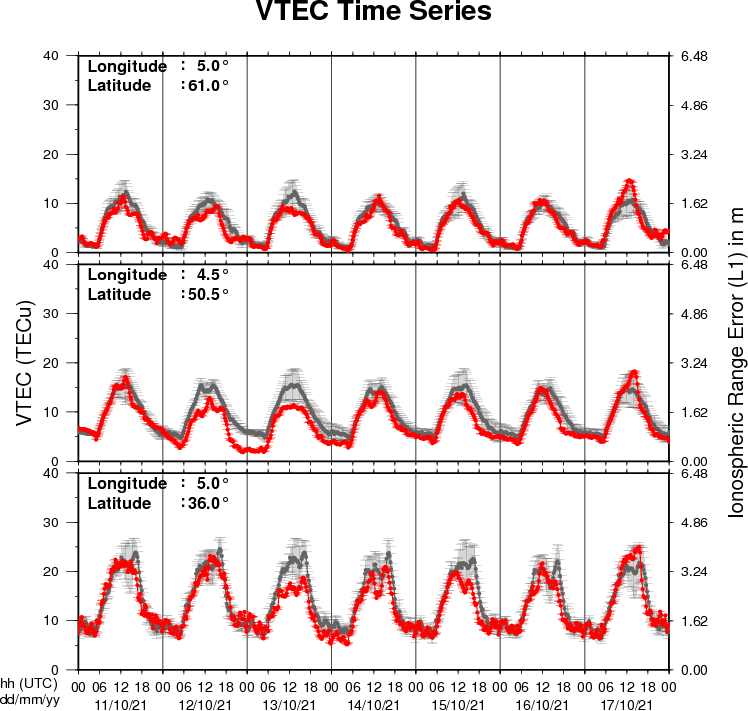
The figure shows the time evolution of the Vertical Total Electron Content (VTEC) (in red) during the last week at three locations:
a) in the northern part of Europe(N61°, 5°E)
b) above Brussels(N50.5°, 4.5°E)
c) in the southern part of Europe(N36°, 5°E)
This figure also shows (in grey) the normal ionospheric behaviour expected based on the median VTEC from the 15 previous days.
The VTEC is expressed in TECu (with TECu=10^16 electrons per square meter) and is directly related to the signal propagation delay due to the ionosphere (in figure: delay on GPS L1 frequency).
The Sun's radiation ionizes the Earth's upper atmosphere, the ionosphere, located from about 60km to 1000km above the Earth's surface.The ionization process in the ionosphere produces ions and free electrons. These electrons perturb the propagation of the GNSS (Global Navigation Satellite System) signals by inducing a so-called ionospheric delay.
See http://stce.be/newsletter/GNSS_final.pdf for some more explanations ; for detailed information, see http://gnss.be/ionosphere_tutorial.php