- Table of Content
- 1.New: a Belgian...
- 2.Review of sola...
- 3.The Internatio...
- 4.Noticeable Sol...
- 5.Geomagnetic Ob...
- 6.PROBA2 Observa...
- 7.Review of geom...
- 8.Geomagnetic Ob...
- 9.The SIDC Space...
- 10.Review of iono...
- 11.Action!
2. Review of solar activity
3. The International Sunspot Number by Silso
4. Noticeable Solar Events (1 Nov 2021 - 7 Nov 2021)
5. Geomagnetic Observations in Belgium (1 Nov 2021 - 7 Nov 2021)
6. PROBA2 Observations (1 Nov 2021 - 7 Nov 2021)
7. Review of geomagnetic activity
8. Geomagnetic Observations at Dourbes (1 Nov 2021 - 7 Nov 2021)
9. The SIDC Space Weather Briefing
10. Review of ionospheric activity (1 Nov 2021 - 7 Nov 2021)
11. Action!
New: a Belgian K-index monitoring geomagnetic disturbances (1 Nov 2021 - 7 Nov 2021)
We proudly present K_Bel: a new, local K-index used to monitor the variations in the magnetic field. It is based on data from two independent magnetometers located in the magnetic observatories of Belgium: Dourbes and Manhay (the Intermagnet codes are DOU and MAB respectively).

Figure 1: Location of the RMI geomagnetic observatories, shown here on a map of the crustal magnetic anomaly of Belgium. The distance between the observatories is about 80 km. (Figure taken from Verhulst et al., 2021)
Why a local K-index?
As we increasingly rely on technologies that can be affected by geomagnetic disturbances, e.g. GNSS systems, not only major geomagnetic storms are worth being monitored, but also the much more frequent lower intensity events. The well known Kp-index is a planetary geomagnetic activity scale, ranging from 0 to 9, based on ground-based magnetic field variations. Besides this global index, a local K-index provides a more accurate geomagnetic activity level over a limited area (a few thousands km²). Such a local index can detect smaller disturbances, and can often detect them earlier than a global one. The Royal Meteorological Institute of Belgium has been providing a local K-index in real time, based solely on the observations from Dourbes for about ten years. However, over this period some issues have come to light where including the data from the Manhay observatory presents some advantages.
What are the advantages of K_Bel in comparison with a local K-index based on one single observatory?
Those advantages are directly related to the close proximity of the two observatories: the distance between the two sites (about 80km) is sufficient to consider local conditions as independent, but remains small enough so that the real variations recorded by the magnetometers must be similar.
The first major advantage is in the quality of the automated real-time data validation process. The validation of geomagnetic data is a challenging issue because magnetic data can significantly change from one second to another, unpredictably, resulting in a difficult process of identifying outliers. For instance, a spike due to a local power-grid issue may significantly influence the index if not removed. The real time comparison of the two data sets offers a reliable tool to eliminate any outlier. Since both observatories can be assumed to provide independent measurements, any variations caused by technical issues, interference, etc. will only be present in one data set. This provides a cleaner data set than what can be obtained in real-time from a single observatory, thus the K_Bel index is more accurate than any single station index.
The second major advantage is to guarantee the operational service availability. A local K-index based on one single observatory fails if the related magnetic observatory fails to deliver data, and the combined index K_Bel needs data from both observatories to be available. However, in the new operational system, single observatory indices KDOU and KMAB are still calculated for both observatories in parallel with the combined index. Availability of at least one of the three indices is guaranteed 24/7 (more than 99% of time, based on data from the past years) even if one of the two observatories temporarily fails to deliver data.

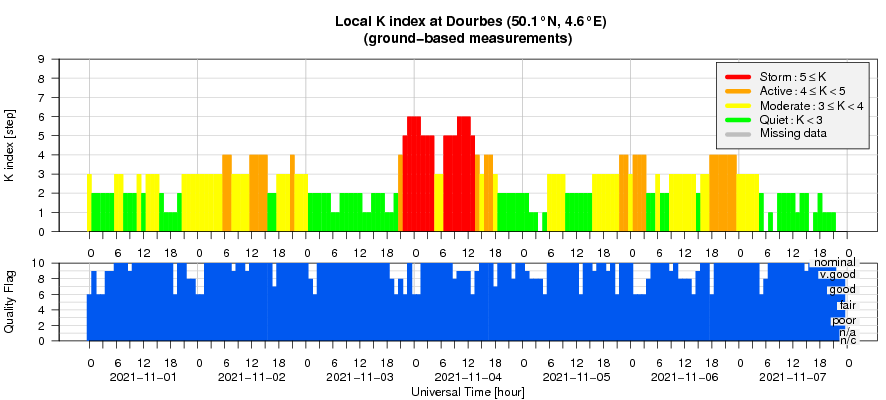
Figure 2: K_Bel index covering the period from November 1 to 7, 2021. This week showed plenty of geomagnetic activity with the arrival of ICMEs and a high-speed-stream. For more details, check out the 'Review of geomagnetic activity' section of this Newsletter.
More background information and real-time K-indices (both the single station indices and K_Bel) can be found here: http://ionosphere.meteo.be/geomagnetism/, or in the paper describing the operational system: Verhulst et al. (2021, https://agupubs.onlinelibrary.wiley.com/doi/10.1029/2020SW002709 ).

Figure 3: The dedicated K_Bel scientists were very excited to present their new index to the STCE communication team in preparation of this official release in the STCE newsletter.
Review of solar activity
Solar activity was dominated by the activity from regions NOAA 2887 and 2891 which both produced M flares and Earth directed CMEs.
The M1.5 flare from NOAA region 2887 peaked at 1:45UT November 1 and was associated with an EUV dimming and wave, as well as type II and IV radio bursts. An associated partial halo CME was visible in LASCO C2 coronagraph images from 2:00UT November 1 onwards. The CME was directed towards the South-West and had an angular width of around 230 degrees. Its speed was measured around 900 km/s. The CME was expected to arrive at Earth November 4, 2UT.
This region released more CMEs, with possibly Earth directed components with the remark that possible arrivals at Earth would be most probably not be separable from the more likely arrivals of the November 1 2:00UT CME (arrival early November 4) and the CME from NOAA region 2891 (see next paragraph).
A M1.7 flare from NOAA region 2891 peaked at 3:01 UT November 2. SoHO LASCO C2 coronagraph images showed an associated asymmetric full halo CME from 2:48UT onwards. Its speed projected on the plane of the sky was initially estimated as 650 km/s on average with larger speeds of around 1100km/s in the Northern direction. Later STEREO COR2 coronagraph images showed a projected speed of 1100 km/s towards the West.
The CME was certainly Earthbound and an arrival was preliminarily estimated in the late hours of November 4, and later refined to 16:00 UT based on a true 3D speed of around 1200 km/s. It turned out that this was an underestimation and true speed in the direction of propagation must have been higher leading to an earlier arrival.
Both regions (2887 and 2891) decayed while turning towards the West limb. Region 2893 which turned onto the disc at the start of the week in the North East was unipolar and stable throughout the week. At the end of the week, region 2894 turned onto the disc in the South-East and was the source of low class C flaring.
The more than 10MeV proton flux remained slightly enhanced during the first half of the week and briefly peaked over the event threshold at 20:55UT November 3 with the arrival of the CME shock. It decayed to background values soon after.
The greater than 2 MeV electron flux was initially below the 1000 pfu threshold. With the continued solar wind enhancements following the CME arrival on November 3, it started increasing from November 4 onwards and then crossing the event threshold each day. Likewise 24h electron fluence was at normal levels initially and then increased to moderate levels by the end of the week.
The International Sunspot Number by Silso
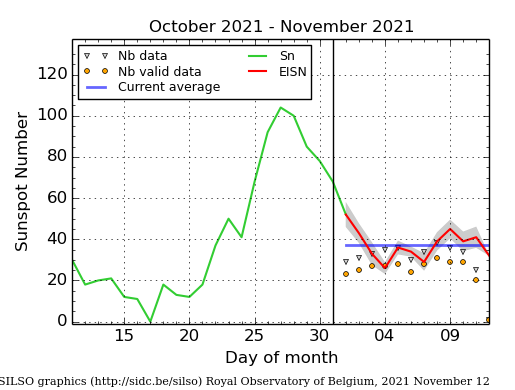
The daily Estimated International Sunspot Number (EISN, red curve with shaded error) derived by a simplified method from real-time data from the worldwide SILSO network. It extends the official Sunspot Number from the full processing of the preceding month (green line), a few days more than one solar rotation. The horizontal blue line shows the current monthly average. The yellow dots gives the number of stations that provided valid data. Valid data are used to calculate the EISN. The triangle gives the number of stations providing data. When a triangle and a yellow dot coincide, it means that all the data is used to calculate the EISN of that day.
Noticeable Solar Events (1 Nov 2021 - 7 Nov 2021)
| DAY | BEGIN | MAX | END | LOC | XRAY | OP | 10CM | TYPE | Cat | NOAA |
| 01 | 0057 | 0145 | 0210 | S29W45 | M1.5 | 1F | 210 | III/1II/1IV/2 | 2887 | |
| 02 | 0203 | 0251 | 0257 | M1.6 | 110 | III/1 | 2891 | |||
| 02 | 0257 | 0301 | 0305 | M1.7 | 110 | III/1 | ||||
| 02 | 0120 | 0301 | 0350 | N14E1 | M1.7 | 1F | 110 | III/1VI/2CTM/1 | 2891 |
| LOC: approximate heliographic location | TYPE: radio burst type |
| XRAY: X-ray flare class | Cat: Catania sunspot group number |
| OP: optical flare class | NOAA: NOAA active region number |
| 10CM: peak 10 cm radio flux |
Geomagnetic Observations in Belgium (1 Nov 2021 - 7 Nov 2021)
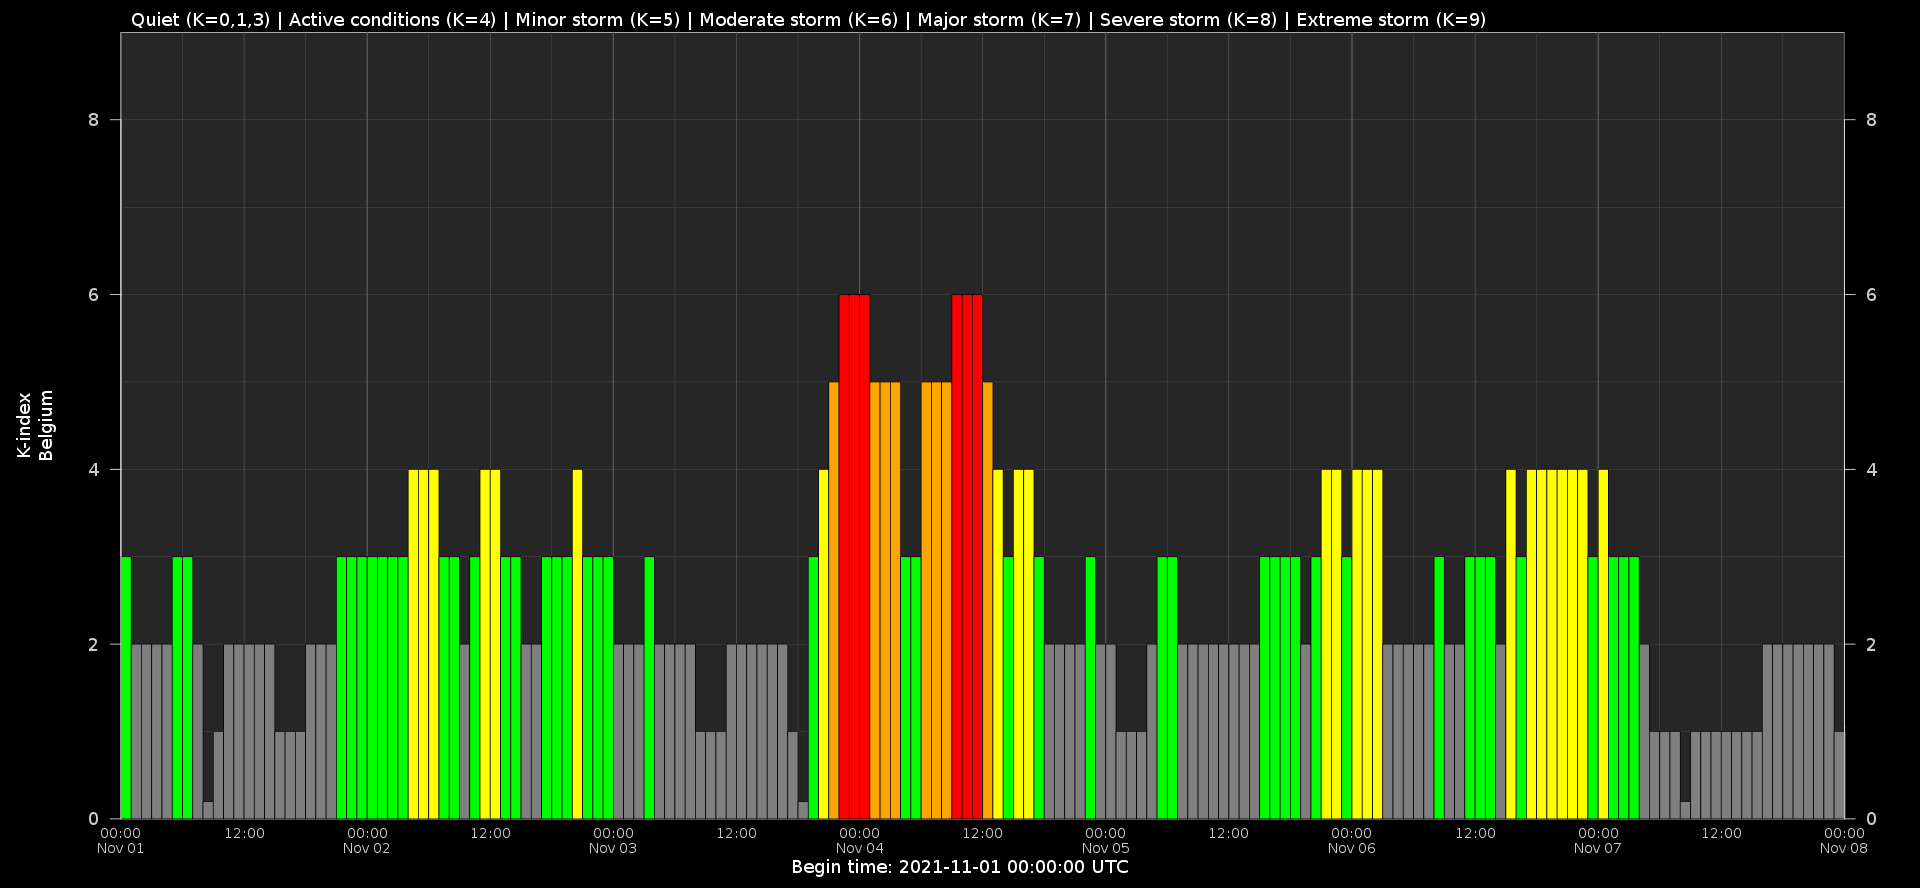
Local K-type magnetic activity index for Belgium based on data from Dourbes (DOU) and Manhay (MAB). Comparing the data from both measurement stations allows to reliably remove outliers from the magnetic data. At the same time the operational service availability is improved: whenever data from one observatory is not available, the single-station index obtained from the other can be used as a fallback system.
Both the two-station index and the single station indices are available here: http://ionosphere.meteo.be/geomagnetism/K_BEL/
PROBA2 Observations (1 Nov 2021 - 7 Nov 2021)
Solar Activity
Solar flare activity fluctuated from very low to moderate during the week.
In order to view the activity of this week in more detail, we suggest to go to the following website from which all the daily (normal and difference) movies can be accessed: https://proba2.oma.be/ssa
This page also lists the recorded flaring events.
A weekly overview movie can be found here (SWAP week 606). https://proba2.oma.be/swap/data/mpg/movies/weekly_movies/weekly_movie_2021_11_01.mp4
Details about some of this week's events can be found further below.
If any of the linked movies are unavailable they can be found in the P2SC movie repository here https://proba2.oma.be/swap/data/mpg/movies/
Monday Nov 01
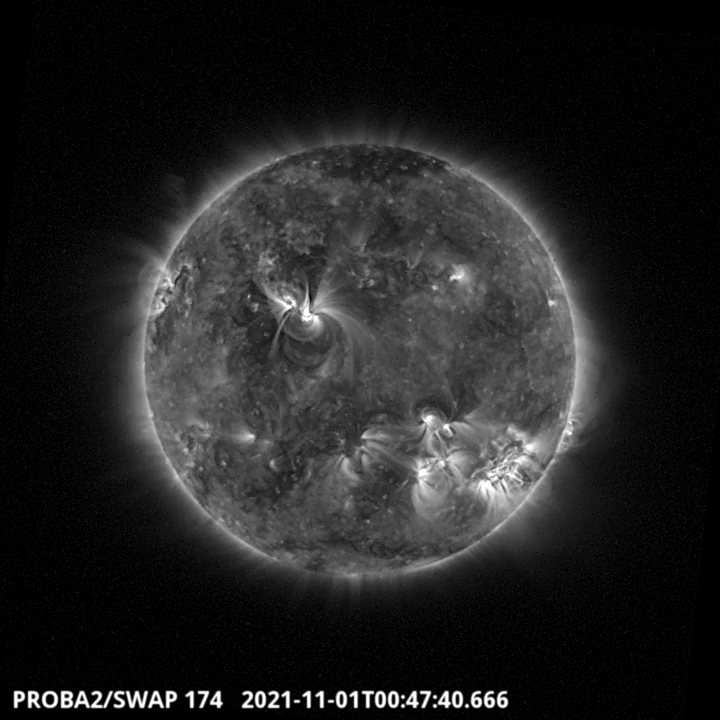
The South-West active region NOAA 2887 erupted around 00:48UT, as can be seen on the SWAP image above. The flare has been classified as M1.5. Find a movie of the events here (SWAP movie) https://proba2.oma.be/swap/data/mpg/movies/20211101_swap_movie.mp4
Tuesday Nov 02
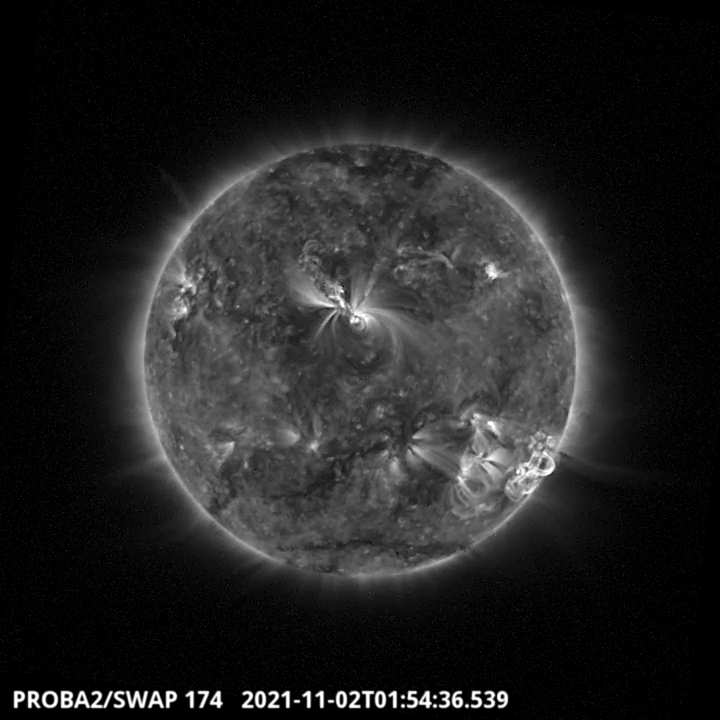
The second active region of the week was located on the North-East quadrant of the solar disk. This region, NOAA 2891, erupted around 1:54UT, the flare has been classified as M1.7. Find a movie of the events here (SWAP movie) https://proba2.oma.be/swap/data/mpg/movies/20211102_swap_movie.mp4
Review of geomagnetic activity
The week started with the passage of the ICME from the October 28 CME which was much less geoeffective than expected. Especially the solar wind speed did not really rise above 450km/s and hence geomagnetic effects remained at active levels.
This was followed by a stronger than expected influence of the high speed stream from the extension of the Northern polar coronal hole. By noon November 2, the solar wind speed reached well over 600 km/s and the magnetic field in the compression region reached over 15 nT late November 1, but was not oriented Southward and hence again only active geomagnetic conditions were recorded with the high speed stream.
In contrast, at 19:24UT November 3, a shock in the solar wind marked the arrival of the November 2 CME which caught up with earlier Earth directed CME of November 1. Solar wind speed went up well over 700 km/s with some peaks into 800 km/s and the magnetic field magnitude saw maxima of 24nT. Some periods of significant and sustained Southward magnetic field orientation, with peaks down to -18nT, were recorded.
Geomagnetic conditions reached minor to major storm levels (NOAA Kp reaching 7 while local K Dourbes reached 6). A slow return to slow solar wind conditions followed, with still several active geomagnetic episodes during this decay.
Geomagnetic Observations at Dourbes (1 Nov 2021 - 7 Nov 2021)
The SIDC Space Weather Briefing
The Space Weather Briefing presented by the forecaster on duty from Oct 31 to Nov 7. It reflects in images and graphs what is written in the Solar and Geomagnetic Activity report.

A pdf-version: https://www.stce.be/briefings/20211108_SWbriefing.pdf
The movie: https://www.stce.be/briefings/20211108_SWbriefing.m4v
Review of ionospheric activity (1 Nov 2021 - 7 Nov 2021)
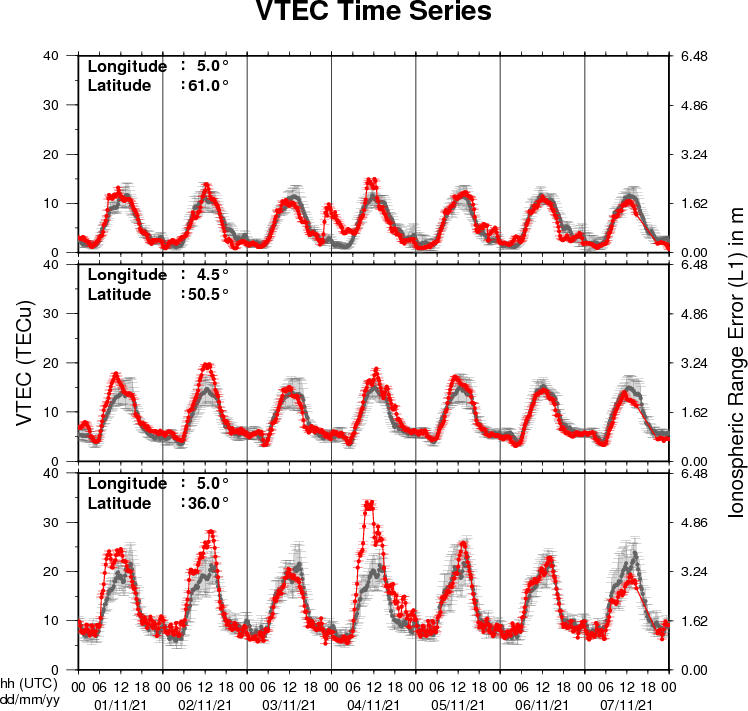
The figure shows the time evolution of the Vertical Total Electron Content (VTEC) (in red) during the last week at three locations:
a) in the northern part of Europe(N61°, 5°E)
b) above Brussels(N50.5°, 4.5°E)
c) in the southern part of Europe(N36°, 5°E)
This figure also shows (in grey) the normal ionospheric behaviour expected based on the median VTEC from the 15 previous days.
The VTEC is expressed in TECu (with TECu=10^16 electrons per square meter) and is directly related to the signal propagation delay due to the ionosphere (in figure: delay on GPS L1 frequency).
The Sun's radiation ionizes the Earth's upper atmosphere, the ionosphere, located from about 60km to 1000km above the Earth's surface.The ionization process in the ionosphere produces ions and free electrons. These electrons perturb the propagation of the GNSS (Global Navigation Satellite System) signals by inducing a so-called ionospheric delay.
See http://stce.be/newsletter/GNSS_final.pdf for some more explanations ; for detailed information, see http://gnss.be/ionosphere_tutorial.php
Action!
Check out our activity calendar: activities and encounters with the Sun-Space-Earth system and Space Weather as main theme. We provide occasions to get submerged in our world through educational, informative and instructive activities.
If you want your event in our calendar, contact us: stce_coordination at stce.be
in 2021
* November 18, ISSI Game Changers Online Seminars: Human Spaceflight - Earth Radiative Budget and Energy Imbalance Observed from Space
* November 22 - 26, Online SWx introductory Course (SWIC), organisation by the STCE - complete
* November 28, Dag van de wetenschap, Brussels, Belgium - STCE will bring 'Panic in the Space Weather Room' (Dutch)
* December 2, ISSI Game Changers Online Seminars: Tipping positive change to avoid climate tipping points
* December 3-4, Space Days at the Big Bang festival, STCE will bring 'Panic in the Space Weather Room' and 'Satellites'
* December 9, ISSI Game Changers Online Seminars: Space Weather
* December 16, ISSI Game Changers Online Seminars: Sursurface Life on Earth and on Other Planets in the Solar System
In 2022
* Januari 25, Public Lecture on the Solar Corona in EUV (Dutch), Urania, Hove, Belgium
* February 14-18, online Space Weather Introductory Course by SWEC, Space Weather Education Center - registrations are open
* February 22, Public Lecture on Space Weather and Aviation (Dutch), Urania, Hove, Belgium
* February 26, Public Lecture on Space Weather, Satellites and Aviation (Dutch), UGent Volkssterrenwacht Armand Pien, Gent, Belgium
* March 14-16, onsite (!) Space Weather Introductory Course by SWEC, Space Weather Education Center - registrations are open
* April 28, Public Lecture on SDO/EUI, Astropolis, Oostende, Belgium
* August 25, Public Lecture on Space Weather and Aviation, Astropolis, Oostende, Belgium
* October 24-28, 18th European Space Weather Week, Zagreb, Croatia
Check: https://www.stce.be/calendar