- Table of Content
- 1.M-class flares
- 2.12 years of su...
- 3.Obituary: Serg...
- 4.Review of sola...
- 5.Noticeable Sol...
- 6.International ...
- 7.PROBA2 Observa...
- 8.Review of geom...
- 9.Geomagnetic Ob...
- 10.The SIDC Space...
- 11.Review of iono...
- 12.Action!
2. 12 years of successful LYRA observations
3. Obituary: Sergio Cortesi
4. Review of solar activity
5. Noticeable Solar Events (27 Dec 2021 - 2 Jan 2022)
6. International Sunspot Number by SILSO
7. PROBA2 Observations
8. Review of geomagnetic activity
9. Geomagnetic Observations in Belgium
10. The SIDC Space Weather Briefing
11. Review of ionospheric activity
12. Action!
M-class flares
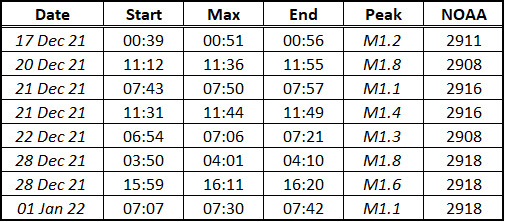
Coinciding with the enhanced sunspot activity of the last few weeks, the Sun also produced 8 M-class flares during this period. These were all low-level M-class flares, the strongest were M1.8 events on 20 and 28 December. The annotated graph underneath was produced with the STAFF tool (http://www.staff.oma.be/ ) and shows the x-ray flux as observed by GOES (https://www.swpc.noaa.gov/products/goes-x-ray-flux ) from 10 December until 2 January. The M1 flares are indicated by a red arrow.
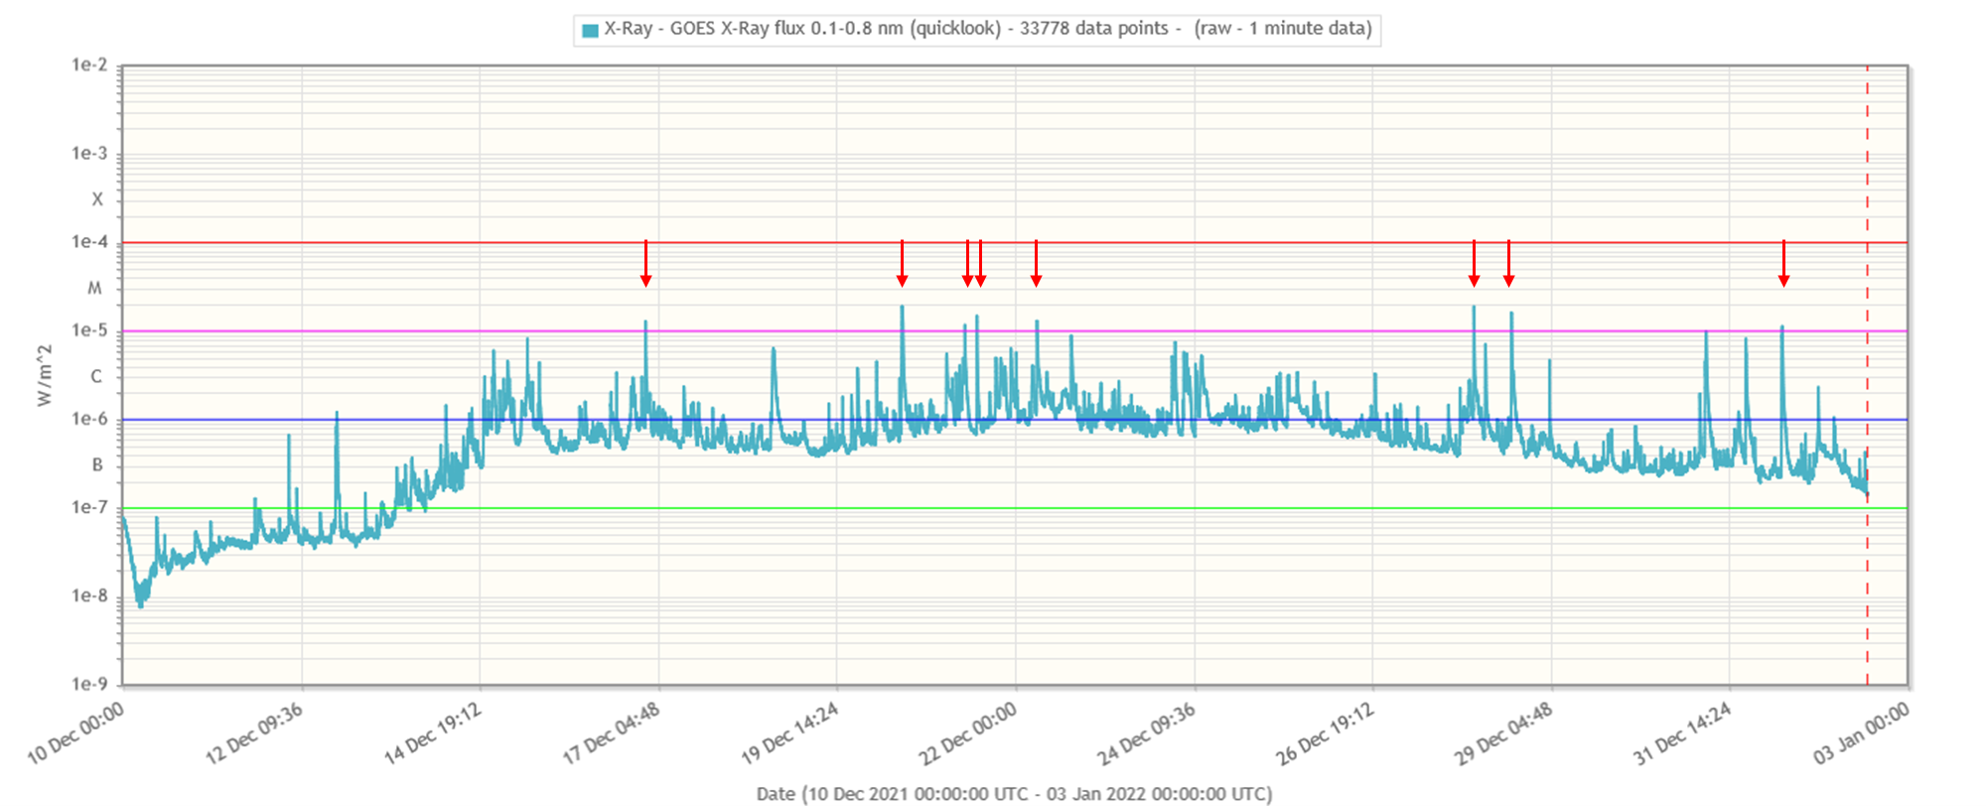
The table underneath provides some details on the M-class flares: the date, the timings of beginning, maximum and ending of the flare, the peak x-ray flux reached (GOES), and the NOAA number of the source region. None of these flares were impulsive (lasting less than 10 minutes) or long duration (lasting more than an hour) events.
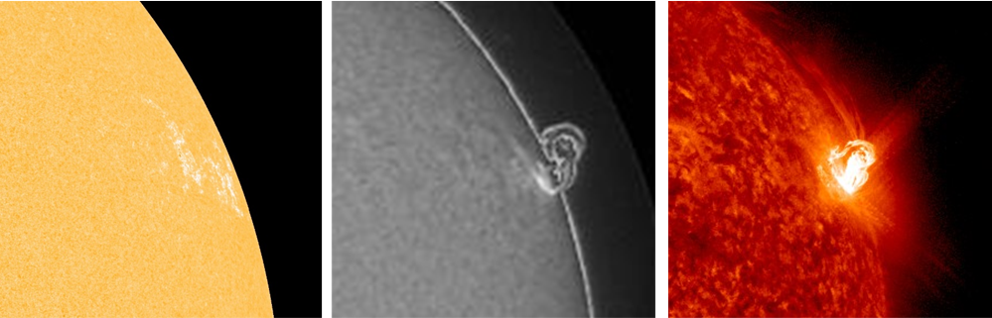
Of note is that the 2 M-class flares from NOAA 2916 were produced while this active region was still at the southeast limb, well before it started to grow in size and became the dominant sunspot region during the subsequent 2 weeks - when it only produced C-class events. It is also interesting to see that NOAA 2918 was virtually spotless when it produced the last of its 3 M-class flares. Underneath shows the region near the flare's peak time (1 January around 07:30UT) in white light, H-alpha (temperatures around 10.000 degrees) and in extreme ultraviolet (temperatures around 80.000 degrees), courtesy of respectively SDO/HMI, GONG/H-alpha, and SDO/AIA 304.
12 years of successful LYRA observations
12 years ago today, on 6 January 2010, the doors of the LYRA instrument were opened for the first time. LYRA is a radiometer that is composed of three units, which each observe in the same four channels: Lyman-alpha (120-123 nm), Herzberg (190-222 nm), Aluminium (17-80 nm) and Zirconium (6-20 nm). On the day of the first light, all three units were opened, and the first LYRA observations made then are shown below.
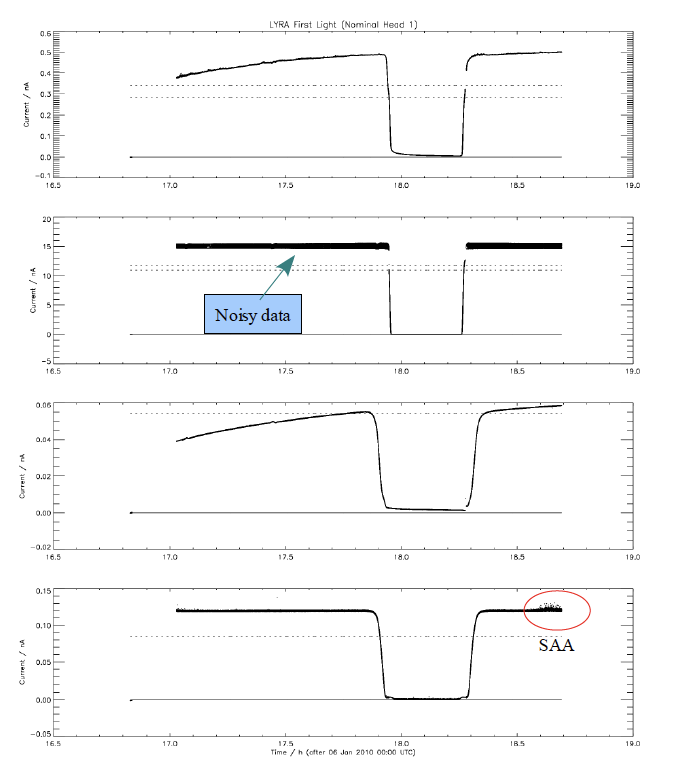
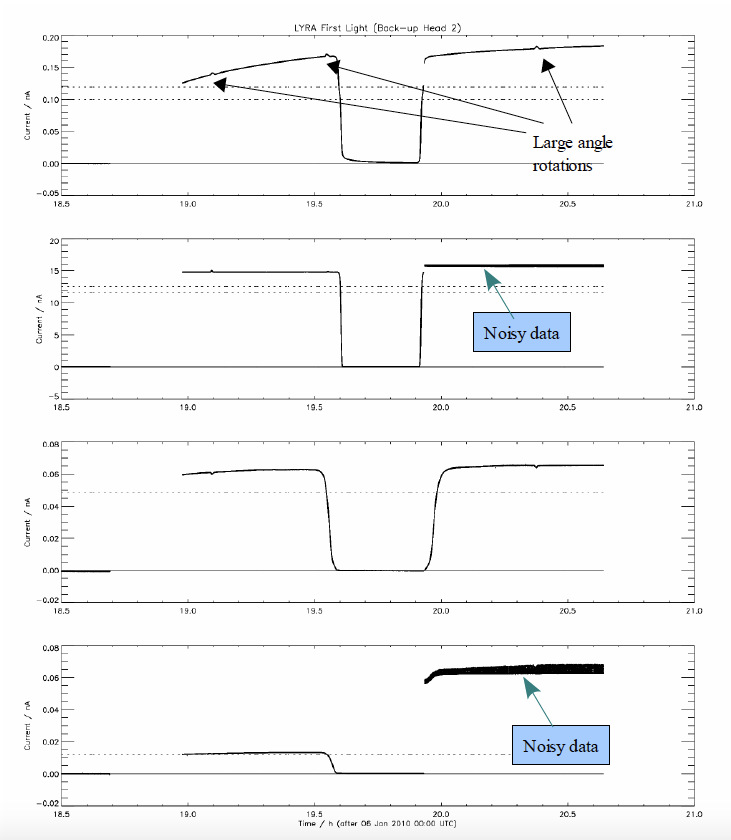
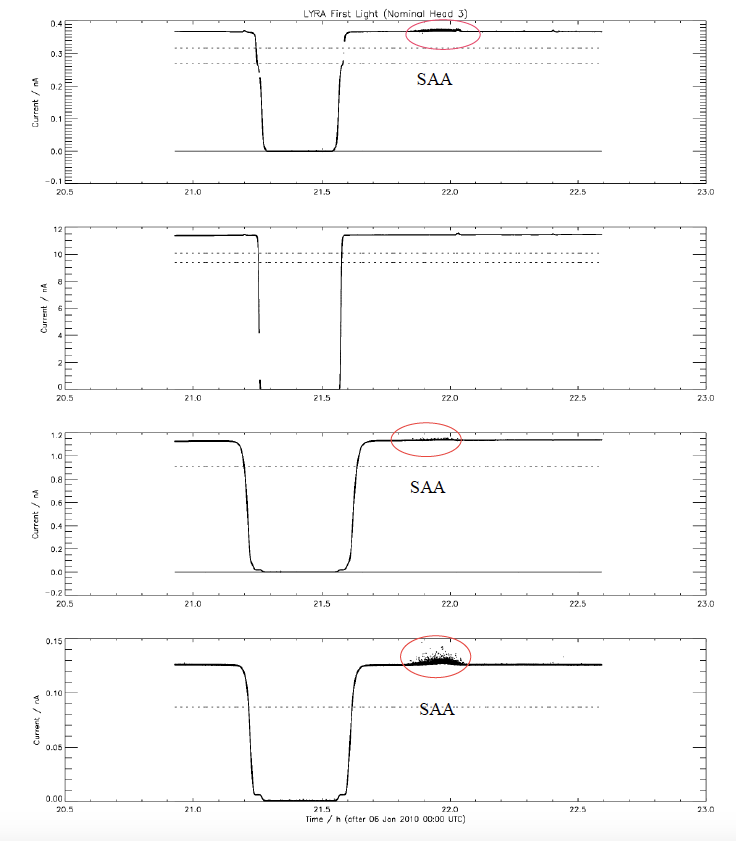
These observations immediately trained the LYRA scientists to cope with the different artefacts that we can find in LYRA data (which can easily be filtered out of the scientific data). The measurements in above show perturbations in the data due to electronic noise, to Large-Angle Rotations (where the PROBA2 satellite turns by 90 degrees to ensure its star trackers have an unobstructed view of the star field), and due to the South Atlantic Anomaly (when the satellite crosses this region it is exposed to increased radiation). There are also time periods where the measured signal falls to (almost) zero. These are periods of occultations, which occur roughly from October to February. During such an occultation, the Earth is between the satellite and the sun and LYRA is observing through the Earth's atmosphere (which absorbs UV light), causing the LYRA signal to dip for a few minutes.
LYRA's first flare
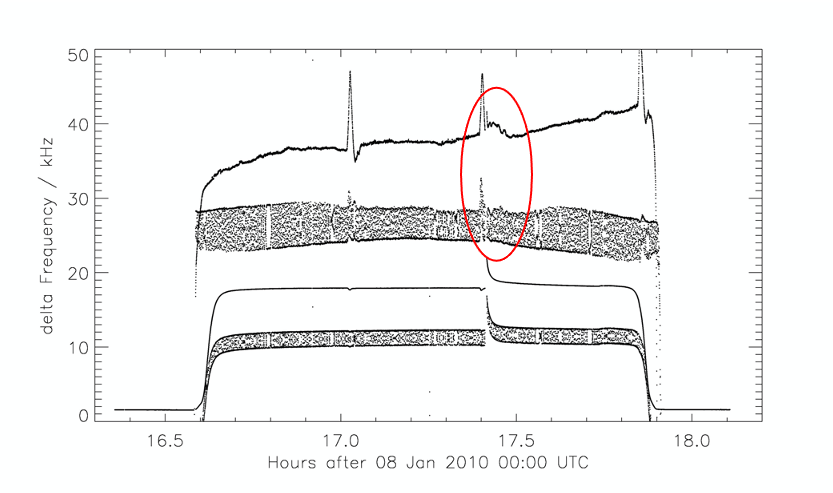
These first LYRA observations were taken during a deep solar minimum, so the Sun was not very active at this time. Nevertheless, a few A and B-class flares happened on that day. In fact, the strongest of these flares (a B5.5 flare) was strong enough to be detected by the instrument and happened during the First Light acquisition with Unit 2. So we could have captured our first LYRA flare on the very first day. Unfortunately, that flare happened in the middle of the occultation and was therefore missed. The first flare observation by LYRA was made just a few of days later, on 8 January 2010 and is shown below in Figure 2. This was a tiny flare, occurring around 17:25 UT, that did not even reach the B level and was thus not reported by GOES. It was most probably related to activity on the south-west limb of the Sun. This flare was actually best observed in the chromospheric channels (Lyman-alpha and Herzberg) and was thus LYRA's first Lyman-alpha flare. Many more followed after that one!
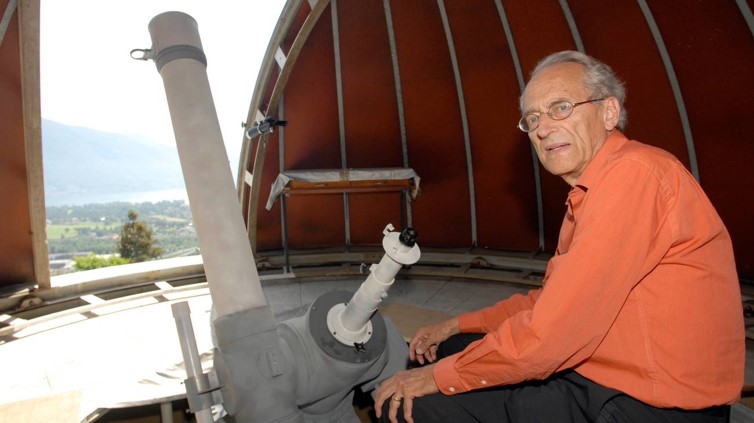
Obituary: Sergio Cortesi
On 18 December 2021, Sergio Cortesi passed away at the age of 89. He was one of the giants amidst solar observers, and essential in the continuity and stability of the International Sunspot Number. The text underneath was taken from SolarNews (NSO/Michele Bianda - https://solarnews.nso.edu/issue/2022/01-january-2022/ ). A documentary on the solar observations done at Specola Solare Ticinese was realized in 2020 by RSI/Superalbum (Valeria Bruni - https://www.rsi.ch/news/ticino-e-grigioni-e-insubria/Morto-Sergio-Cortesi-14955987.html ) and can be found at https://www.rsi.ch/play/tv/redirect/detail/12770538 (Italian). For his contributions, minor planet 91428 was named after him (https://en.wikipedia.org/wiki/Meanings_of_minor_planet_names:_91001%E2%80%9392000#428 ).
Sergio Cortesi, born 1932, passed away on December 18, 2021.
Sergio Cortesi worked at Specola Solare Ticinese, since it was was built in 1957 as an external station south of the Alps, belonging to the Swiss Federal Observatory of ETH Zurich, under the direction of Prof. Max Waldmeier. Sergio did the observations to determine the sunspot number and sent the data, until 1980, to ETH Zurich, where the official Zurich Sunspot Number was determined (which is nowadays referred to as the Solar Sunspot Number SSN). After the retirement of Waldmeier in 1980, ETH decided to discontinue this service, and the new director, Prof. Jan Olof Stenflo, was able to find a solution by transferring the role to the Observatoire Royale de Bruxelles, an institute directed by Prof. André Koeckelenbergh. Since 1981 Specola Solare, from then on managed by a local association, became the pilot station of Brussels.
Sergio Cortesi was the key person who could guarantee the continuity and stability of the SSN and minimize discontinuities in the transition, thanks to his profound experience and knowledge that he had acquired while working with Waldmeier. Engineer by education, Sergio showed a deep interest in natural sciences, in particular in astronomy. Thanks to the employment at Specola Solare his hobby became his work. He transferred his know-how to his successor, Marco Cagnotti, but after his retirement he still continued to make sunspot drawings, to observe the sun for a total of 64 years (his last drawing was performed on December 4, 2021), and to provide historical support, in particular by giving fundamental information during the transfer of crucial documents to the ETH library. His engagement in outreach was also extensive, including popular teaching and presiding over the local astronomical society.
Sergio was known for his very friendly character and deep humanity. He will be greatly missed.
Credits: tipress
Review of solar activity
The week was dominated by NOAA region 2918 which produced 3 M flares, the largest an M1.8 flare. The region showed some renewed emergence in the leading area but by the end of the week it was entirely in decay. The other most prominent region on disk was NOAA region 2916 which, despite its size and complexity, remained mostly quiet. Some more beta regions also developed on disk but were not very remarkable.
No Earth directed coronal mass ejections have been observed in coronagraph data.
The greater than 10 MeV proton flux was at nominal levels throughout the week.
The greater than 2MeV electron flux was initially enhanced but since December 28 (after the arrival of the high speed stream) remained under the 1000 pfu threshold. The 24h electron fluence likewise decreased from moderate to normal levels and remained at normal levels for the rest of the week.
Noticeable Solar Events (27 Dec 2021 - 2 Jan 2022)
| DAY | BEGIN | MAX | END | LOC | XRAY | OP | 10CM | TYPE | Cat | NOAA |
| 28 | 0350 | 0401 | 0410 | M1.8 | 96 | 2918 | ||||
| 28 | 1559 | 1611 | 1620 | N20W28 | M1.6 | SF | 96 | 2918 | ||
| 01 | 0707 | 0730 | 0742 | M1.1 | 96 | 2918 |
| LOC: approximate heliographic location | TYPE: radio burst type |
| XRAY: X-ray flare class | Cat: Catania sunspot group number |
| OP: optical flare class | NOAA: NOAA active region number |
| 10CM: peak 10 cm radio flux |
International Sunspot Number by SILSO
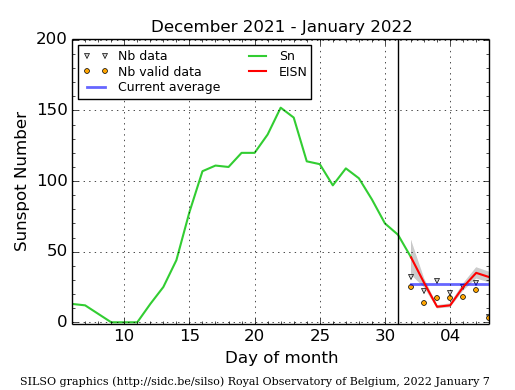
The daily Estimated International Sunspot Number (EISN, red curve with shaded error) derived by a simplified method from real-time data from the worldwide SILSO network. It extends the official Sunspot Number from the full processing of the preceding month (green line), a few days more than one solar rotation. The horizontal blue line shows the current monthly average. The yellow dots give the number of stations that provided valid data. Valid data are used to calculate the EISN. The triangle gives the number of stations providing data. When a triangle and a yellow dot coincide, it means that all the data is used to calculate the EISN of that day.
PROBA2 Observations
Solar Activity
Solar flare activity fluctuated from very low to moderate during the week.
In order to view the activity of this week in more detail, we suggest to go to the following website from which all the daily (normal and difference) movies can be accessed: https://proba2.oma.be/ssa
This page also lists the recorded flaring events.
A weekly overview movie can be found here (SWAP week 614). https://proba2.oma.be/swap/data/mpg/movies/weekly_movies/weekly_movie_2021_12_27.mp4
Details about some of this week's events can be found further below.
If any of the linked movies are unavailable they can be found in the P2SC movie repository here https://proba2.oma.be/swap/data/mpg/movies/
Tuesday Dec 28
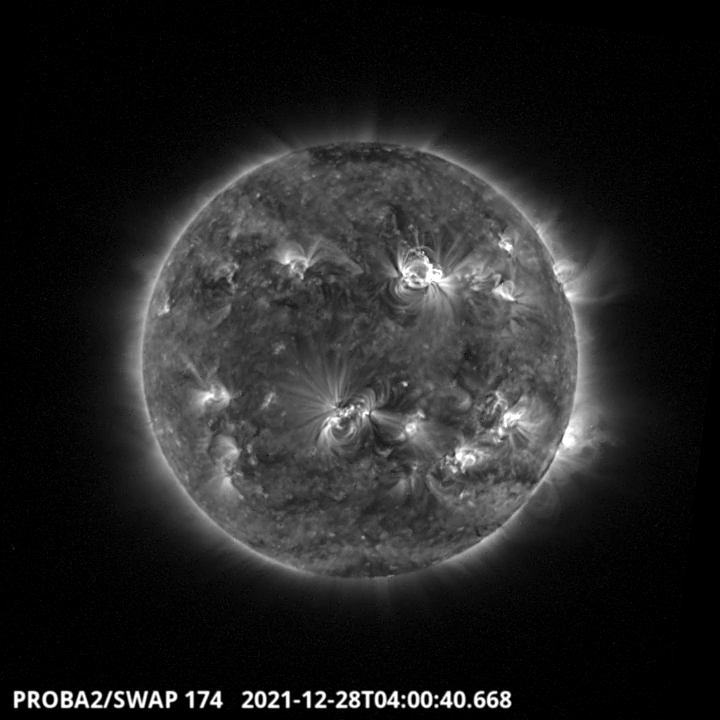
A large flow erupted in the West of the Northern Hemisphere around 4:00 UT as it is shown in the SWAP image above. This flow is linked to the M1.8 flare produced by the NOAA active region 2918. Find a movie of the events here (SWAP movie) https://proba2.oma.be/swap/data/mpg/movies/20211228_swap_movie.mp4
Review of geomagnetic activity
In the solar wind at L1, we saw the passage of 3 consecutive solar wind enhancements related to coronal hole high speed streams. The first was related to the extension of the Northern polar coronal hole. The signature in the solar wind started with a weak shock at 8:38UT December 27. The magnetic field magnitude reached a peak of just over 15 nT while the speed passed just over 500km/s.
The second enhancement was related to a positive polarity equatorial coronal hole and arrived around midnight December 29-30, when the magnetic field peaked over 20nT. The solar wind speed eventually barely reached the 500km/s mark.
The third enhancement (related to another positive polarity equatorial coronal hole) then started on January 1 in the form of two fairly sudden speed enhancements, reaching eventually over 550km/s ,but with magnetic field magnitude remaining below 10nT.
Geomagnetic conditions were mostly quiet to unsettled with active periods only reached at the start of the first high speed stream (noon December 27) and during the third high speed stream (early January 1 and late January 2).
Geomagnetic Observations in Belgium
Local K-type magnetic activity index for Belgium based on data from Dourbes (DOU) and Manhay (MAB). Comparing the data from both measurement stations allows to reliably remove outliers from the magnetic data. At the same time the operational service availability is improved: whenever data from one observatory is not available, the single-station index obtained from the other can be used as a fallback system.
Both the two-station index and the single station indices are available here: http://ionosphere.meteo.be/geomagnetism/K_BEL/

The SIDC Space Weather Briefing
The Space Weather Briefing presented by the forecaster on duty from Dec 27 to Jan 2. It reflects in images and graphs what is written in the Solar and Geomagnetic Activity report.
A pdf-version: https://stce.be/briefings/20220103_SWbriefing.pdf
The movie: https://stce.be/briefings/20220103_SWbriefing.m4v
Review of ionospheric activity

The figure shows the time evolution of the Vertical Total Electron Content (VTEC) (in red) during the last week at three locations:
a) in the northern part of Europe(N61, 5E)
b) above Brussels(N50.5, 4.5E)
c) in the southern part of Europe(N36, 5E)
This figure also shows (in grey) the normal ionospheric behaviour expected based on the median VTEC from the 15 previous days.
The VTEC is expressed in TECu (with TECu=10^16 electrons per square meter) and is directly related to the signal propagation delay due to the ionosphere (in figure: delay on GPS L1 frequency).
The Sun's radiation ionizes the Earth's upper atmosphere, the ionosphere, located from about 60km to 1000km above the Earth's surface.The ionization process in the ionosphere produces ions and free electrons. These electrons perturb the propagation of the GNSS (Global Navigation Satellite System) signals by inducing a so-called ionospheric delay.
See http://stce.be/newsletter/GNSS_final.pdf for some more explanations ; for detailed information, see http://gnss.be/ionosphere_tutorial.php
Action!
Check out our activity calendar: activities and encounters with the Sun-Space-Earth system and Space Weather as the main theme. We provide occasions to get submerged in our world through educational, informative and instructive activities.
If you want your event in our calendar, contact us: stce_coordination at stce.be
In 2022
* January 25, Public Lecture on the Solar Corona in EUV (Dutch), Urania, Hove, Belgium
* February 14-18, online Space Weather Introductory Course by SWEC, Space Weather Education Center - registrations are open
* February 22, Public Lecture on Space Weather and Aviation (Dutch), Urania, Hove, Belgium
* February 26, Public Lecture on Space Weather, Satellites and Aviation (Dutch), UGent Volkssterrenwacht Armand Pien, Gent, Belgium
* March 14-16, onsite (!) Space Weather Introductory Course by SWEC, Space Weather Education Center - registrations are open
* April 28, Public Lecture on SDO/EUI, Astropolis, Oostende, Belgium
* August 25, Public Lecture on Space Weather and Aviation, Astropolis, Oostende, Belgium
* October 24-28, 18th European Space Weather Week, Zagreb, Croatia
Check: https://www.stce.be/calendar