- Table of Content
- 1.Something's lu...
- 2.SSEA deadline ...
- 3.Review of sola...
- 4.Review of geom...
- 5.PROBA2 Observa...
- 6.The Internatio...
- 7.Noticeable Sol...
- 8.Geomagnetic Ob...
- 9.The SIDC Space...
- 10.Review of iono...
- 11.Action!
2. SSEA deadline for early-bird registration is coming up
3. Review of solar activity
4. Review of geomagnetic activity
5. PROBA2 Observations
6. The International Sunspot Number by Silso
7. Noticeable Solar Events (10 Jan 2022 - 16 Jan 2022)
8. Geomagnetic Observations in Belgium
9. The SIDC Space Weather Briefing
10. Review of ionospheric activity
11. Action!
Something's lurking behind the solar limb...
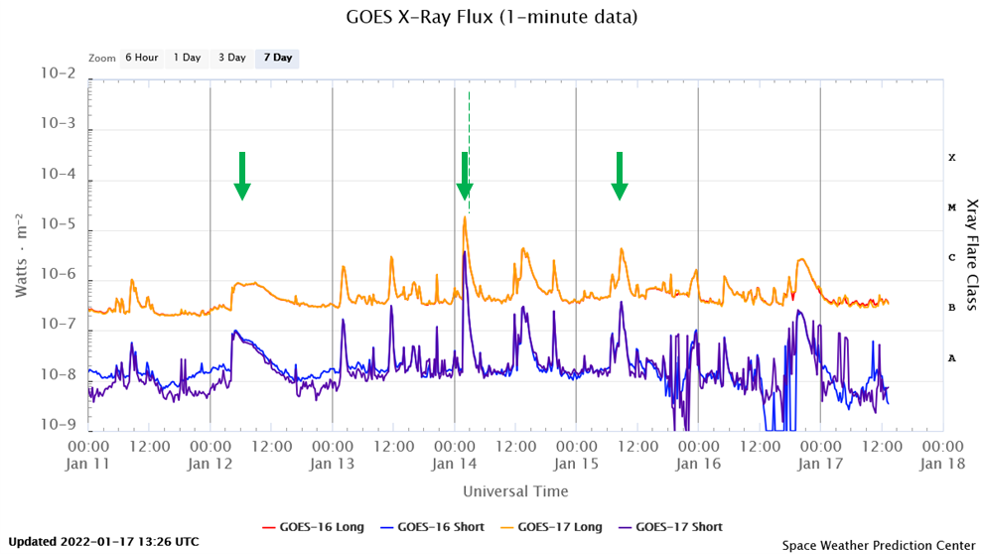
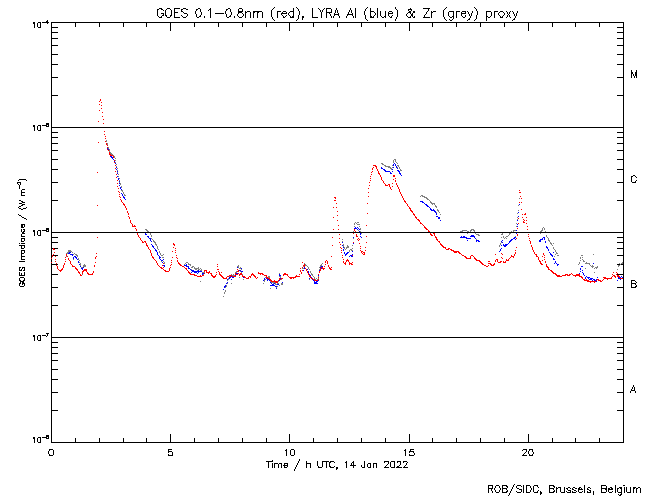
Last week saw again the presence of several sunspot regions which were relatively small and not very active. Meanwhile, from 12 January onwards, an active region behind the northeast solar limb manifested itself in extreme ultraviolet (EUV) imagery by producing several small flares. As the solar disk occulted most of the flaring area, this meant the flares must have been quite a bit stronger than the x-ray peak flux suggested. Underneath is a plot with last week's GOES x-ray flux (https://www.swpc.noaa.gov/products/goes-x-ray-flux ). The flares from the active region (NOAA 2932 as it eventually got numbered) which are further discussed in this news item are indicated with an arrow. The dashed line indicates the approximate timing when the region started to rotate over the solar limb, about 06UT on 14 January.
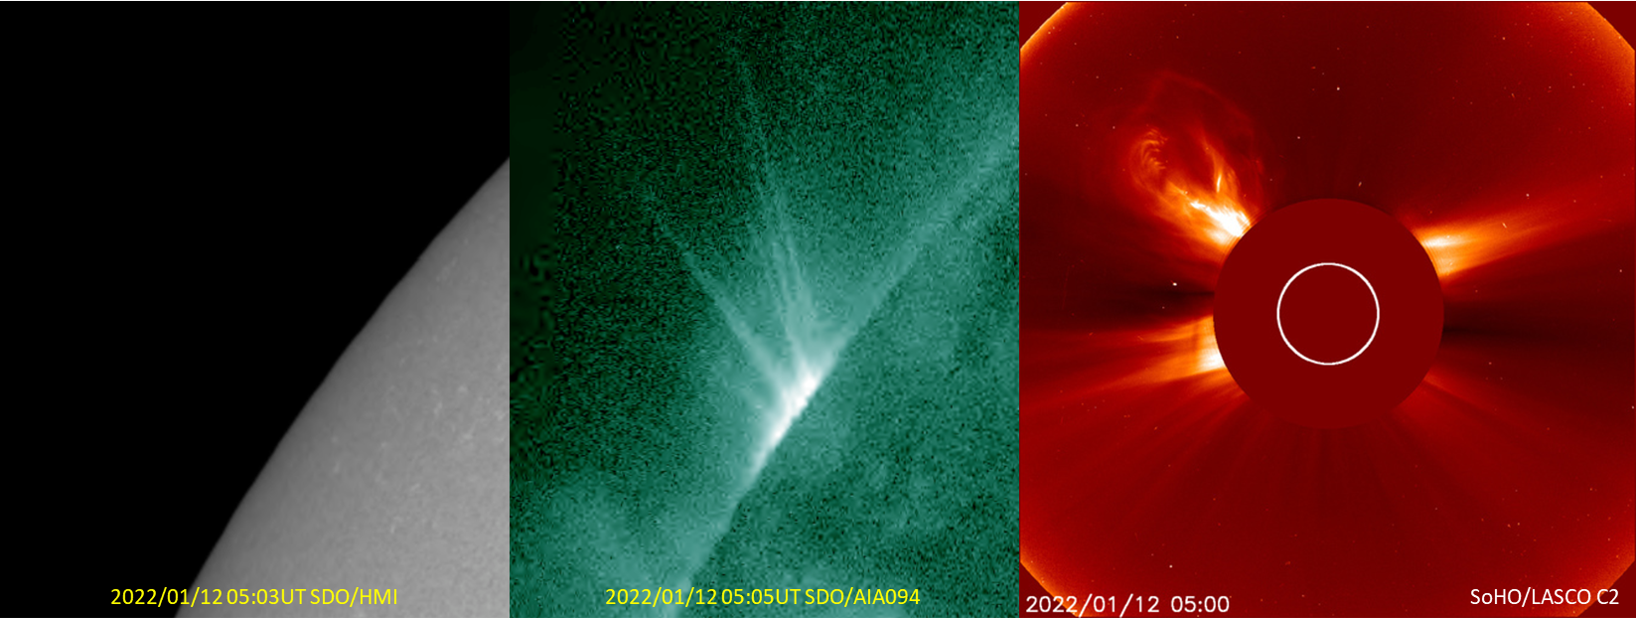
Some movie clips and some additional images can be found in the online version of this news item at https://www.stce.be/news/569/welcome.html The clips are from SDO/AIA094 (https://sdo.gsfc.nasa.gov/data/aiahmi/ ), and the stills are from SDO/HMI, SDO/AIA094, and SOHO/LASCO C2 (https://sohowww.nascom.nasa.gov/ ).
The region announced itself with a B8 flare while it was still 2 days behind the solar limb. Hence, the true peak flux was certainly higher, most likely an upper M-class flare. There are several reasons for assuming this.
- First, the presence of long-duration post-flare loops with supra-arcade downflows (SADs, see e.g. this STCE news item at https://www.stce.be/news/562/welcome.html ). These SADs usually only manifest themselves in M-class or stronger events.
- Second, one can apply the method by Chertok et al. (2015 - https://link.springer.com/article/10.1007%2Fs11207-015-0738-4 ) on the STEREO-A/EUVI imagery (https://stereo-ssc.nascom.nasa.gov/ ). This method is a proxy relating the observed maximum width of the flare's streak in EUV to the GOES x-ray peak of the flare. In this case, the maximum width of the observed streak (around 04:38UT) indicates a peak flux in the M5-M8 range (corrected for the GOES rescaling as outlined by NOAA/NGDC (https://www.ngdc.noaa.gov/stp/satellite/goes/index.html ).
- Then there was the increase in the 10 MeV proton flux by STEREO-A's IMPACT instrument, starting early on 13 January and still in progress around 16 January (see the STEREO webpage at https://stereo-ssc.nascom.nasa.gov/browse/2022/01/15/insitu_7day.shtml). Though the enhancement is rather mild (a factor 10-20 above the nominal background flux), the spacecraft was not favorably connected to the source region as it was located at the Sun's east limb as seen from STEREO-A. So, enhancing the proton flux from that location is quite an accomplishment and testifies of a strong energetic event. Note that the partial halo coronal mass ejection (CME) associated with the eruption had a speed of at least 600 km/s, not so incredibly fast. However, analysis of the coronagraphic imagery seems to indicate that the main portion of the CME (to the northeast) moved considerably faster, most likely with speeds between 1000 and 1500 km/s (CACTus, https://wwwbis.sidc.be/cactus/).
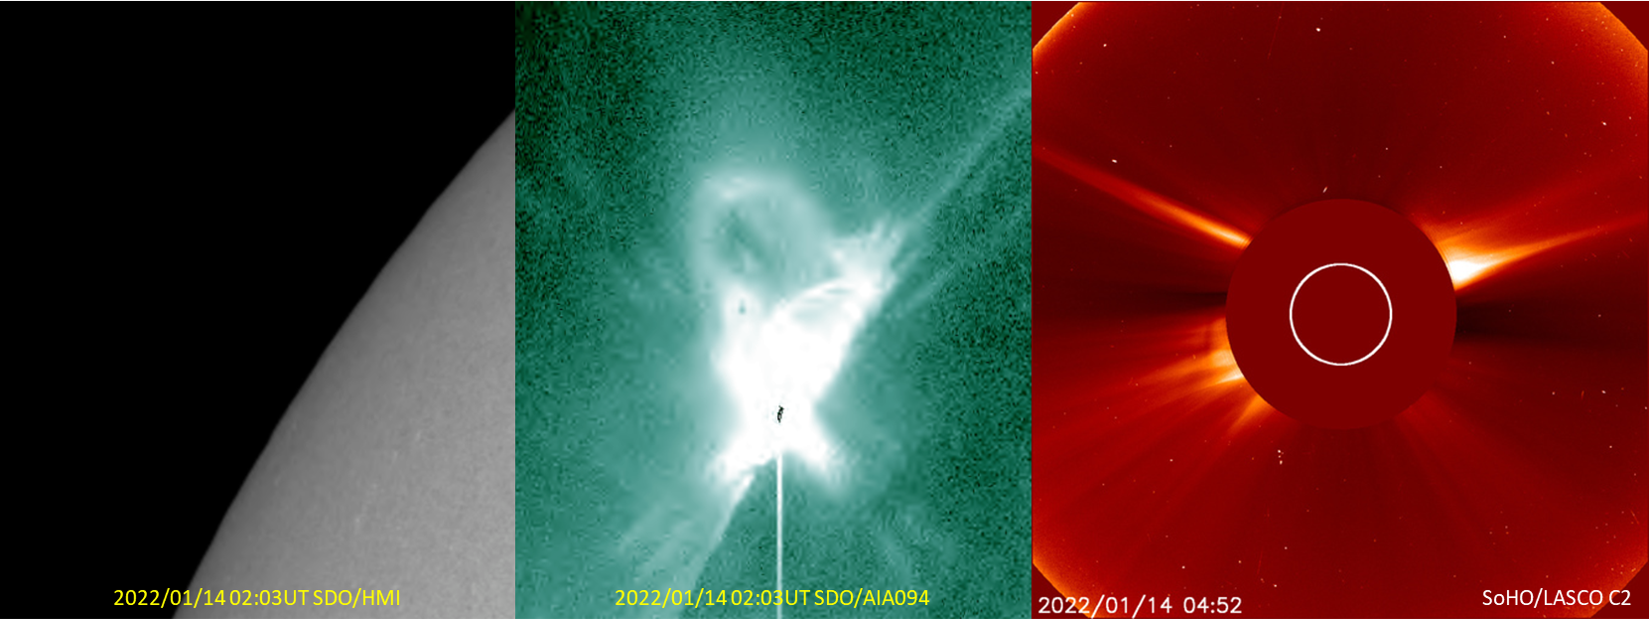
NOAA 2932 produced its strongest flare (that is: as measured by GOES) on 14 January when it was still behind the solar limb, but only barely so because a few hours later the first small spots from this region became visible. The flare peak was M1.8 and reached at 02:03UT. The Chertok methodology indicates that the true strength was not much stronger, between M2 and M3. That is considerably weaker than the 12 January event. There was also no proton enhancement recorded by the STEREO-A spacecraft. Interestingly too, the associated CME had a completely different outlook, and was quite narrow (jet-like), suggesting changes in the magnetic topology of the region.
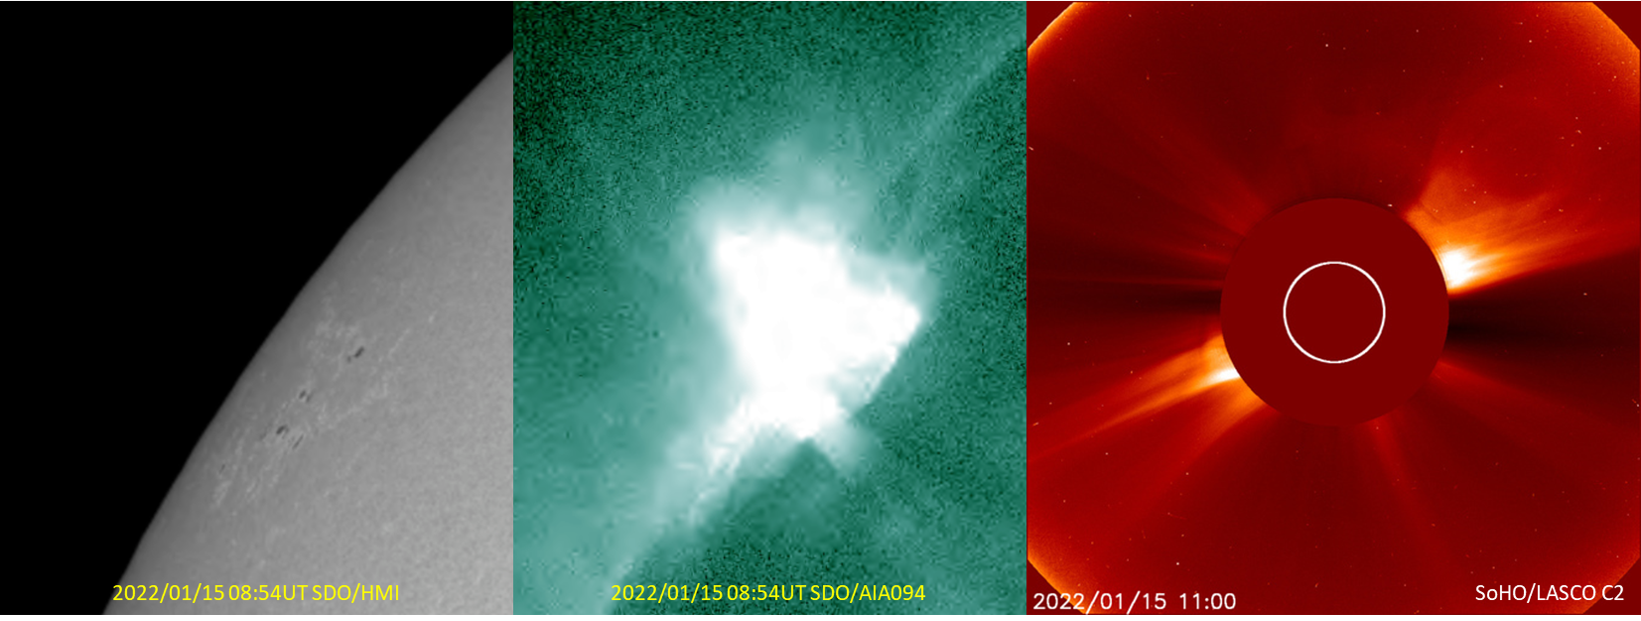
The strongest flare while NOAA 2932 was visible on disk was a C4 flare on 15 January. By that time, it was clear the sunspot region was not very complex and had simplified considerably from what it probably was a few days before, with only some small spots remaining. No obvious CME associated with the eruption was observed. The region further decayed and became spotless on 18 January, crushing all hopes to have fireworks similar to the week before. Maybe better next time.
SSEA deadline for early-bird registration is coming up
Tickets for the 4th Symposium on Space Educational Activities are available at a discounted early-bird price until January 31st! Hurry up and do not miss the opportunity, by registering and paying before the end of the month, to benefit from these early-bird fees, applied to standard tickets, student tickets, and stands. Attendance, catering, social events and visits, gala dinner, and perks are included!
The STCE is selected to present at the SSEA, which will be hosted by the Universitat Politecnica de Catalunya - BarcelonaTech in Barcelona (Spain), next 27-29th April 2022. SSEA provides a forum for university students, professionals working in education, and other young professionals to present and discuss their experiences organising, running and/or participating in educational activities related to space.
Sponsoring this event, STCE will promote its educational and outreach activities, with a special focus on the Space Weather Introductory Course. The SWIC familiarises space weather advisory staff, both military and civilian, with the science behind space weather as well as the services offered by our forecaster centre.
Besides the one from STCE, over 350 high-quality abstracts were received from more than 50 different countries. The scientific committee had the hard task of selecting from these which would be presented at the conference. They have compiled a preliminary program which will come online early February.
Check the SSEA webpage for this program and registration: https://sseasymposium.org/
We hope to meet you there!
Review of solar activity
Solar flaring activity was at very low levels with the exception of an M1.7 flare at 14 Jan 01:15 UT. There were nine Active Regions (ARs) on the disk over the course of the week, most of these were magnetically simple and produced only B-class flares. NOAA AR 2932 produced the M-class flare while still well behind the solar limb and most of the C-class activity. NOAA ARs 2924, 2925, 2927, 2930, and 2932 produced C-class flares, while the rest did not produce any noticeable activity over the course of last week.
Three geo-effective Coronal Mass Ejections (CMEs) were detected by LASCO-C2/SOHO on 14, 15, and 16 Jan. All three seemed to have an Earth directed component.
The greater than 10 MeV proton flux was at nominal levels. The greater than 2 MeV electron flux was at background levels from for the whole week with the exception of 16 Jan 15:00 - 20:00 UT, when it marginally exceeded the 1000 pfu alert threshold. The electron fluence at nominal levels during the past week.
Review of geomagnetic activity
The Solar Wind (SW) conditions, as observed by DSCOVR and ACE, were typical of a slow SW regime at the start of the week. The arrival of an Interplanetary Coronal Mass Ejection (ICME) on 14 Jan caused an increase in the main SW parameters (namely, speed, density and magnetic field strength). Nonetheless, by the time the disturbance from the ICME started to slowly decline, a High Speed Stream (HSS) arrived on 15 Jan 14:30 UT. The SW speed reached 640 km/s, the total magnetic field (Btot) increased to 20 nT, and its Bz component varied between -18 and 17 nT. The SW effects from the HSS remained until the end of the week.
Geomagnetic conditions were quiet to moderate (NOAA Kp index up to 3) during the first days of the week. However, the arrival of the ICME on 14 Jan caused the NOAA Kp index to reach storm levels (Kp=6) for the synoptic period of 14 Jan 21:00-24:00 UT. By the time the HSS arrived, on 15 Jan, the geomagnetic conditions were back to quiet level. The arrival of the HSS brought a minor storm (NOAA Kp index 5) for the synoptic period of 15 Jan 21:00-24:00 UT. The last day of the week had quiet to active geomagnetic conditions (NOAA Kp 2-4).
PROBA2 Observations
Solar Activity
Solar flare activity fluctuated from very low to moderate during the week.
In order to view the activity of this week in more detail, we suggest to go to the following website from which all the daily (normal and difference) movies can be accessed: https://proba2.oma.be/ssa
This page also lists the recorded flaring events.
A weekly overview movie can be found here (SWAP week 616). https://proba2.sidc.be/swap/data/mpg/movies/weekly_movies/weekly_movie_2022_01_10.mp4
Details about some of this week's events can be found further below.
If any of the linked movies are unavailable they can be found in the P2SC movie repository here https://proba2.sidc.be/swap/data/mpg/movies/
Wednesday Jan 12

A flux rope shot up from behind the sun's northeastern limb around 4:27 UT.
Find a movie of the events here (SWAP movie) https://proba2.oma.be/swap/data/mpg/movies/20220112_swap_movie.mp4
Friday Jan 14

The largest flare of the week is classified as M1.8. The flow is visible in North Eastern Quadrant
at the limb around 2:10 UT - SWAP image. Find a movie of the events here (SWAP movie) https://proba2.oma.be/swap/data/mpg/movies/20220114_swap_movie.mp4
The M1.8 class flare has also been recorded by LYRA. Find an image of the event here https://proba2.sidc.be/lyra/data/GoesLyra/images/GoesLyra20220114.png
The International Sunspot Number by Silso
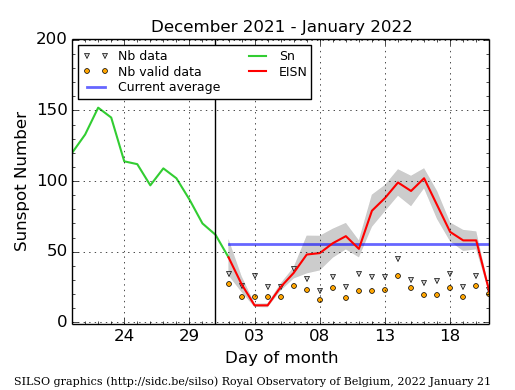
The daily Estimated International Sunspot Number (EISN, red curve with shaded error) derived by a simplified method from real-time data from the worldwide SILSO network. It extends the official Sunspot Number from the full processing of the preceding month (green line), a few days more than one solar rotation. The horizontal blue line shows the current monthly average. The yellow dots gives the number of stations that provided valid data. Valid data are used to calculate the EISN. The triangle gives the number of stations providing data. When a triangle and a yellow dot coincide, it means that all the data is used to calculate the EISN of that day.
Noticeable Solar Events (10 Jan 2022 - 16 Jan 2022)
| DAY | BEGIN | MAX | END | LOC | XRAY | OP | 10CM | TYPE | Cat | NOAA |
| 14 | 0147 | 0203 | 0214 | M1.8 |
| LOC: approximate heliographic location | TYPE: radio burst type |
| XRAY: X-ray flare class | Cat: Catania sunspot group number |
| OP: optical flare class | NOAA: NOAA active region number |
| 10CM: peak 10 cm radio flux |
Geomagnetic Observations in Belgium

Local K-type magnetic activity index for Belgium based on data from Dourbes (DOU) and Manhay (MAB). Comparing the data from both measurement stations allows to reliably remove outliers from the magnetic data. At the same time the operational service availability is improved: whenever data from one observatory is not available, the single-station index obtained from the other can be used as a fallback system.
Both the two-station index and the single station indices are available here: http://ionosphere.meteo.be/geomagnetism/K_BEL/
The SIDC Space Weather Briefing
The Space Weather Briefing presented by the forecaster on duty from Jan 09 to 16. It reflects in images and graphs what is written in the Solar and Geomagnetic Activity report.
A pdf-version: https://www.stce.be/briefings/20220117_SWbriefing.pdf
The movie: https://www.stce.be/briefings/20220117_SWbriefing.m4v
Review of ionospheric activity
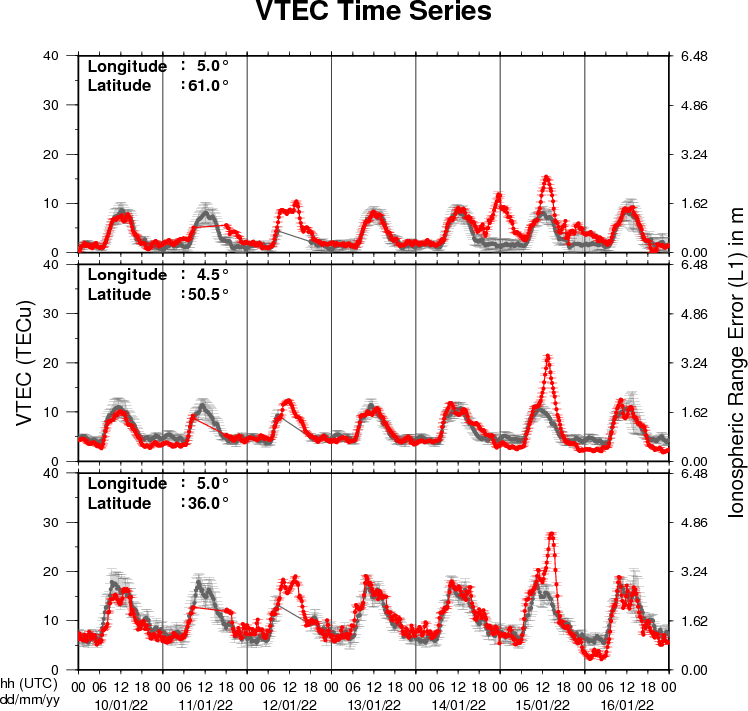
The figure shows the time evolution of the Vertical Total Electron Content (VTEC) (in red) during the last week at three locations:
a) in the northern part of Europe(N 61deg E 5deg)
b) above Brussels(N 50.5deg, E 4.5 deg)
c) in the southern part of Europe(N 36 deg, E 5deg)
This figure also shows (in grey) the normal ionospheric behaviour expected based on the median VTEC from the 15 previous days.
The VTEC is expressed in TECu (with TECu=10^16 electrons per square meter) and is directly related to the signal propagation delay due to the ionosphere (in figure: delay on GPS L1 frequency).
The Sun's radiation ionizes the Earth's upper atmosphere, the ionosphere, located from about 60km to 1000km above the Earth's surface.The ionization process in the ionosphere produces ions and free electrons. These electrons perturb the propagation of the GNSS (Global Navigation Satellite System) signals by inducing a so-called ionospheric delay.
See http://stce.be/newsletter/GNSS_final.pdf for some more explanations ; for detailed information, see http://gnss.be/ionosphere_tutorial.php
Action!
Check out our activity calendar: activities and encounters with the Sun-Space-Earth system and Space Weather as the main theme. We provide occasions to get submerged in our world through educational, informative and instructive activities.
If you want your event in our calendar, contact us: stce_coordination at stce.be
* January 25, Public Lecture on the Solar Corona in EUV (Dutch), Urania, Hove, Belgium
* February 14-18, online Space Weather Introductory Course by SWEC, Space Weather Education Center - registrations are open
* February 22, Public Lecture on Space Weather and Aviation (Dutch), Urania, Hove, Belgium
* February 26, Public Lecture on Space Weather, Satellites and Aviation (Dutch), UGent Volkssterrenwacht Armand Pien, Gent, Belgium
* March 14-16, onsite (!) Space Weather Introductory Course by SWEC, Space Weather Education Center - registrations are open
* April 28, Public Lecture on SDO/EUI, Astropolis, Oostende, Belgium
* August 25, Public Lecture on Space Weather and Aviation, Astropolis, Oostende, Belgium
* October 24-28, 18th European Space Weather Week, Zagreb, Croatia
Check: https://www.stce.be/calendar