- Table of Content
- 1.ROB/USET teles...
- 2.Solar Orbiter ...
- 3.Review of sola...
- 4.International ...
- 5.PROBA2 Observa...
- 6.Noticeable Sol...
- 7.Geomagnetic Ob...
- 8.The SIDC Space...
- 9.Review of iono...
- 10.Action!
2. Solar Orbiter catches a second comet by the tail
3. Review of solar and geomagnetic activity
4. International Sunspot Number by SILSO
5. PROBA2 Observations
6. Noticeable Solar Events (24 Jan 2022 - 30 Jan 2022)
7. Geomagnetic Observations in Belgium
8. The SIDC Space Weather Briefing
9. Review of ionospheric activity
10. Action!
ROB/USET telescopes capture solar eruption
The Uccle Solar Equatorial Table (USET - http://www.sidc.be/uset/ ) of the Royal Observatory of Belgium (ROB) contains 4 telescopes to observe the Sun in the visible light: two for white light observations, one for the blue portion of the spectrum (CaII K), and one for the red portion (H-alpha, 656.28 nm). During the early afternoon hours of 14 January, solar observers at the ROB managed to image a filament eruption in H-alpha, which was associated with a long duration C4 flare (GOES, soft x-rays). A filament is a cloud of ionized particles (plasma) above the solar surface squeezed between magnetic regions of opposite polarity. Being cooler and denser than the plasma underneath and their surroundings, it appears as a dark line when seen on the solar disk using special filters such as the H-alpha filter. When the magnetic fields holding the plasma become unstable, the filament may erupt and be ejected into space.
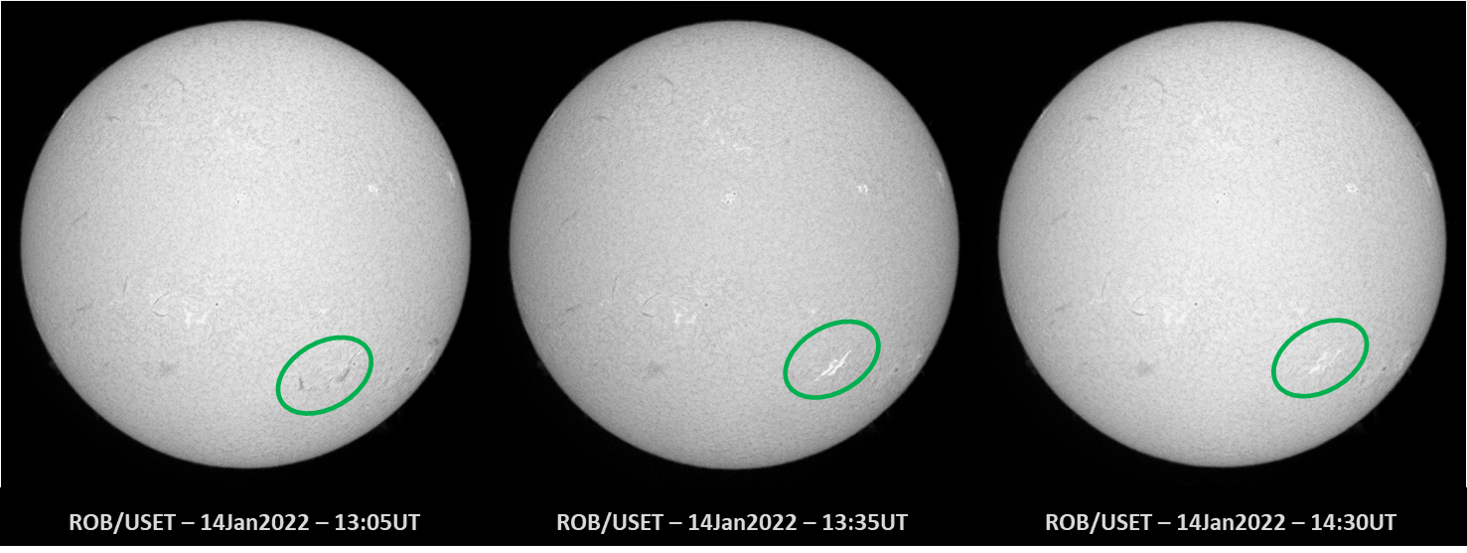
Credits: ROB/USET (http://www.sidc.be/uset/ )
The annotated imagery above shows the rising filament at the beginning of the eruption (13:05UT), the eruption itself (13:35UT), and the area after the eruption (14:30UT) when the filament was fully gone. A movie is available in the online version of this STCE news item at https://www.stce.be/news/571/welcome.html Note the movie runs from 13:00 till 13:30UT, with a change from 20 to 10 seconds in image cadence at 13:20UT. The middle image above shows very well the development of double ribbons (the two bright more-or-less parallel lines), a tell-tale sign that magnetic reconnection has taken place and particles are accelerated to both sides of the magnetic neutral line, which marks the original location of the erupted filament. The eruption was also observed by the GONG H-alpha network (https://gong2.nso.edu/products/tableView/table.php?configFile=configs/hAlpha.cfg ), as well as in extreme ultraviolet (EUV) by the fleet of solar satellites, including Solar Orbiter (see the movie in the online version) though it was trailing Earth by about 15 degrees. That's the reason why the eruption appears to be closer to the west limb ("to the right") than in the earth-based imagery. These images clearly show the ejection of plasma into space (annotated SolO/FSI 174 image underneath), but the associated coronal mass ejection delivered only a glancing blow to the earth-environment on 17 January, resulting in a puny geomagnetic storm (Kp=5).
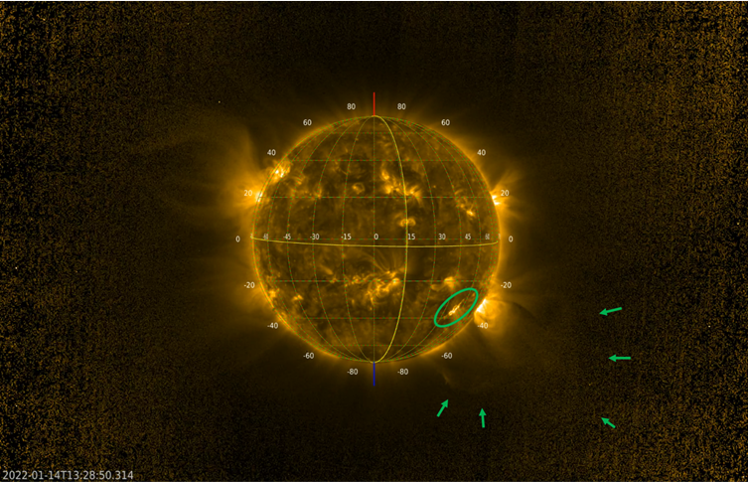
Credits: the SolO/EUI team (http://www.sidc.be/EUI/intro )
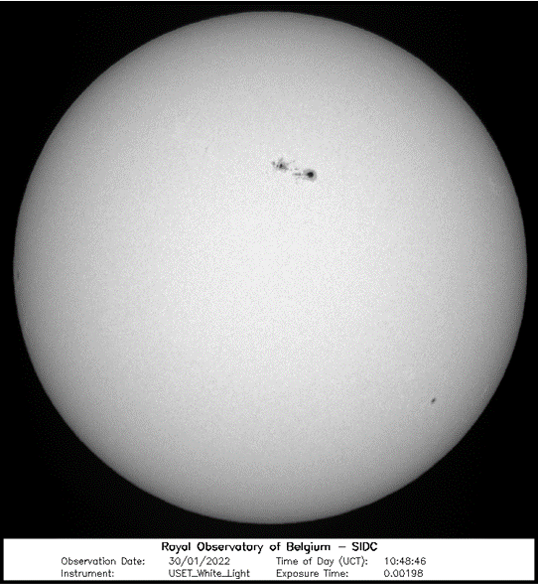
The USET solar telescopes were also at the appointment last week when a big sunspot group developed on disk in just a few days. Despite all the cloudy days in January, USET solar observers managed to snap this white light picture of the Sun showing NOAA 2936 on 30 January (underneath). Using solar eclipse glasses, several observers reported the sunspot group visible with the naked eye on that day. Despite its size, the group's magnetic configuration was relatively simple and resulted in mostly C-class flares and only 1 M-class event so far. More on this active region in a future news item.
Solar Orbiter catches a second comet by the tail
(This is a shortened version of the news article published by ESA here: https://www.esa.int/Science_Exploration/Space_Science/Solar_Orbiter/Solar_Orbiter_catches_a_second_comet_by_the_tail)
For a spacecraft designed to conduct unique studies of the Sun, Solar Orbiter is also making a name for itself exploring comets. For several days around 17 December 2021, the spacecraft found itself flying through the tail of Comet C/2021 A1 Leonard. The encounter captured information about the particles and magnetic field present in the tail of the comet. This will allow astronomers to study the way the comet interacts with the solar wind, a variable wind of particles and magnetic field that emanate from the Sun and sweep through the solar system.
At the time of the crossing, Solar Orbiter was relatively close to the Earth having passed by on 27 November 2021 for a gravity assist manoeuvre that marked the beginning of the mission's science phase, and placed the spacecraft on course for its March 2022 close approach to the Sun. The comet's nucleus was 44.5 million kilometres away, near to the planet Venus, but its giant tail stretched across space to Earth's orbit and beyond.
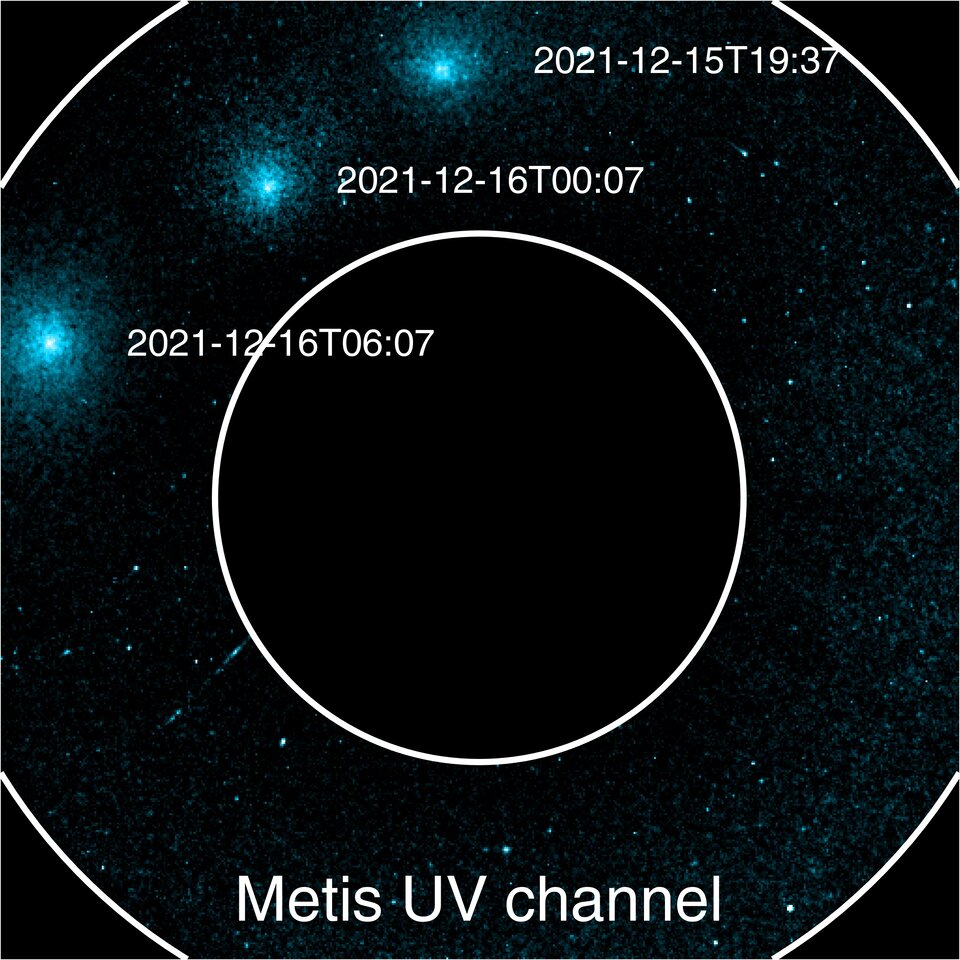
So far, the best detection of the comet's tail from Solar Orbiter has come from the Solar Wind Analyser (SWA) instrument suite. Its Heavy Ion Sensor (HIS) clearly measured atoms, ions and even molecules that are attributable to the comet rather than the solar wind. In addition to the particle data, Solar Orbiter also acquired images. Metis is Solar Orbiter's multi-wavelength coronagraph. It can perform ultraviolet observations that see the Lyman alpha emission given out by hydrogen, and it can measure the polarisation of visible light. During 15 and 16 December it captured the distant head of the comet simultaneously in both visible and ultraviolet light (image above). The visible light images can hint at the rate at which the comet is ejecting dust, while the ultraviolet images can give the water production rate.
The Solar Orbiter Heliospheric Imager (SoloHI) also captured data. These images below show large parts of the comet's ion tail taken while the spacecraft itself was inside the tail. As the image sequence progresses, changes in the tail can be seen in response to variations in the solar wind speed and direction. And it was not just Solar Orbiter that was watching the crossing. The ESA/NASA SOHO mission and NASA's STEREO-A and Parker Solar Probe spacecraft were observing from afar. This means that not only do astronomers now have data from inside the tail, they also have contextual images from these other spacecraft.

Comet tail crossings are relatively rare events. Of those that have been detected, most have been noticed only after the event. The ESA/NASA Ulysses mission encountered three comet ion tails. Solar Orbiter itself crossed the tail of fragmenting comet C/2019 Y4 ATLAS in May and June 2020, shortly after launching. "This kind of additional science is always an exciting part of a space mission," says Daniel Müller, ESA Project Scientist for Solar Orbiter. "When the comet ATLAS crossing was predicted, we were still calibrating the spacecraft and its instruments. Also, the comet fragmented just before we got there. But with Comet Leonard we were totally ready and the comet didn't fall apart."
In March, Solar Orbiter make its closest pass to the Sun yet at a distance of 0.32 au (approximately one-third of the Earth-Sun distance, or about 50 million kilometres). It is one of almost 20 close passes to the Sun that will occur during the next decade. These will result in unprecedented images and data, not only from close up, but also from the Sun's never-before seen polar regions.
The Extreme Ultraviolet Imager (EUI) team at ROB is currently planning the observations that will be made during the March perihelion. Exciting times are ahead!
Review of solar and geomagnetic activity
Solar Activity
Solar activity was at active levels over the last week. Several sunspot groups were visible on the solar disk facing Earth. The most active region was Catania sunspot group 17 (AR NOAA 2936). It produced several C-class flares and one M1.1-class flare on January 29 with a peak time at 23:32 UTC. This flare was associated with a large coronal dimming observed in SDO/AIA images and detected by the Solar Demon Tool.
An Earth-directed coronal mass ejection associated to the M1.1-class flare was observed on January 30 around 00:00 UTC by the coronagraph imagery SOHO/LASCO-C2, SOHO/LASCO-C3 and STEREO/COR2-A. It was also detected by SIDC/CACTus Tool. The projected speed in the plane of the sky was estimated to be around 425 km/s and 549 km/s. Due to the geo-effective location of the active region (Longitude -13 degrees and Latitude 22 degrees), the coronal mass ejection was estimated to be directed toward Earth with possible impact on the solar wind conditions in the vicinity of Earth. Using all the available coronograph images the true speed was evaluated to be around 1200 km/s.
The greater than 10 MeV proton flux was at nominal levels in the past week. The greater than 2 MeV electron flux was above the 1000 pfu alert threshold in the beginning of the week due to the high-speed streams observed last week, then it remained below the threshold. The greater than 2 MeV electron fluence was at moderated levels then dropped to nominal levels in the end of the week.
Geomagnetic Activity
The solar wind parameters measured in the Earth environment (at the L1 point by the DSCOVR spacecraft) were enhanced over the past week. On Jan 24, the effects from the expected arrival of the Interplanetary Coronal Mass Ejection (that erupted on Jan 22 at 10:36 UTC) was observed and the interplanetary magnetic field reached 13 nT. Then it was followed by the arrival of the solar high-speed stream associated with the Coronal Hole (positive magnetic polarity, that crossed the central meridian on January 21). The solar wind speed speed slowly increased up to 525 km/s. And finally it was followed by the arrival of the solar high-speed stream associated with the Coronal Hole (positive magnetic polarity, that crossed the central meridian on January 26). The solar wind speed increased further up to 560 km/s.
Over the past week, periods of active geomagnetic conditions were observed (K_Bel and NOAA-Kp 4) in response to the solar wind enhancement due to the fast wind coming from the coronal holes.
International Sunspot Number by SILSO
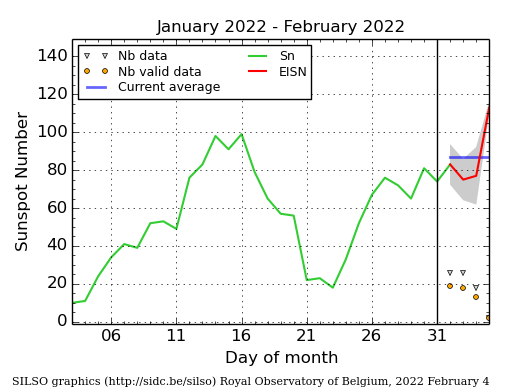
The daily Estimated International Sunspot Number (EISN, red curve with shaded error) derived by a simplified method from real-time data from the worldwide SILSO network. It extends the official Sunspot Number from the full processing of the preceding month (green line), a few days more than one solar rotation. The horizontal blue line shows the current monthly average. The yellow dots give the number of stations that provided valid data. Valid data are used to calculate the EISN. The triangle gives the number of stations providing data. When a triangle and a yellow dot coincide, it means that all the data is used to calculate the EISN of that day.
PROBA2 Observations
Solar Activity
Solar flare activity fluctuated from low to moderate during the week.
In order to view the activity of this week in more detail, we suggest to go to the following website from which all the daily (normal and difference) movies can be accessed here : https://proba2.oma.be/ssa
This page also lists the recorded flaring events.
A weekly overview movie can be found here (SWAP week 618): https://proba2.sidc.be/swap/data/mpg/movies/weekly_movies/weekly_movie_2022_01_24.mp4
Details about some of this week's events can be found further below.
If any of the linked movies are unavailable they can be found in the P2SC movie repository here: https://proba2.oma.be/swap/data/mpg/movies/
Saturday Jan 29
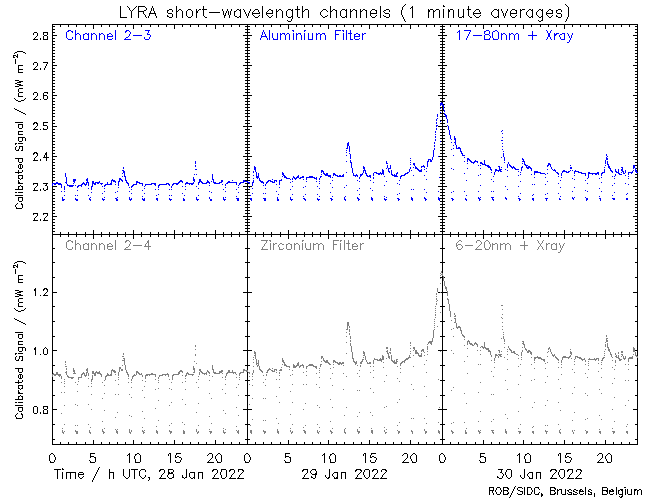
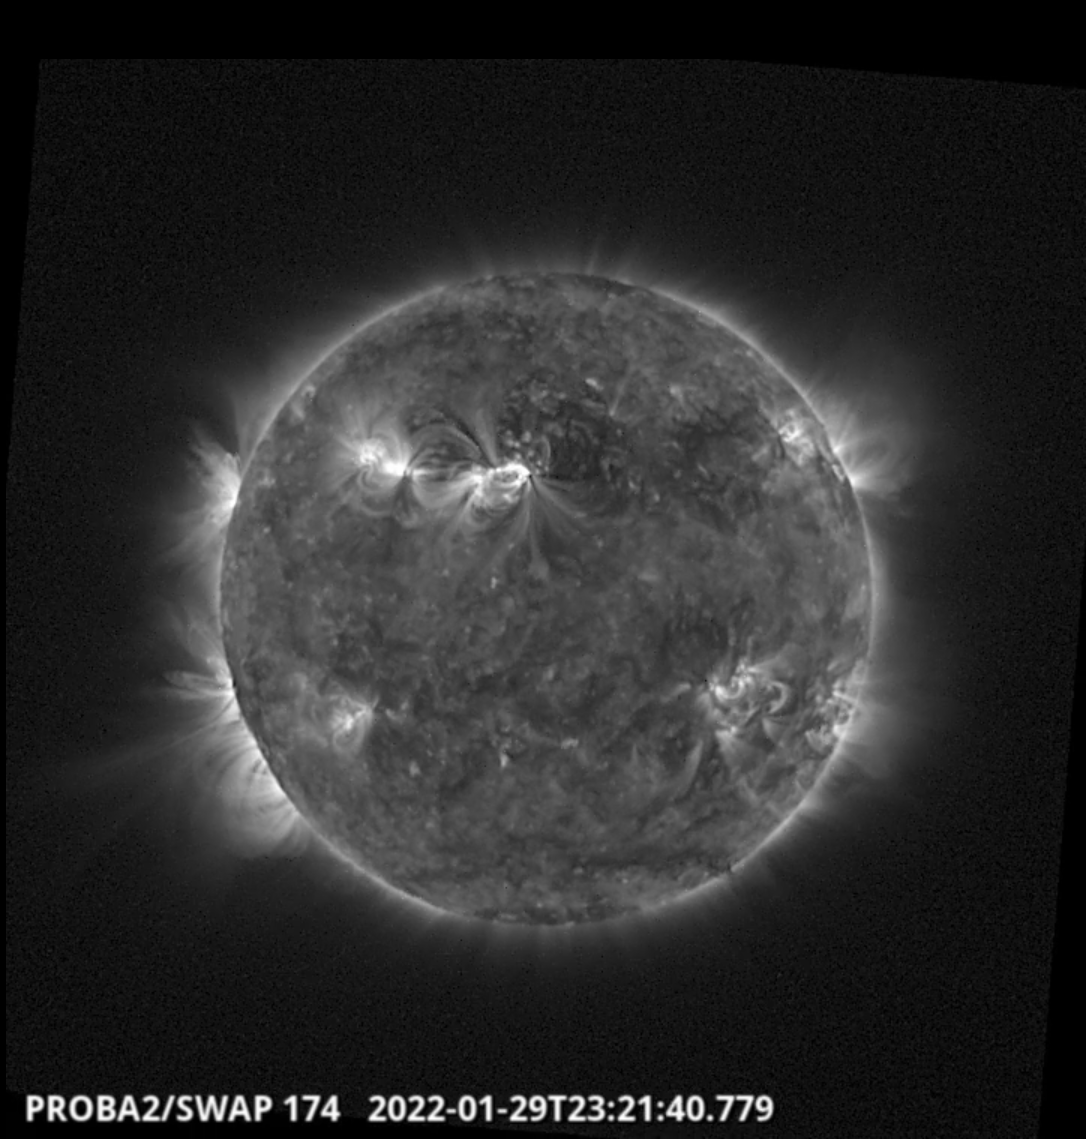
The largest flare of the week, an M1.1 flare, was observed by SWAP and LYRA. The flare is visible in the northern hemisphere on 2022-Jan-29, as shown in the SWAP image above taken at 23:21 UT.
Find a movie of the event here (SWAP movie): https://proba2.sidc.be/swap/movies/20220129_swap_movie.mp4
Noticeable Solar Events (24 Jan 2022 - 30 Jan 2022)
| DAY | BEGIN | MAX | END | LOC | XRAY | OP | 10CM | TYPE | Cat | NOAA |
| 29 | 2232 | 2332 | 0032 | M1.1 | 17 | 2936 | ||||
| 29 | 2245 | 2332 | 0024 | M1.1 | 17 | 2936 |
| LOC: approximate heliographic location | TYPE: radio burst type |
| XRAY: X-ray flare class | Cat: Catania sunspot group number |
| OP: optical flare class | NOAA: NOAA active region number |
| 10CM: peak 10 cm radio flux |
Geomagnetic Observations in Belgium
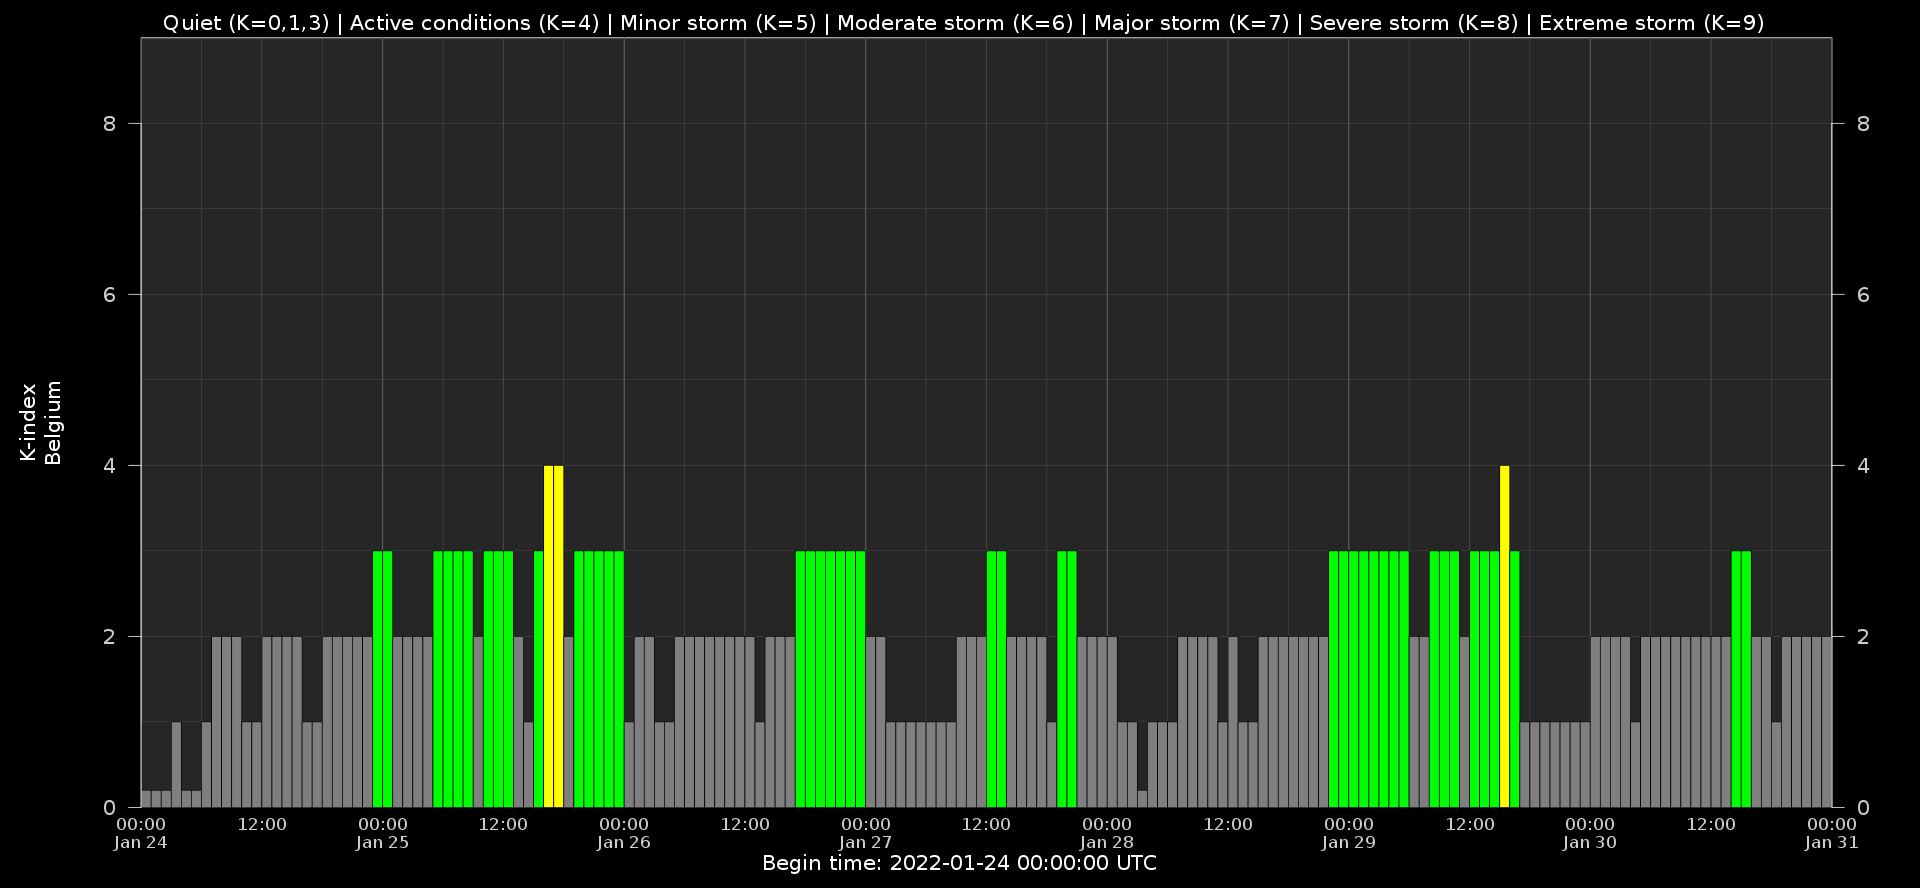
Local K-type magnetic activity index for Belgium based on data from Dourbes (DOU) and Manhay (MAB). Comparing the data from both measurement stations allows to reliably remove outliers from the magnetic data. At the same time the operational service availability is improved: whenever data from one observatory is not available, the single-station index obtained from the other can be used as a fallback system.
Both the two-station index and the single station indices are available here: http://ionosphere.meteo.be/geomagnetism/K_BEL/
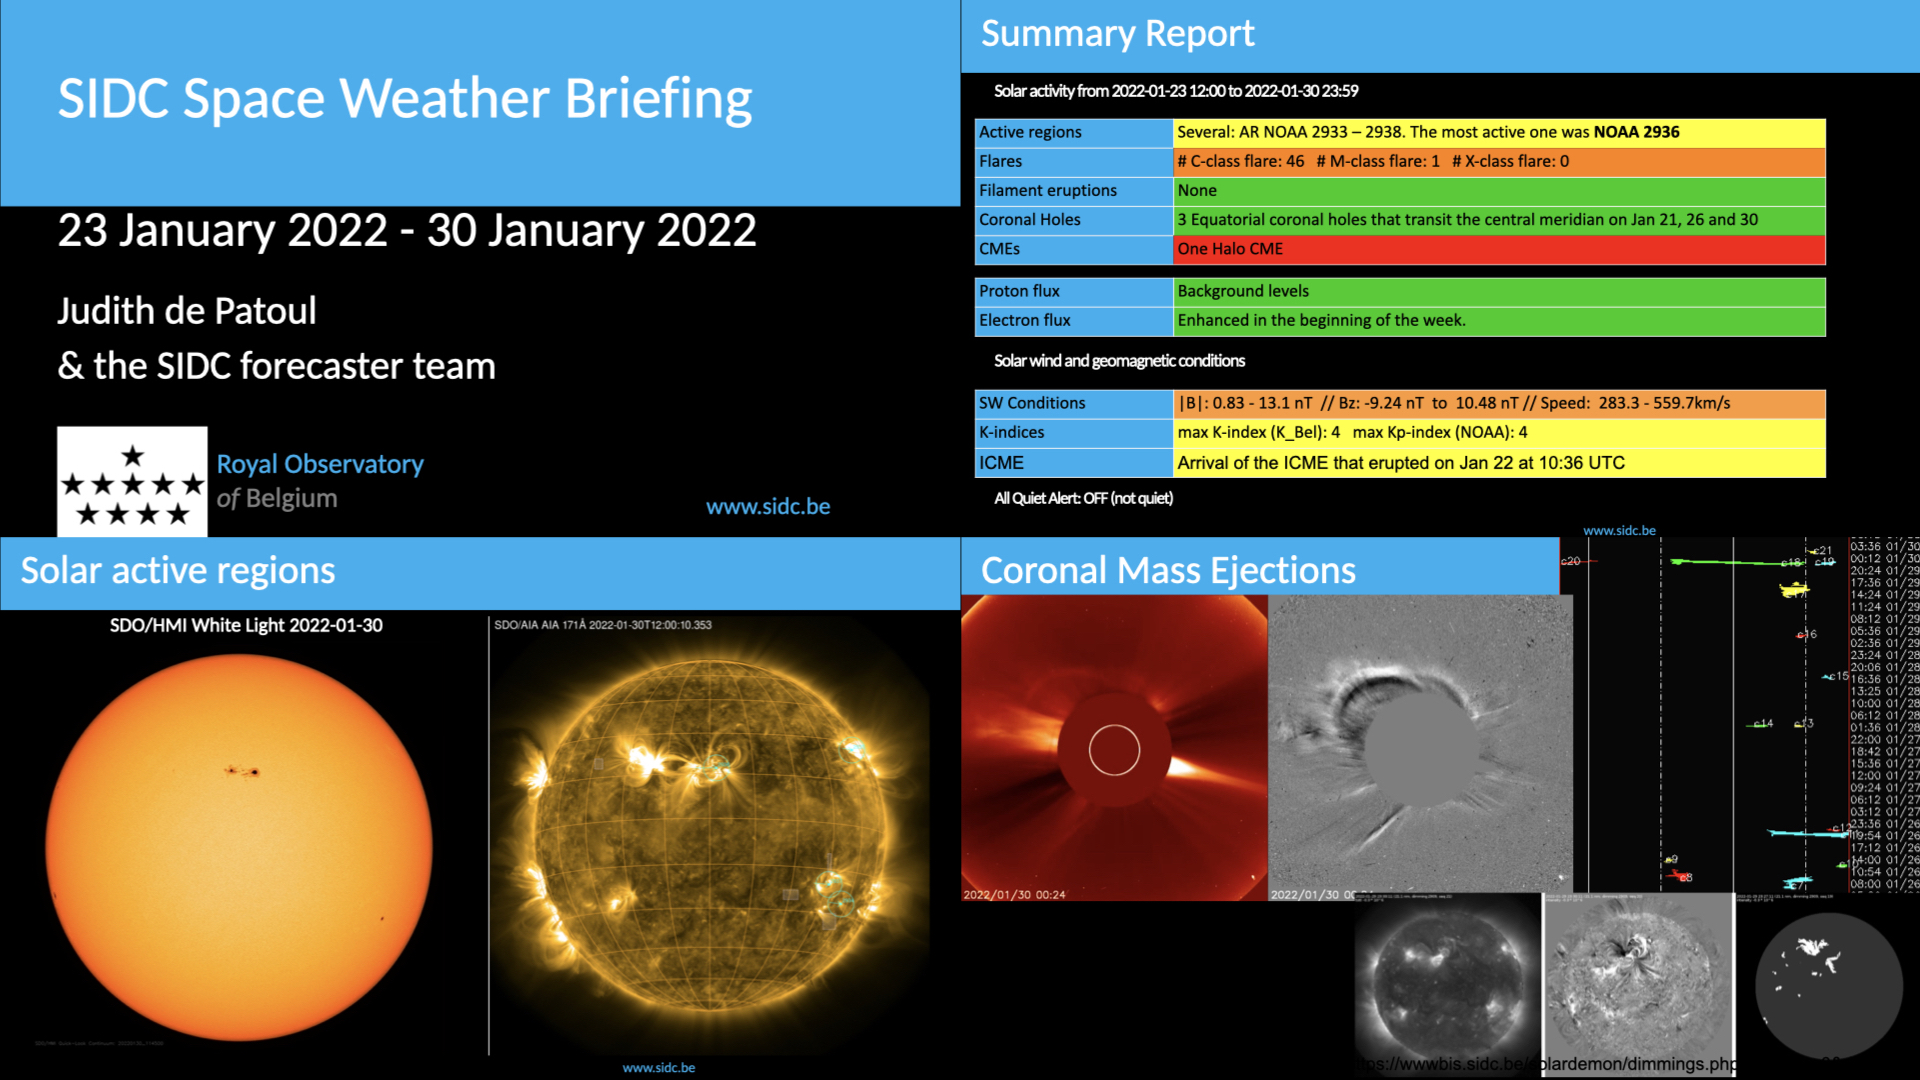
The SIDC Space Weather Briefing
The Space Weather Briefing presented by the forecaster on duty from January 24 to 31. It reflects in images and graphs what is written in the Solar and Geomagnetic Activity report: https://www.stce.be/briefings/20220131_SWbriefing.pdf
If you need to access the movies, contact us: stce_coordination at stce.be
Review of ionospheric activity
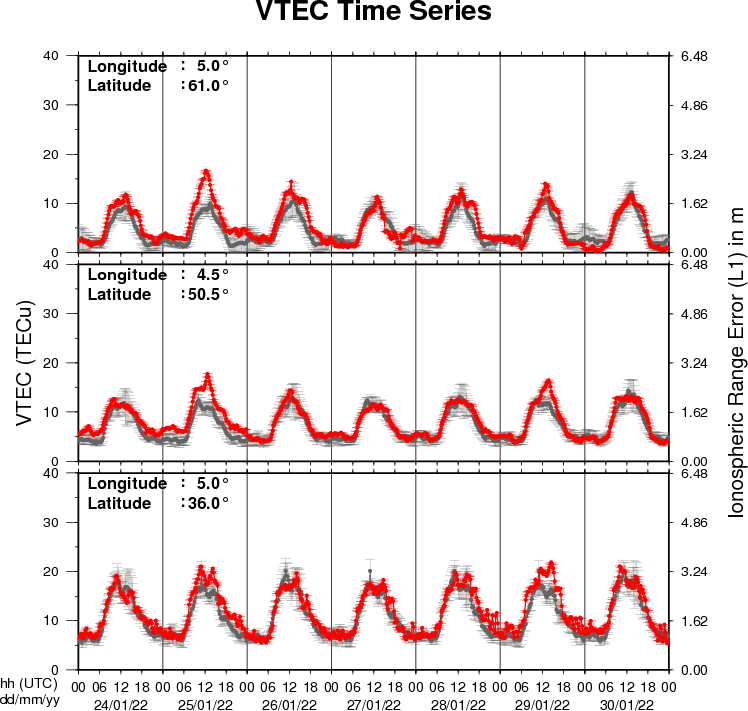
The figure shows the time evolution of the Vertical Total Electron Content (VTEC) (in red) during the last week at three locations:
a) in the northern part of Europe(N 61deg E 5deg)
b) above Brussels(N 50.5deg, E 4.5 deg)
c) in the southern part of Europe(N 36 deg, E 5deg)
This figure also shows (in grey) the normal ionospheric behaviour expected based on the median VTEC from the 15 previous days.
The VTEC is expressed in TECu (with TECu=10^16 electrons per square meter) and is directly related to the signal propagation delay due to the ionosphere (in figure: delay on GPS L1 frequency).
The Sun's radiation ionizes the Earth's upper atmosphere, the ionosphere, located from about 60km to 1000km above the Earth's surface.The ionization process in the ionosphere produces ions and free electrons. These electrons perturb the propagation of the GNSS (Global Navigation Satellite System) signals by inducing a so-called ionospheric delay.
See http://stce.be/newsletter/GNSS_final.pdf for some more explanations ; for detailed information, see http://gnss.be/ionosphere_tutorial.php
Action!
Check out our activity calendar: activities and encounters with the Sun-Space-Earth system and Space Weather as the main theme. We provide occasions to get submerged in our world through educational, informative and instructive activities.
If you want your event in our calendar, contact us: stce_coordination at stce.be
* February 14-18, online Space Weather Introductory Course by SWEC, Space Weather Education Center - registrations are open
* February 22, Public Lecture on Space Weather and Aviation (Dutch), Urania, Hove, Belgium
* February 26, Public Lecture on Space Weather, Satellites and Aviation (Dutch), UGent Volkssterrenwacht Armand Pien, Gent, Belgium
* March 14-16, onsite (!) Space Weather Introductory Course by SWEC, Space Weather Education Center - registrations are open
* April 26, Public Lecture on the Solar Corona in EUV (Dutch), Urania, Hove, Belgium
* April 28, Public Lecture on SDO/EUI, Astropolis, Oostende, Belgium
* August 25, Public Lecture on Space Weather and Aviation, Astropolis, Oostende, Belgium
* October 24-28, 18th European Space Weather Week, Zagreb, Croatia
Check: https://www.stce.be/calendar