- Table of Content
- 1.Spotlight on N...
- 2.Review of sola...
- 3.Review of geom...
- 4.PROBA2 Observa...
- 5.The Internatio...
- 6.Geomagnetic Ob...
- 7.The SIDC Space...
- 8.Review of iono...
- 9.Action!
2. Review of solar activity
3. Review of geomagnetic activity
4. PROBA2 Observations (31 Jan 2022 - 6 Feb 2022)
5. The International Sunspot Number by Silso
6. Geomagnetic Observations in Belgium (31 Jan 2022 - 6 Feb 2022)
7. The SIDC Space Weather Briefing (31 Jan 2022 - 6 Feb 2022)
8. Review of ionospheric activity (31 Jan 2022 - 6 Feb 2022)
9. Action!
Spotlight on NOAA 2936
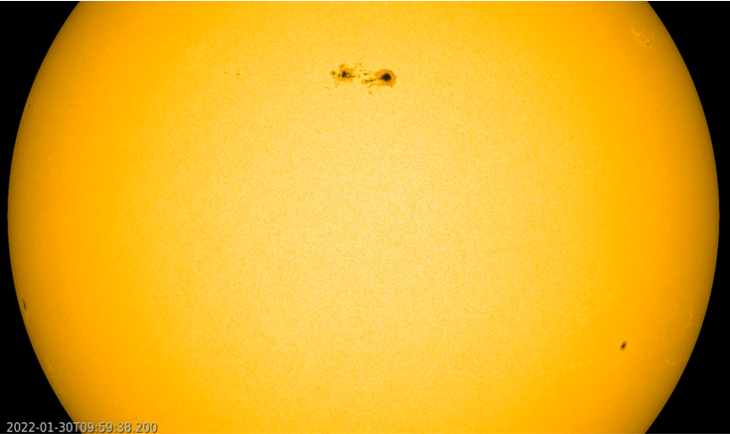
NOAA 2936 rounded the northeast solar limb on 24 January and was numbered by NOAA the next day. The group gradually gained in size, and eventually reached a sunspot area about 4 times the surface area of the Earth, thus becoming the 3rd largest group of solar cycle 25 (SC25) so far, after NOAA 2786 and NOAA 2835. Using eclipse glasses, several solar observers reported the group visible to the naked eye when it was near the Sun's central meridian around 30 January. SDO/HMI (https://sdo.gsfc.nasa.gov/data/aiahmi/ ) imagery underneath shows the active region on that day. Clips can be found in the online version of this news item at https://www.stce.be/news/572/welcome.html
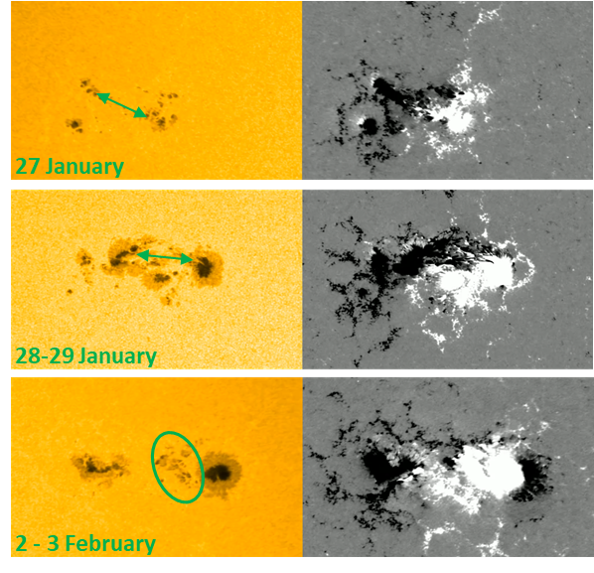
There were 3 major episodes of magnetic flux emergence (i.e. sunspot formation) during NOAA 2936's transit, as shown in the annotated imagery underneath, with white light images on the left and magnetograms on the right. In magnetograms, white denotes positive magnetic polarity, or areas where the magnetic field is leaving the Sun, and black represents areas where the magnetic field is returning to the Sun (negative polarity). A first but brief period of flux emergence took place in the southeast ("lower left" in the images) of the region on 27 January. It was quickly followed by major flux emergence to the north of the leading spot on 28 and 29 January. This 2nd flux emergence contributed significantly to the growth of the two main spots. A final episode of sunspot formation took place on 2 and 3 February, to the east ("left") of the main leading spot. This new flux had mostly the same magnetic polarity as the main sun spot ("white" in the magnetogram). Despite its size and apparent complexity in white light, the sunspot group had all in all a quite simple magnetic configuration with mostly some magnetic mixing along the polarity inversion line (the "border" between positive and negative magnetic fields). This resulted in numerous but relatively weak solar flares, with NOAA counting more than 50 C-class flares and only one M-class flare in this region during its transit.
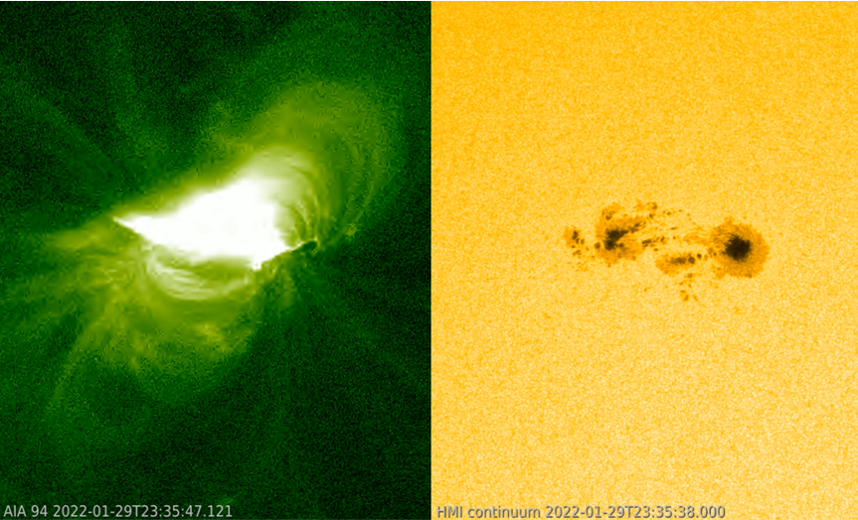
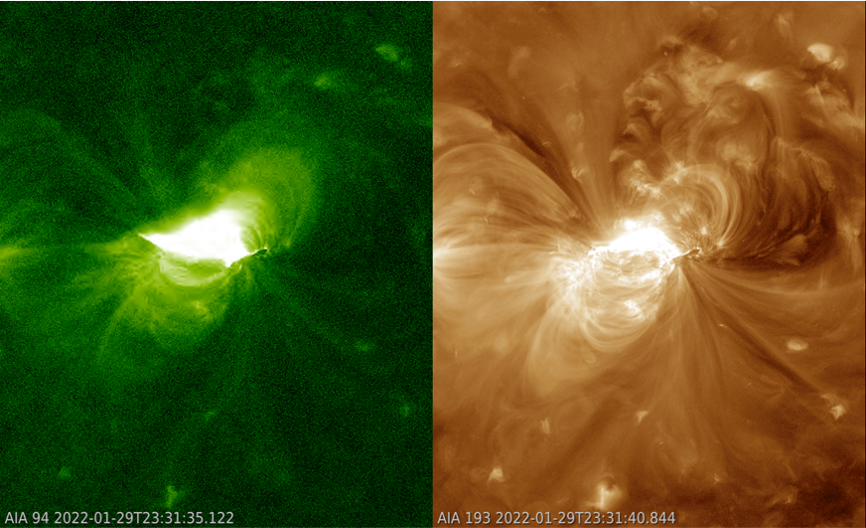
The strongest flare in NOAA 2936 took place late on 29 January. It was a long duration M1.1 flare peaking at 23:32UT, and drove the 10.7 cm radio flux from its background values around 125 sfu (solar flux unit, 1sfu = 10-22 W m-2 Hz-1) all the way up to 320 sfu (a "Tenflare"). The associated coronal mass ejection would arrive at Earth late on 1 February and cause some minor geomagnetic storming. The imagery underneath first shows the size and location of the flare in AIA 094 (multi-million degrees ; left) relative to NOAA 2936 (white light ; right), then (somewhat zoomed-out) against AIA 193 imagery (1.25 million degrees ; left). The latter shows very well some coronal dimming mainly to the northeast (the "darkening" in the upper left) of the region, as well as the development of post-eruption coronal loops.
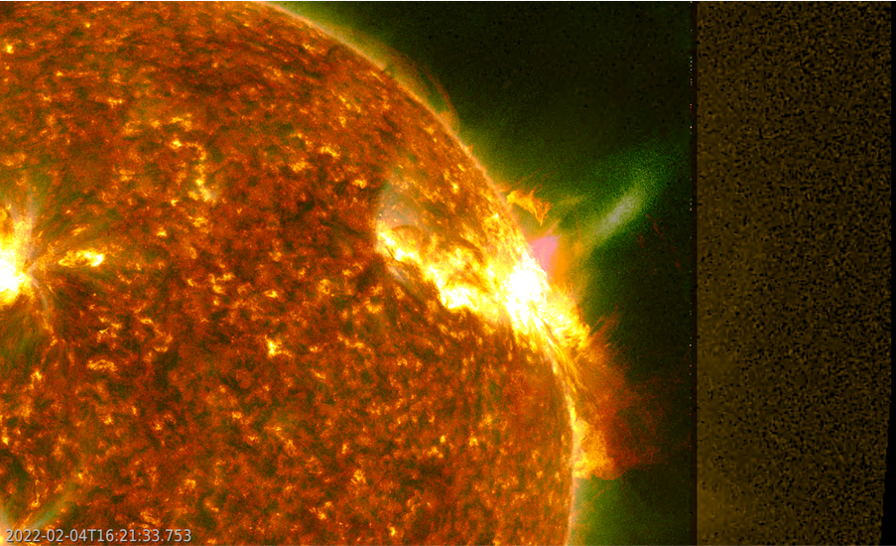
As the region neared the northwest solar limb, it remained quite active and continued to produce several C-class flares. The imagery underneath is compiled from AIA 304 images (red) overlaid on AIA 094 (green) and PROBA2/SWAP (yellow ; https://proba2.sidc.be/ssa) images. AIA 304 depicts mainly "cool" temperatures around 80,000 degrees, whereas SWAP 174 shows the solar atmosphere at temperatures near 1 million degrees, and much further away from the Sun. It also allows to follow the eruption as the Sun gets eclipsed by the Earth as seen from SDO, and no SDO/AIA images are available. The most dynamic eruption occurs on 4 February between 15 and 17UT (C5.8 flare, underneath), faintly extending in the outer portions of SWAP's field-of-view. The green towering loops in the background were only visible in AIA 094 and SWAP 174. They do not seem to be associated with this event, but rather originate from an energetic eruption beyond the solar limb around noon on 4 February.
Credits: Movies and pictures were created with JHelioviewer (https://www.jhelioviewer.org/index.html ).
Review of solar activity
Solar activity was low. Several sunspot groups were visible on the solar disc facing Earth. The most active region was Catania sunspot group 17 (AR NOAA 2936). It produced several C-class flares, the largest of which was C9.0 flare on February 01 with a peak time at 22:36 UTC.
An Earth directed coronal mass ejection associated to a C3.1 flare with peak time February 06 12:41UT was observed by the coronagraph SOHO/LASCO-C2, SOHO/LASCO-C3 and STEREO/COR2-A on February 06 14:09UT UTC. Its speed was estimated to be around 960 km/s.
The greater than 10 MeV proton flux was at nominal levels.
The greater than 2 MeV electron flux was above the 1000 pfu alert threshold on January 31 and February 01. This was due to the high-speed streams observed last week. On February 02, the flux dropped below the threshold to cross the threshold again from February 04. This increase was a response to an ICME arrival.
The greater than 2 MeV electron fluence was at moderated levels on February 01 and 02.
Review of geomagnetic activity
The solar wind measured in the Earth environment (by DSCOVR) showed at the beginning of the week still the influence of a high speed stream. By February 01, the solar wind parameters had returned to background levels.
On February 01 an ICME arrived. The ICME was related to a solar eruption that took place on Jan 29 23:36UT. The solar wind measurements showed a complex event with possible influence from two CME fronts. On February 04, an additional magnetic structure arrived. The total magnetic neared values of 20 nT, while its southward component Bz dropped to -19 nT. The solar wind speed had values of 560 km/s. The ICME characterised the solar wind from February 01 until February 05.
A high speed stream from negative polarity equatorial and southern coronal holes (central meridian crossing on February 02-03) drove the solar wind speed up to 640 km/s on February 06.
Over the past week, periods of minor storm geomagnetic conditions were observed (K_Bel and NOAA-Kp 5) in response to the solar wind enhancement due to the ICME arrival.
PROBA2 Observations (31 Jan 2022 - 6 Feb 2022)
Solar Activity
Solar flare activity was low during the week.
In order to view the activity of this week in more detail, we suggest to go to the following website from which all the daily (normal and difference) movies can be accessed: https://proba2.oma.be/ssa
This page also lists the recorded flaring events.
A weekly overview movie can be found here (SWAP week 619). https://proba2.oma.be/swap/data/mpg/movies/weekly_movies/weekly_movie_2022_01_31.mp4
Details about some of this week's events can be found further below.
If any of the linked movies are unavailable they can be found in the P2SC movie repository here https://proba2.oma.be/swap/data/mpg/movies/
Sunday Feb 06
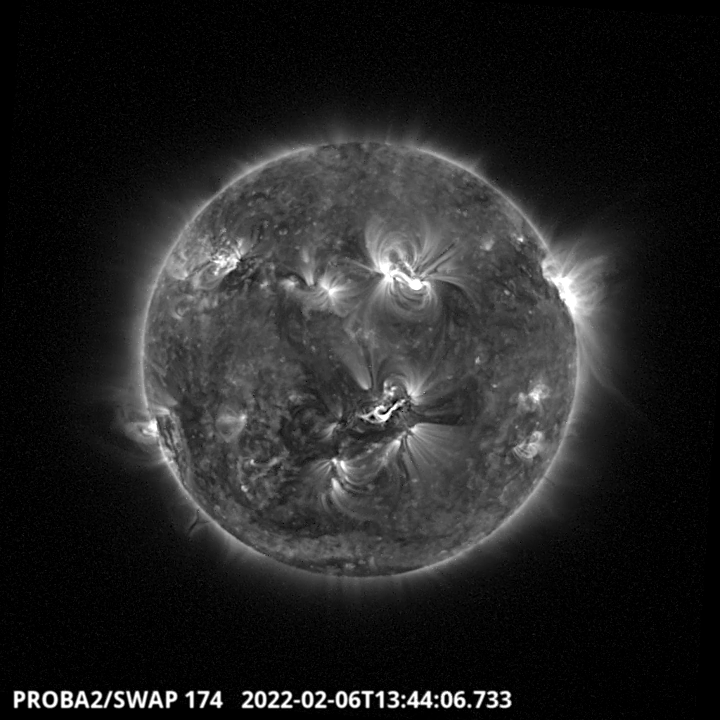
NOAA active region 2939 close to the center of the Southern hemisphere produced a filament eruption and a long duration C3.1 class flare with its maximum intensity around 13:44 UT. Find a movie of the events here (SWAP difference movie) https://proba2.oma.be/swap/data/mpg/movies/20220206_swap_movie.mp4
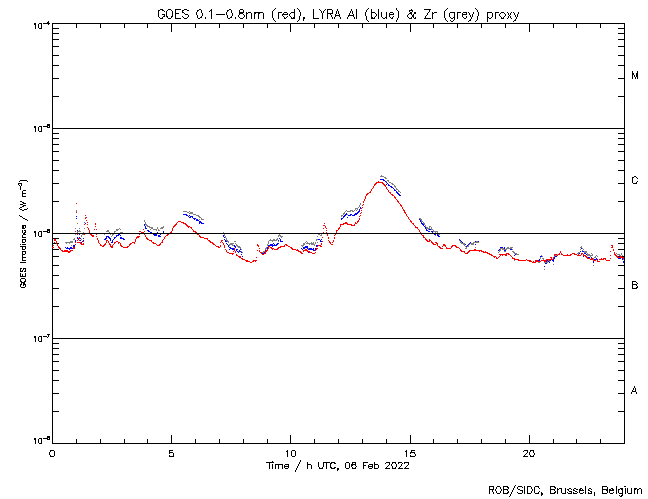
LYRA observations of the filament eruption and the C3.1 class flare, which erupted around 13:44 UT.
The International Sunspot Number by Silso
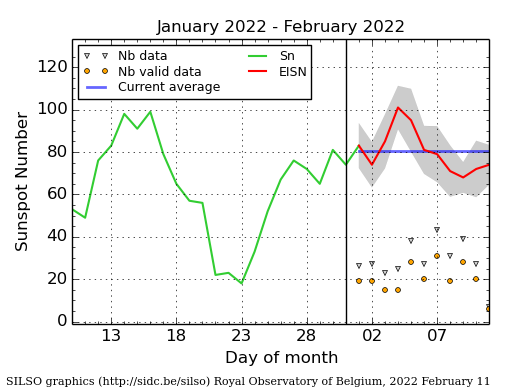
The daily Estimated International Sunspot Number (EISN, red curve with shaded error) derived by a simplified method from real-time data from the worldwide SILSO network. It extends the official Sunspot Number from the full processing of the preceding month (green line), a few days more than one solar rotation. The horizontal blue line shows the current monthly average. The yellow dots gives the number of stations that provided valid data. Valid data are used to calculate the EISN. The triangle gives the number of stations providing data. When a triangle and a yellow dot coincide, it means that all the data is used to calculate the EISN of that day.
Geomagnetic Observations in Belgium (31 Jan 2022 - 6 Feb 2022)

Local K-type magnetic activity index for Belgium based on data from Dourbes (DOU) and Manhay (MAB). Comparing the data from both measurement stations allows to reliably remove outliers from the magnetic data. At the same time the operational service availability is improved: whenever data from one observatory is not available, the single-station index obtained from the other can be used as a fallback system.
Both the two-station index and the single station indices are available here: http://ionosphere.meteo.be/geomagnetism/K_BEL/
The SIDC Space Weather Briefing (31 Jan 2022 - 6 Feb 2022)
The Space Weather Briefing presented by the forecaster on duty from January 24 to 31. It reflects in images and graphs what is written in the Solar and Geomagnetic Activity report: https://www.stce.be/briefings/20220207_SWbriefing.pdf
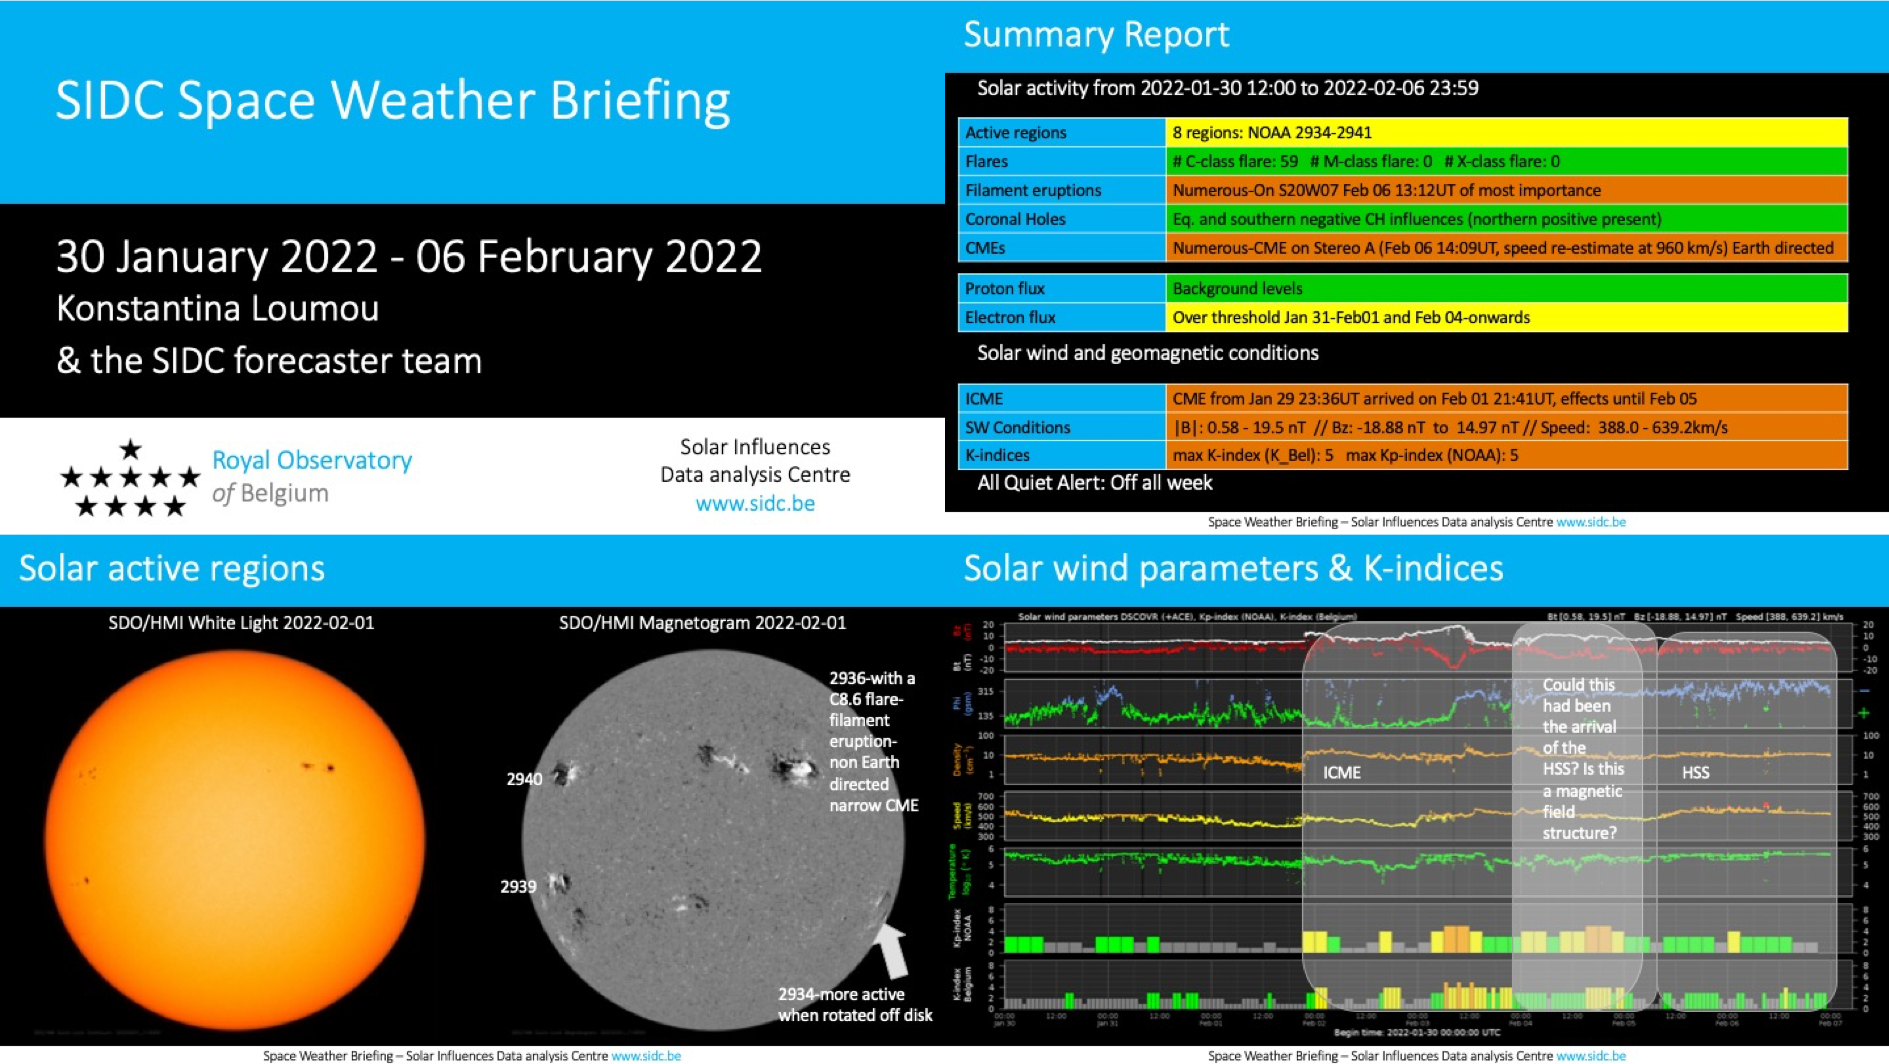
If you need to access the movies, contact us: stce_coordination at stce.be
Review of ionospheric activity (31 Jan 2022 - 6 Feb 2022)
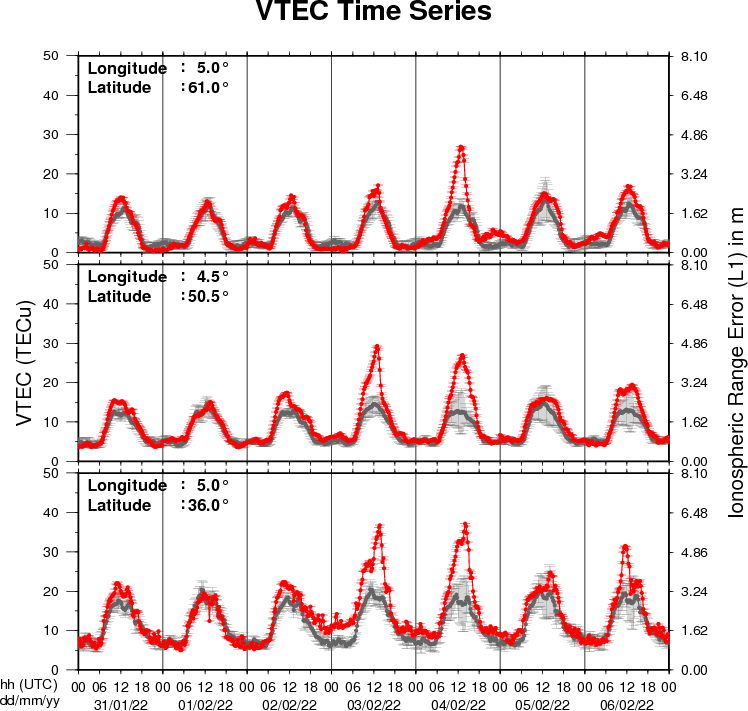
The figure shows the time evolution of the Vertical Total Electron Content (VTEC) (in red) during the last week at three locations:
a) in the northern part of Europe(N 61deg E 5deg)
b) above Brussels(N 50.5deg, E 4.5 deg)
c) in the southern part of Europe(N 36 deg, E 5deg)
This figure also shows (in grey) the normal ionospheric behaviour expected based on the median VTEC from the 15 previous days.
The VTEC is expressed in TECu (with TECu=10^16 electrons per square meter) and is directly related to the signal propagation delay due to the ionosphere (in figure: delay on GPS L1 frequency).
The Sun's radiation ionizes the Earth's upper atmosphere, the ionosphere, located from about 60km to 1000km above the Earth's surface.The ionization process in the ionosphere produces ions and free electrons. These electrons perturb the propagation of the GNSS (Global Navigation Satellite System) signals by inducing a so-called ionospheric delay.
See http://stce.be/newsletter/GNSS_final.pdf for some more explanations ; for detailed information, see http://gnss.be/ionosphere_tutorial.php
Action!
Check out our activity calendar: activities and encounters with the Sun-Space-Earth system and Space Weather as the main theme. We provide occasions to get submerged in our world through educational, informative and instructive activities.
If you want your event in our calendar, contact us: stce_coordination at stce.be
* February 14-18, online Space Weather Introductory Course by SWEC, Space Weather Education Center
* February 22, Public Lecture on Space Weather and Aviation (Dutch), Urania, Hove, Belgium
* February 26, Public Lecture on Space Weather, Satellites and Aviation (Dutch), UGent Volkssterrenwacht Armand Pien, Gent, Belgium
* March 14-16, onsite (!) Space Weather Introductory Course by SWEC, Space Weather Education Center - registrations are open
* April 26, Public Lecture on the Solar Corona in EUV (Dutch), Urania, Hove, Belgium
* April 28, Public Lecture on SDO/EUI, Astropolis, Oostende, Belgium
* August 25, Public Lecture on Space Weather and Aviation, Astropolis, Oostende, Belgium
* October 24-28, 18th European Space Weather Week, Zagreb, Croatia
Check: https://www.stce.be/calendar