- Table of Content
- 1.Unique images ...
- 2.Minor storm, m...
- 3.Review of sola...
- 4.Review of geom...
- 5.PROBA2 Observa...
- 6.The Internatio...
- 7.Noticeable Sol...
- 8.Geomagnetic Ob...
- 9.The SIDC Space...
- 10.Review of iono...
- 11.Action!
2. Minor storm, major impact
3. Review of solar activity
4. Review of geomagnetic activity
5. PROBA2 Observations (7 Feb 2022 - 13 Feb 2022)
6. The International Sunspot Number by Silso
7. Noticeable Solar Events (7 Feb 2022 - 13 Feb 2022)
8. Geomagnetic Observations in Belgium (7 Feb 2022 - 13 Feb 2022)
9. The SIDC Space Weather Briefing
10. Review of ionospheric activity (7 Feb 2022 - 13 Feb 2022)
11. Action!
Unique images of a solar cloud
On February 15, 2022, an immense cloud escaped from the sun. The space telescope EUI onboard the Solar Orbiter satellite could capture the solar cloud while it was hurled into space. EUI followed the solar cloud over a distance of 3,5 million kms. Never before could a single telescope image the journey of a solar cloud from the early start to this far into space.
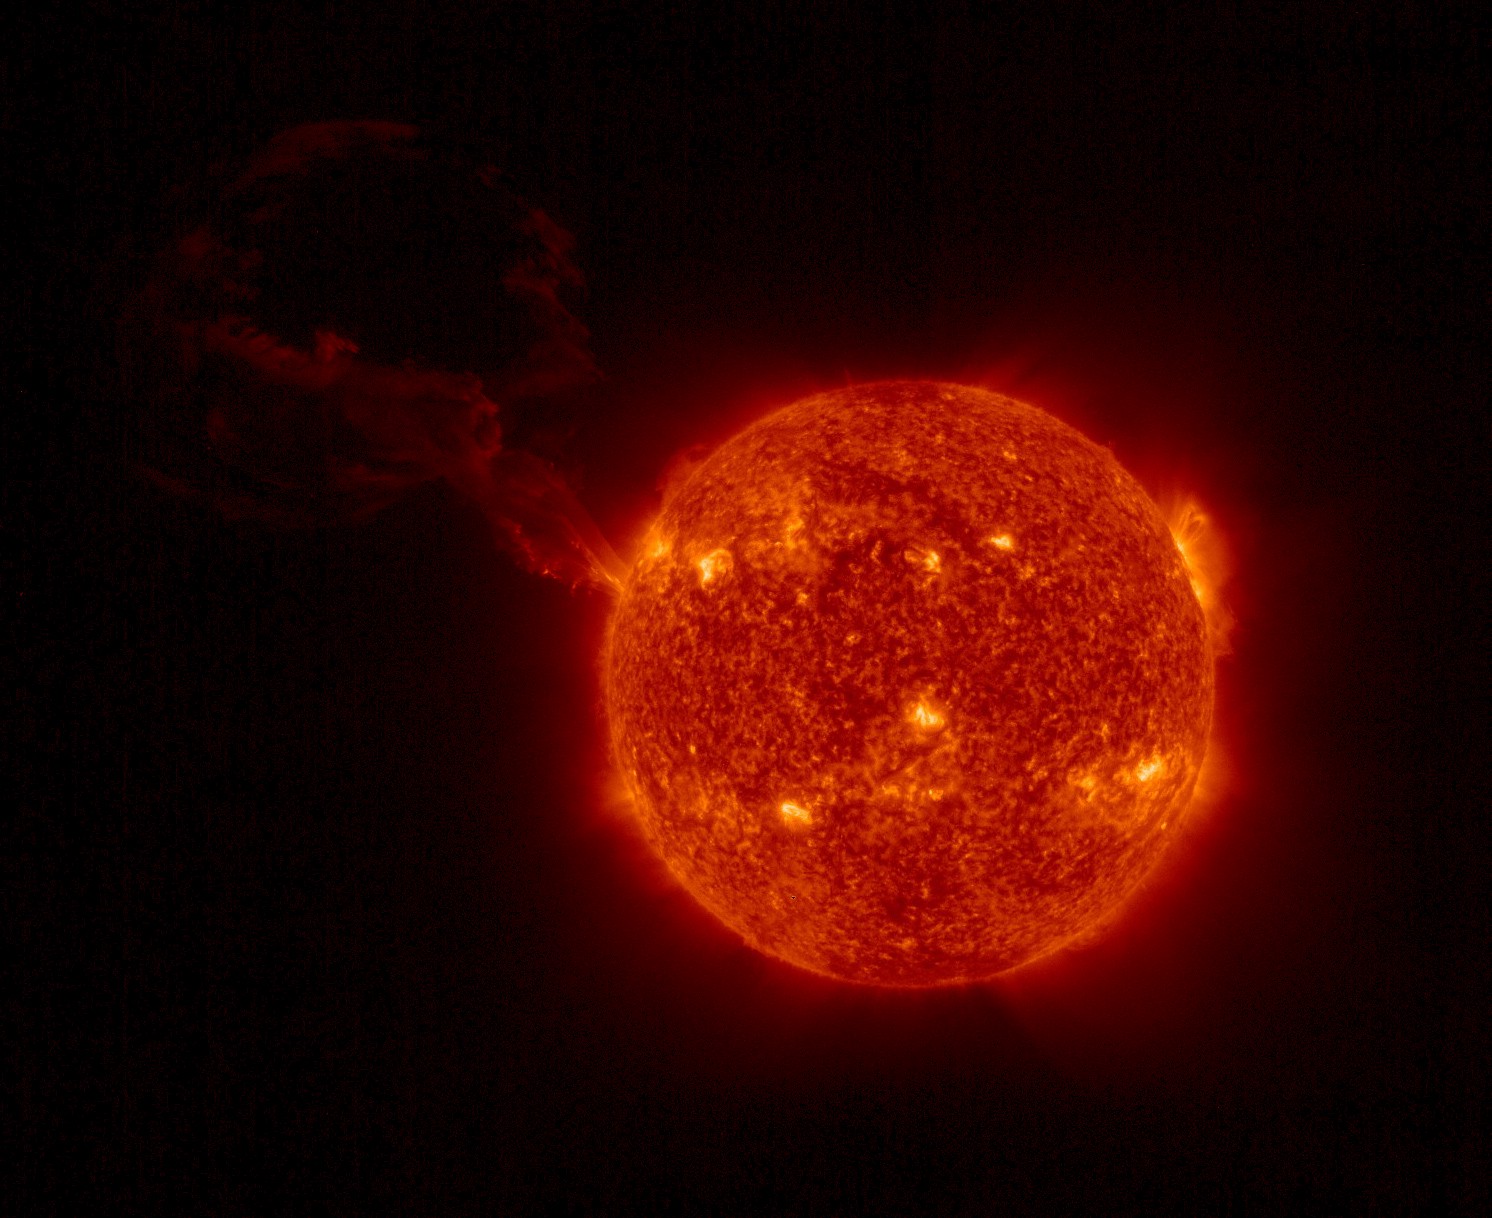
EUI captured a giant solar eruption on 15 February 2022, reaching up to a distance over 3,5 million kilometers.
Credit: Solar Orbiter/EUI Team/ESA and NASA
Solar Orbiter was launched in February 2020. Since November 2021 only, the instruments onboard are collecting scientific data. The EUI images hit like a hammer. David Berghmans, EUI principal investigator: "Amazing to see that the cloud stayed visible up to the edge of our widescreen camera. A while ago, with another camera designed to observe in detail, we saw small 'campfires' on the sun. Now it seems that the widescreen camera can beautifully image space further away from the sun. This allows us to link the details in the solar atmosphere with what happens further up."

EUI movie of the solar cloud escaping the sun.
Credit: Solar Orbiter/EUI Team/ESA and NASA .
The full resolution movie can be downloaded here:
https://stce.be/movies/FSIfilament.mp4
More details and movies can be found on the ESA website: https://www.esa.int/Science_Exploration/Space_Science/Solar_Orbiter/Giant_solar_eruption_seen_by_Solar_Orbiter
Minor storm, major impact
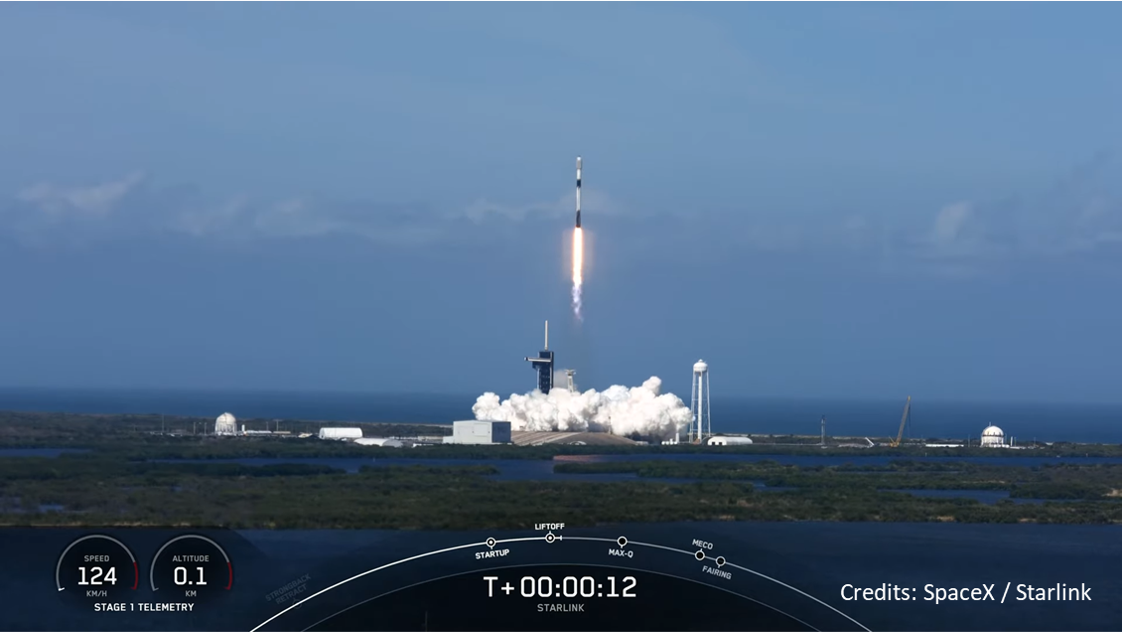
The space weather community was surprised last week when SpaceX (https://www.spacex.com/ ) announced it had lost 40 of its 49 Starlink satellites that were launched from the Kennedy Space Center, Florida on 3 February. A screenshot of the launch from their live broadcast can be seen underneath, with a recording available at the SpaceX website (https://www.spacex.com/launches/sl4-7/ ). The problems were encountered the day after launch, on 4 February, following a geomagnetic storm. However, only minor storming was recorded on 3 and 4 February, and that usually does not result in severe space weather impacts. So, what was going on?
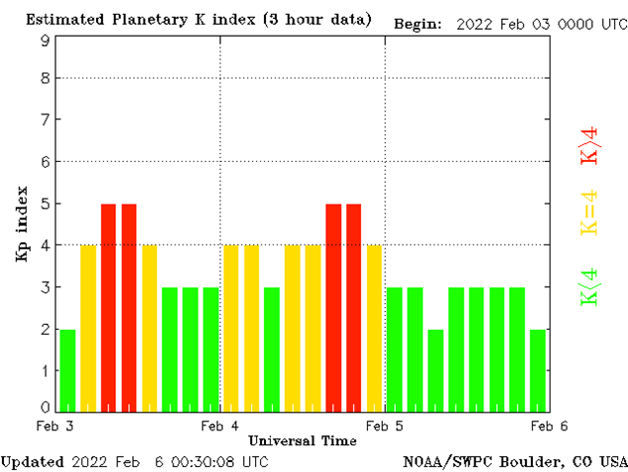
Let's first take a more detailed look at the geomagnetic conditions during launch day and the day after. On 3 February, a coronal mass ejection (CME) hit the earth environment resulting in episodes of minor storming (Kp = 5) that day and the day after. The Dst-index reached moderate levels, resp. with -77 and -69 nT on 3 and 4 February. More on these indices and levels of geomagnetic activity can be found at the STCE's SWx classification page (https://www.stce.be/educational/classification#geomag ). This storm had only minor to moderate strength, but one may note that geomagnetic activity was at active to minor storming levels for most of these days. So, the storm did not concern just a single, isolated period, but rather a sustained period of enhanced geomagnetic activity (see e.g. Oliveira et al. 2020 - https://doi.org/10.1029/2020SW002472 ). This can be seen underneath in NOAA's estimated Kp index for those days.
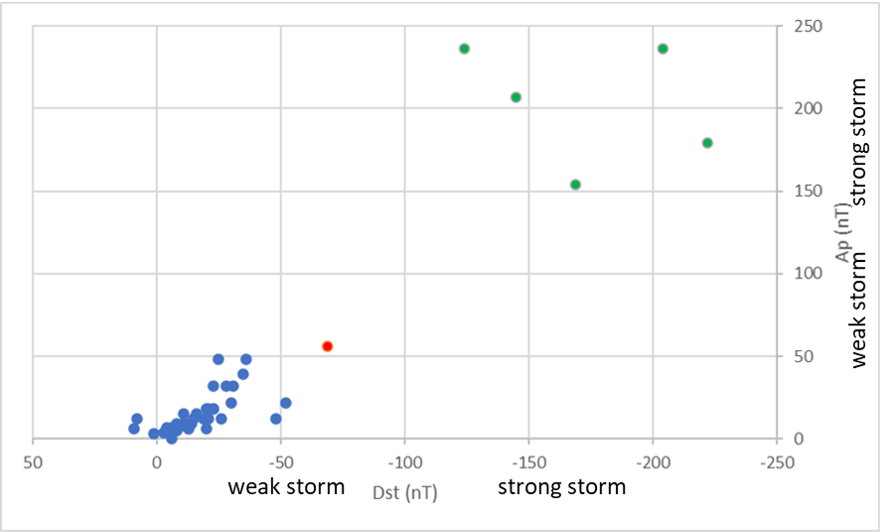
The geomagnetic levels reached on 3 and 4 February have been observed already several times in the past, and they usually are no cause of strong space weather impacts. So, maybe these conditions were out-of-the-ordinary for this Starlink launch? Including its test satellites, SpaceX has been launching these artificial moonlets since 2018 (https://en.wikipedia.org/wiki/List_of_Starlink_launches ), so the geomagnetic conditions for those more than 30 previous launches were quickly checked. The graph underneath shows the minimum Dst and maximum Ap 1 day after launch (blue dots). As can be seen, The 4 February 2022 operations (1 day after launch ; red dot) clearly took place during geomagnetic conditions not encountered so far by the Starlink fleet. That's no surprise, as most of the launches took place during solar cycle minimum. On the other hand, it's clear that this was not an extraordinarily strong storm. To illustrate this, a few of the strongest geomagnetic storming days of the previous solar cycle (SC24, green dots) were added and can be seen in the upper-right corner of the graph.
The course of events on that fatal day was explained by SpaceX in their 8 February communication (https://www.spacex.com/updates/ ). Shortly after launch, the satellites were put -as usual- in a stand-by orbit with a perigee (point closest to Earth) of 210 km, before being transferred to their final orbit at 540 km altitude. Note 210 km is just above the minimum orbit altitude for a satellite, which is grosso modo 180 +/-20 km pending size and shape of the satellite. SpaceX does this on purpose, because in the very rare case a satellite does not pass the initial system checkouts, it will quickly be deorbited by atmospheric drag (friction between the atmosphere and the satellite; see the related STCE news item at https://www.stce.be/news/452/welcome.html ).
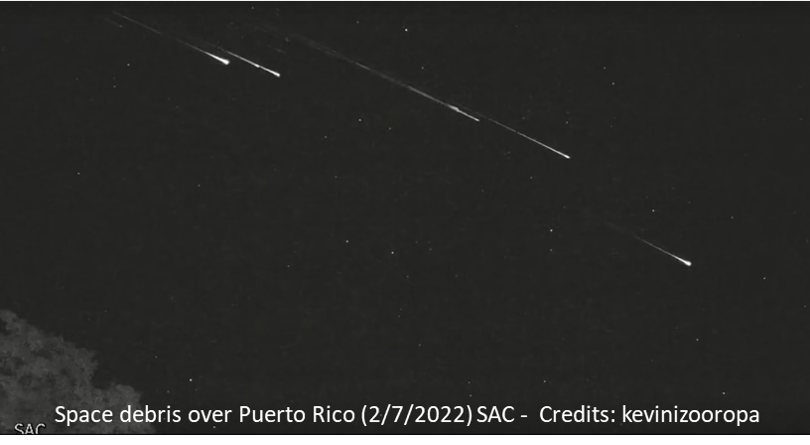
As it happened, the satellites were at this low altitude portion of their orbit manoeuvre when the geomagnetic storm occurred. Onboard GPS suggested the strength of the storm caused atmospheric drag to increase up to 50 percent higher than during previous launches. The Starlink team then took the decision to let the satellites go into safe mode which allowed them to fly a path that minimized drag. However, the encountered drag remained high preventing to leave safe mode and to start the orbit raising procedures. A number of the affected Starlink satellites seems to have already re-entered the earth's atmosphere, see e.g. this YouTube video at https://www.youtube.com/watch?v=a7KUSN89-A0 showing deorbiting Starlink satellites burning up in the earth's atmosphere (screenshot underneath). The deorbiting satellites pose zero collision risk with other satellites and by design demise upon atmospheric reentry, meaning no orbital debris is created and no satellite parts hit the ground.
It's amazing that such a small storm can wreak so much havoc. With solar cycle 25 (SC25) just starting its increase towards its maximum in 2024, geomagnetic conditions such as those experienced on 3 and 4 February will become much more frequent and thus increase the risk on more Starlink satellite fatalities in years to come. If the transfer orbit is maintained at the current altitude of 210 km, best practice would be to try and launch during quiet solar and geomagnetic periods. The SIDC SWx forecast centre (http://www.sidc.be/index.php ) issues daily space weather bulletins and alerts, including an "All Quiet Alert" (valid for the next 48 hours) in case solar flaring is expected to stay below C-class level, no proton events are in the offing, and at the same time geomagnetic activity is forecasted to stay below storming levels (Kp less than 5). These conditions (all 3 together) do not happen very often during a solar cycle maximum, so best practice would be to keep an eye on the daily space weather bulletins.
This article was written with the kind contribution from Dave Pitchford (SES).
Review of solar activity
Flares
The regions NOAA 2939, 2940 and 2941 played a key role solar activity this week.
NOAA 2939 produced a long duration C3.1 flare just after noon February 6. The flare was related to a filament eruption from just South of that region. The NOAA region was dominated by its leading spot with only fragmented weaker trailing spots.
By the end of the week, as 2939 was rotating over the limb, a new region (Catania group 31, but never numbered by NOAA) emerged just immediately to the East of 2939. That region was the source of an M1.4 flare in the morning of February 12.
Later on February 12 more strong C flaring was observed from the Western limb with two successive flares peaking at C9.2 magnitude at 17:08UT and at C8 magnitude at 17:26UT. The first was from Catania group 21 (NOAA region 2940) in the North which was fairly disperse and inactive earlier in the week. The second was from Catania group 29 (NOAA region 2944) in the South (just south of 2939).
The remainder of the flaring activity was from region 2941 which throughout the week saw flux emergence in the intermediate region and by the end of the week developed mixed polarity spots in the trailing area, with consequent increasing levels of flaring.
Coronal Mass Ejections
Associated to the long duration C3.1 flare and filament eruption a CME was visible in LASCO C2 coronagraph images from 14:36UT February 6 onwards. From LASCO perspective, it was a (partial) halo with somewhat disconnected components to the North and South. It was also observed in STEREO A COR coronagraph from 14:09UT onwards, with a similar multipart view and propagating Westward. The CME was obviously Earth directed with a speed estimated to be around 900km/s and an expected arrival around noon February 9. (It eventually arrived 8 hours after the forecast arrival time).
SoHO LASCO C2 coronagraph data showed a partial halo CME from 00:48UT February 11 onwards. Combined with STEREO A data, the CME was judged to be backward.
Later Westward CMEs associated to the M flare and the strong C flares from near the limb were too far off the Sun-Earth line to influence Earth.
Coronal Hole
A recurrent equatorial negative polarity Coronal Hole is crossed the central meridian on February 10 and was expected to influence Solar wind at Earth from February 13 onwards.
Particle flux
The greater than 10 MeV proton flux was at nominal levels over the period. The greater than 2 MeV electron flux was above the 1000 pfu alert initially following the high speed stream conditions as we started the week, but reduced to below or around the event level after the CME arrival. The 24h electron fluence was at moderate to high levels initially, then reduced to normal to moderate levels after the CME arrival.
Review of geomagnetic activity
At the start of the week, solar wind data showed the transition from a high speed stream to a slow speed stream. A weak shock in the evening of February 9 then marked the arrival of the February 6 CME. The speed of the passing CME did not reach over 450km/s. From noon February 10, the CME core passed. During its pass, the orientation of the Bz component changed from directly Southward (with magnitude Bz=-13nT) to entirely Northward (Bz=18nT). By midnight February 11/12, the solar wind data indicated a transition from the wake of the CME into a fast solar wind with speeds reaching over 550km/s.
The passage of the CME core and the onset of the high speed stream induced a minor geomagnetic storms.
PROBA2 Observations (7 Feb 2022 - 13 Feb 2022)
Solar Activity
Solar flare activity fluctuated from low to moderate during the week.
In order to view the activity of this week in more detail, we suggest to go to the following website from which all the daily (normal and difference) movies can be accessed: https://proba2.oma.be/ssa
This page also lists the recorded flaring events.
A weekly overview movie can be found here (SWAP week 620). https://proba2.sidc.be/swap/data/mpg/movies/weekly_movies/weekly_movie_2022_02_07.mp4
Details about some of this week's events can be found further below.
If any of the linked movies are unavailable they can be found in the P2SC movie repository here
https://proba2.sidc.be/swap/data/mpg/movies/
Tuesday Feb 8
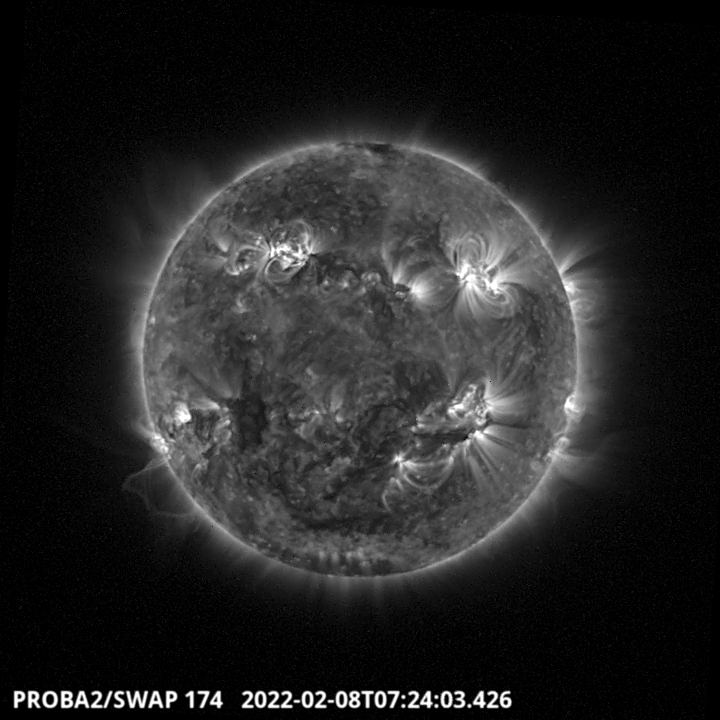
A prominence eruption from the southeastern limb of the Sun is visible on the SWAP image
above around 7:24 UT. Find a movie of the events here (SWAP movie) https://proba2.sidc.be/swap/data/mpg/movies/20220208_swap_movie.mp4
Saturday Feb 12
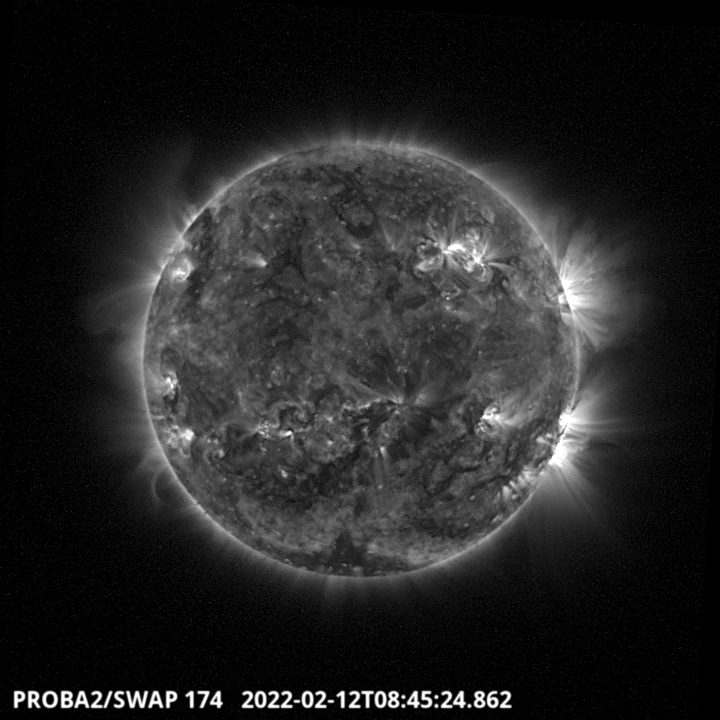
The largest flare of the week is a M1.4 flare that erupted around 8:45 UT close to the South-West
limb. Find a movie of the events here (SWAP movie) https://proba2.sidc.be/swap/data/mpg/movies/20220212_swap_movie.mp4

The M1.4 flare has been recorded by LYRA. Find the image here https://proba2.sidc.be/lyra/data/GoesLyra/images/GoesLyra20220212.png
The International Sunspot Number by Silso
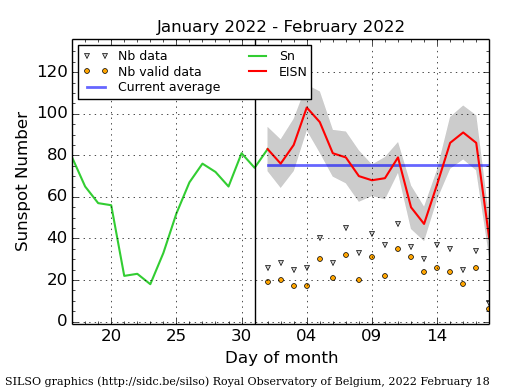
The daily Estimated International Sunspot Number (EISN, red curve with shaded error) derived by a simplified method from real-time data from the worldwide SILSO network. It extends the official Sunspot Number from the full processing of the preceding month (green line), a few days more than one solar rotation. The horizontal blue line shows the current monthly average. The yellow dots gives the number of stations that provided valid data. Valid data are used to calculate the EISN. The triangle gives the number of stations providing data. When a triangle and a yellow dot coincide, it means that all the data is used to calculate the EISN of that day.
Noticeable Solar Events (7 Feb 2022 - 13 Feb 2022)
| DAY | BEGIN | MAX | END | LOC | XRAY | OP | 10CM | TYPE | Cat | NOAA |
| 12 | 0825 | 0844 | 0856 | S19W84 | M1.4 | SN | III/2II/2IV/1 |
| LOC: approximate heliographic location | TYPE: radio burst type |
| XRAY: X-ray flare class | Cat: Catania sunspot group number |
| OP: optical flare class | NOAA: NOAA active region number |
| 10CM: peak 10 cm radio flux |
Geomagnetic Observations in Belgium (7 Feb 2022 - 13 Feb 2022)
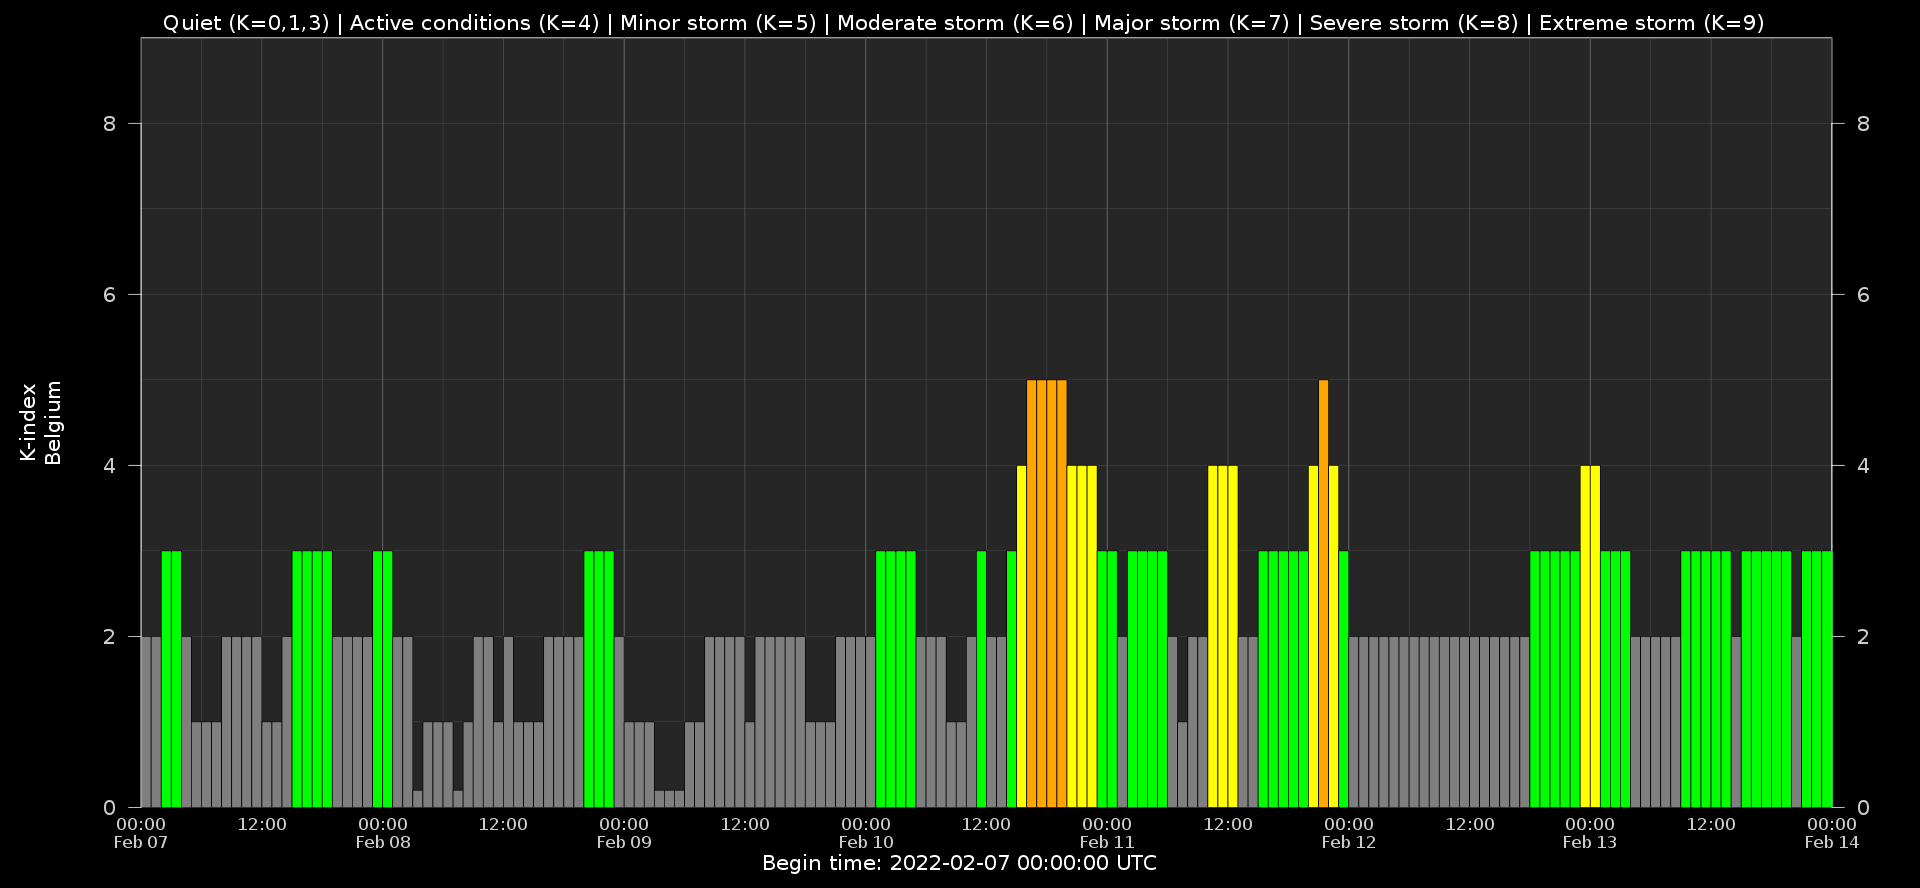
Local K-type magnetic activity index for Belgium based on data from Dourbes (DOU) and Manhay (MAB). Comparing the data from both measurement stations allows to reliably remove outliers from the magnetic data. At the same time the operational service availability is improved: whenever data from one observatory is not available, the single-station index obtained from the other can be used as a fallback system.
Both the two-station index and the single station indices are available here: http://ionosphere.meteo.be/geomagnetism/K_BEL/
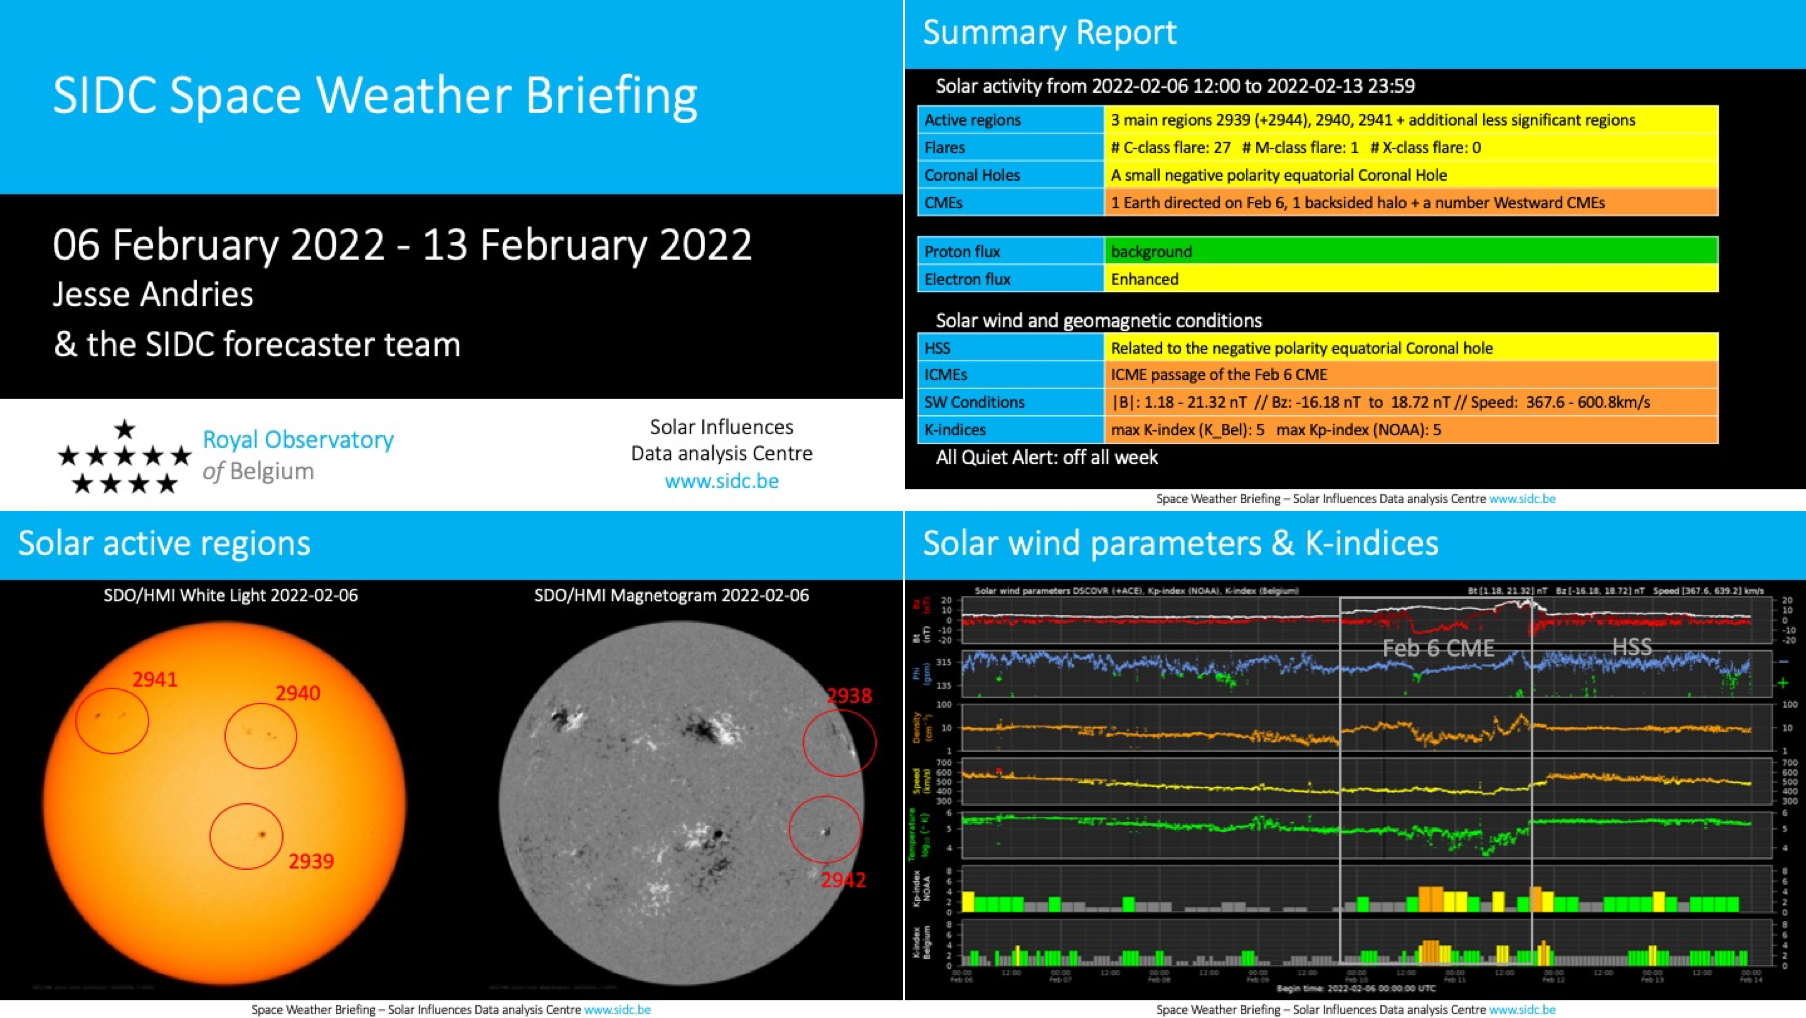
The SIDC Space Weather Briefing
The Space Weather Briefing presented by the forecaster on duty from Feb 7 to 13. It reflects in images and graphs what is written in the Solar and Geomagnetic Activity report: https://www.stce.be/briefings/20220214_SWbriefing.pdf
If you need to access the movies, contact us: stce_coordination at stce.be
Review of ionospheric activity (7 Feb 2022 - 13 Feb 2022)
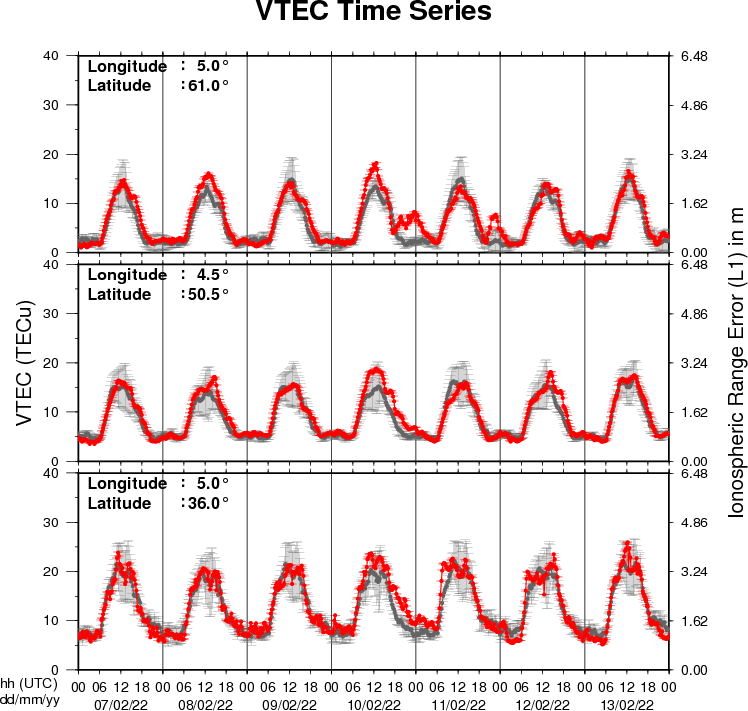
The figure shows the time evolution of the Vertical Total Electron Content (VTEC) (in red) during the last week at three locations:
a) in the northern part of Europe(N 61deg E 5deg)
b) above Brussels(N 50.5deg, E 4.5 deg)
c) in the southern part of Europe(N 36 deg, E 5deg)
This figure also shows (in grey) the normal ionospheric behaviour expected based on the median VTEC from the 15 previous days.
The VTEC is expressed in TECu (with TECu=10^16 electrons per square meter) and is directly related to the signal propagation delay due to the ionosphere (in figure: delay on GPS L1 frequency).
The Sun's radiation ionizes the Earth's upper atmosphere, the ionosphere, located from about 60km to 1000km above the Earth's surface.The ionization process in the ionosphere produces ions and free electrons. These electrons perturb the propagation of the GNSS (Global Navigation Satellite System) signals by inducing a so-called ionospheric delay.
See http://stce.be/newsletter/GNSS_final.pdf for some more explanations ; for detailed information, see http://gnss.be/ionosphere_tutorial.php
Action!
Check out our activity calendar: activities and encounters with the Sun-Space-Earth system and Space Weather as the main theme. We provide occasions to get submerged in our world through educational, informative and instructive activities.
If you want your event in our calendar, contact us: stce_coordination at stce.be
* February 14-18, online Space Weather Introductory Course by SWEC, Space Weather Education Center - registrations are open
* February 22, Public Lecture on Space Weather and Aviation (Dutch), Urania, Hove, Belgium
* February 26, Public Lecture on Space Weather, Satellites and Aviation (Dutch), UGent Volkssterrenwacht Armand Pien, Gent, Belgium
* March 14-16, onsite (!) Space Weather Introductory Course by SWEC, Space Weather Education Center - registrations are open
* March 22, Wetenschapsbattle
* March 25-26, Space Days in Leuven
* April 5-17, SUN exhibit at the Africa Museum
* April 26, Public Lecture on the Solar Corona in EUV (Dutch), Urania, Hove, Belgium
* April 28, Public Lecture on SDO/EUI, Astropolis, Oostende, Belgium
* August 25, Public Lecture on Space Weather and Aviation, Astropolis, Oostende, Belgium
* October 24-28, 18th European Space Weather Week, Zagreb, Croatia
Check: https://www.stce.be/calendar
