- Table of Content
- 1.Solar frenzy!
- 2.Review of sola...
- 3.Review of geom...
- 4.The Internatio...
- 5.PROBA2 Observa...
- 6.Geomagnetic Ob...
- 7.The SIDC Space...
- 8.Review of iono...
- 9.Action!
2. Review of solar activity (21 Feb 2022 - 27 Feb 2022)
3. Review of geomagnetic activity
4. The International Sunspot Number by Silso
5. PROBA2 Observations (21 Feb 2022 - 27 Feb 2022)
6. Geomagnetic Observations in Belgium (21 Feb 2022 - 27 Feb 2022)
7. The SIDC Space Weather Briefing
8. Review of ionospheric activity (21 Feb 2022 - 27 Feb 2022)
9. Action!
Solar frenzy!
On 15 February 2022, a spectacular eruption took place on the Sun's far side. The wide field-of-view of Solar Orbiter's "Full Sun Imager" (FSI) currently allows for a lot of viewing margin around the solar disc, and so it was able to track the stunning eruption out to about 3.5 million kilometers, equivalent to five times the radius of the Sun. This was the largest solar prominence eruption ever observed in a single image together with the full solar disc. The observations were extensively covered in the ESA press release (https://www.esa.int/Science_Exploration/Space_Science/Solar_Orbiter/Giant_solar_eruption_seen_by_Solar_Orbiter ) as well as in this STCE News item (https://www.stce.be/content/press-release-unique-images-solar-cloud ).
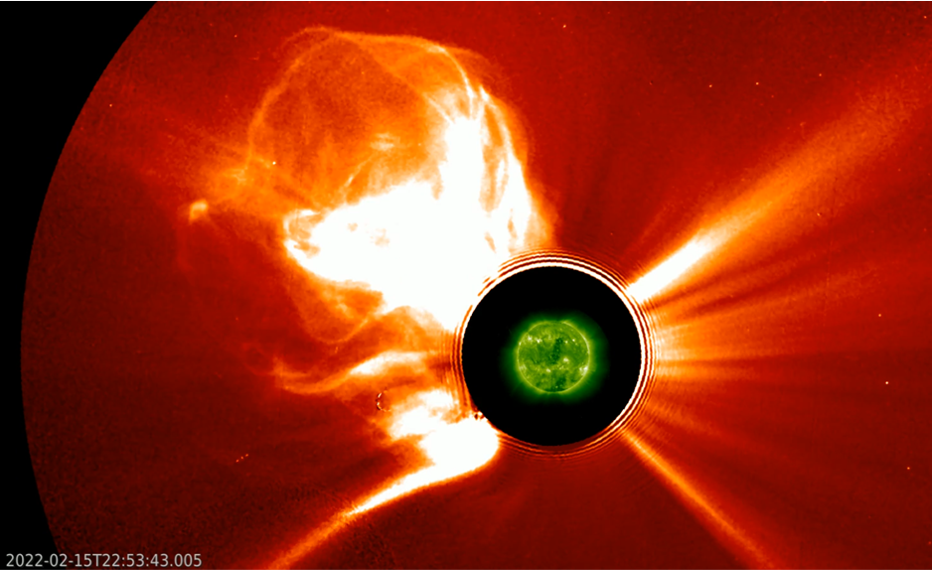
The imagery above combines extreme ultraviolet (EUV) pictures of the Sun with white light coronagraphic images as obtained by instruments on board the STEREO-A spacecraft (EUVI 195, COR2 ; https://stereo-ssc.nascom.nasa.gov/ ) which is currently trailing the Earth by about 34 degrees. Clearly, the eruption took place on the Sun's far side even from the STEREO-A's point of view. With no other spacecraft being able to image the blast site itself, it seems we can't say much on the source of the eruption. Or can we?
Enters helioseismology. This branch of solar research is very similar to seismology on Earth, where by studying the waves induced by earthquakes, scientists get an idea on the Earth's interior. Indeed, by carefully "listening" to the up and down movements all over the solar surface, helioseismologists get a pretty good idea on the specifics of the solar interior. Moreover, by studying the related acoustic waves that are travelling through the solar interior, they can virtually "see" any rather big, active region that may be present on the far side. Such maps are available from ground-based networks (NSO/GONG - https://farside.nso.edu/ ) and space-based observations (JSOC/SDO/HMI - http://jsoc.stanford.edu/data/timed/ ).
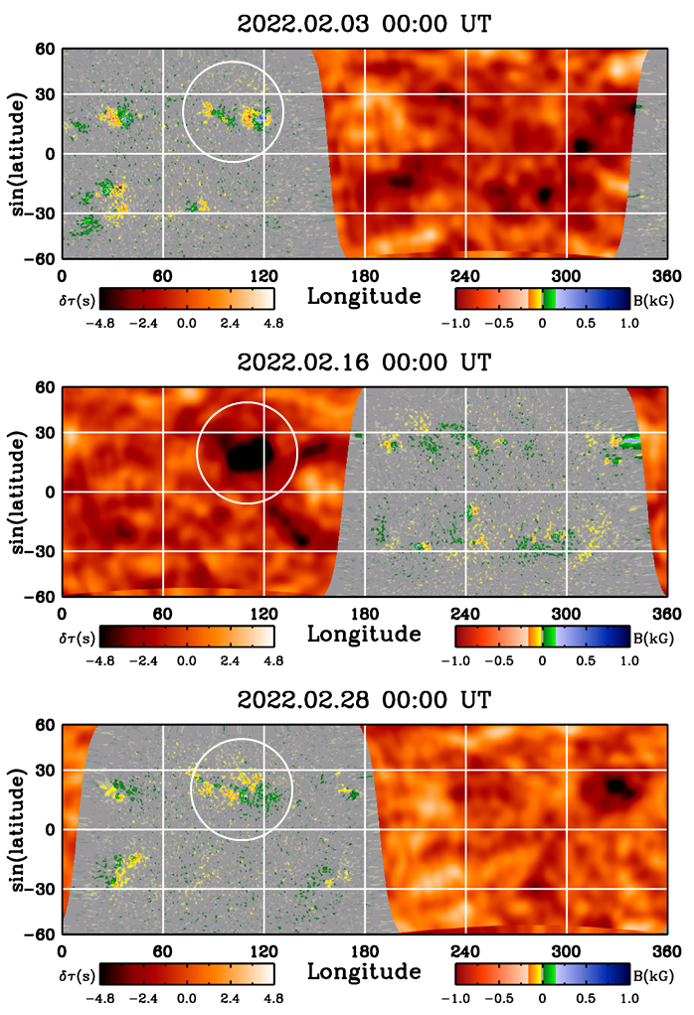
The triptych above shows full Sun images (between latitudes -60° and +60°) stitching together HMI magnetograms (grayish ; earth-facing solar hemisphere) and helioseismic observations (orangish ; far side) as available at JSOC/SDO/HMI. Concentrations of magnetic fields (active regions) can be seen in the magnetograms as blue-greenish and red-yellowish patches, whereas in the helioseismic maps these concentrations are represented by dark patches. The compilation shows a synoptic map of the Sun on 16 February (00UT - middle image) and about half a solar rotation before (03 February - top) and after (28 February - bottom) the eruption. A clip of these maps covering most of the month of February is available in the online version of this article at https://www.stce.be/news/575/welcome.html
At the time of the 15 February eruption, a dark patch near latitude +25° and longitude 120° (as annotated by the white circle) is clearly distinguishable in the helioseismic map, corresponding with the location of old active region NOAA 2936 (top image) and NOAA 2954 (bottom image). Note this is the same active region, it just got a different NOAA number. This patch is rather large, indicative that the map cannot distinguish between the nearby active regions resp. NOAA 2938 and NOAA 2955, and thus takes them altogether. It seems fairly straightforward to conclude that NOAA 2936 was the source of the eruption. This sunspot group showed episodes of important flux emergence during its previous transit over the solar disc, as outlined in this STCE News item at https://www.stce.be/news/572/welcome.html Also, some of the eruptions in this region were quite complex as can be seen in the related clips. For the 15 February event, the helioseismic images do not reveal if the eruption was solely rooted in NOAA 2936, or if it was due to interactions with nearby active regions such as NOAA 2938, or from newly emerging magnetic flux. At the time of the eruption, NOAA 2936 was located about 50° to 60° behind the east limb as seen from Earth, and thus about 15° to 25° behind the east limb as seen from STEREO-A. By studying various features in the coronal mass ejection (CME) and triangulating their positions, researchers are now trying to determine how much these features were deflected from the source region.
As STEREO-A will be approaching the Earth in the coming years, its view on the Sun's far side will diminish even further, leaving helioseismic imagery as the sole systematic data source for what's happening on the hidden solar half (see also this STCE News item at https://www.stce.be/news/307/welcome.html ). Fortunately, EUV images from Solar Orbiter may occasionally help if -from Earth's perspective- the spacecraft is at the right position in its orbit around the Sun.
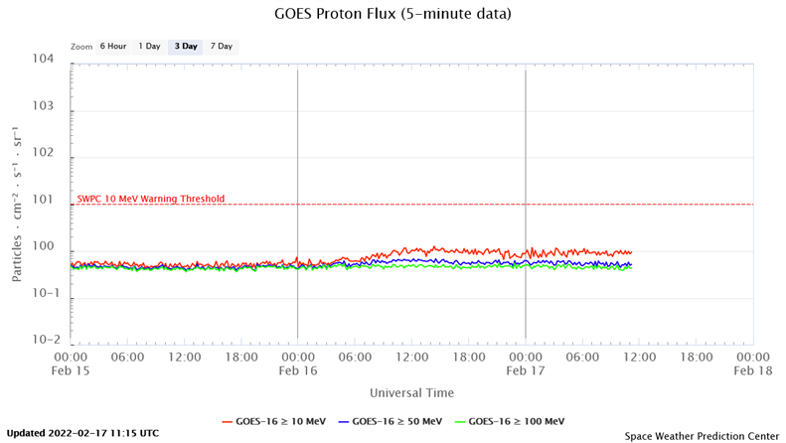
Meanwhile, researchers are still in ecstasy and continue analyzing the various and amazing observations made during the 15 February eruption. For example, despite its location on the Sun's far side, a coronal wave (see https://www.stce.be/news/241/welcome.html for more info) was observed in AIA 193 images made by the SDO satellite, meaning that this feature was visible from the Earth's vantage point. And GOES-16 recorded a mild enhancement in the greater than 10 MeV proton flux, again despite the far-side location of the source region which would normally result in a very poor magnetic connection between the Sun and Earth for this kind of events. These happenings are very rare, but they have happened in the past. Notorious examples are the eruptions of 1 September 2014 (https://www.stce.be/news/266/welcome.html ) and 23 July 2012 (https://www.stce.be/news/152/welcome.html ). These observations suggest that the associated flare might have been quite strong too. Based on preliminary values for the speed of the CME, a value for the flare's soft x-rays peak in the X10-X20 range is certainly possible. Nonetheless, this result should be taken with some caution, in view of the uncertainty in the CME speeds and the uncertainties in the equations used (Salas-Matamoros and Klein 2015, https://link.springer.com/article/10.1007/s11207-015-0677-0 ). It would have been quite a spectacle if we had had a solar satellite observing the flaring location on the Sun's far side that day.
Review of solar activity (21 Feb 2022 - 27 Feb 2022)
In the first half of the week, active region 2955 released 2 C flares. The last days of the week, regions 2956, 2957 and an as yet unnumbered region appeared from behind the East limb, featuring a lot of activity and 2 C flares. The GOES X-ray flux background varied between B1 and B2 level.
No Earth-directed Coronal Mass Ejections were observed in available coronagraphic imagery.
The greater than 10 MeV proton flux was at nominal levels.
Following a high speed stream from a negative polarity extension of the southern polar coronal hole, the greater than 2 MeV electron flux reached moderate levels on from February 24 to 27.
The greater than 2 MeV electron fluence was nominal throughout the week.
Review of geomagnetic activity
A high speed stream from a negative polarity extension of the southern polar coronal hole arrived near Earth on February 19. DSCOVR registered a maximal value of the Interplanetary Magnetic Field (IMF) of 12 nT on February 19 and a maximal value of the wind speed of 590 km/s on February 22. The signature of the coronal hole was visible in the solar wind until February 24.
A high speed stream associated with a positive polarity equatorial coronal hole reached the Earth on February 27. It pushed the solar wind speed up to 540 km/s and the IMF to 14 nT on February 28.
K-BEL became 4 and NOAA Kp reached 5 during a few 3h-intervals from February 20 to 22.
The International Sunspot Number by Silso
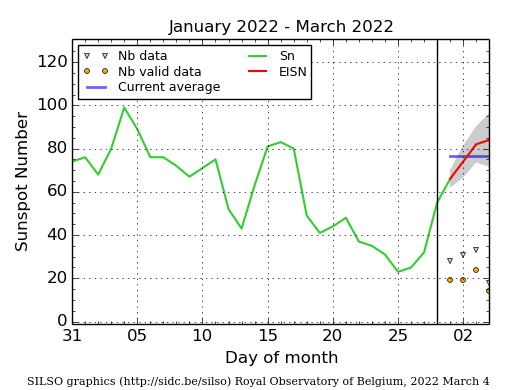
The daily Estimated International Sunspot Number (EISN, red curve with shaded error) derived by a simplified method from real-time data from the worldwide SILSO network. It extends the official Sunspot Number from the full processing of the preceding month (green line), a few days more than one solar rotation. The horizontal blue line shows the current monthly average. The yellow dots give the number of stations that provided valid data. Valid data are used to calculate the EISN. The triangle gives the number of stations providing data. When a triangle and a yellow dot coincide, it means that all the data is used to calculate the EISN of that day.
PROBA2 Observations (21 Feb 2022 - 27 Feb 2022)
Solar Activity
Solar flare activity fluctuated from very low to low during the week.
In order to view the activity of this week in more detail, we suggest to go to the following website from which all the daily (normal and difference) movies can be accessed: https://proba2.oma.be/ssa
This page also lists the recorded flaring events.
A weekly overview movie can be found here (SWAP week 622). https://proba2.oma.be/swap/data/mpg/movies/weekly_movies/weekly_movie_2022_02_21.mp4
Details about some of this week's events can be found further below.
If any of the linked movies are unavailable they can be found in the P2SC movie repository here https://proba2.oma.be/swap/data/mpg/movies/
Thursday Feb 24
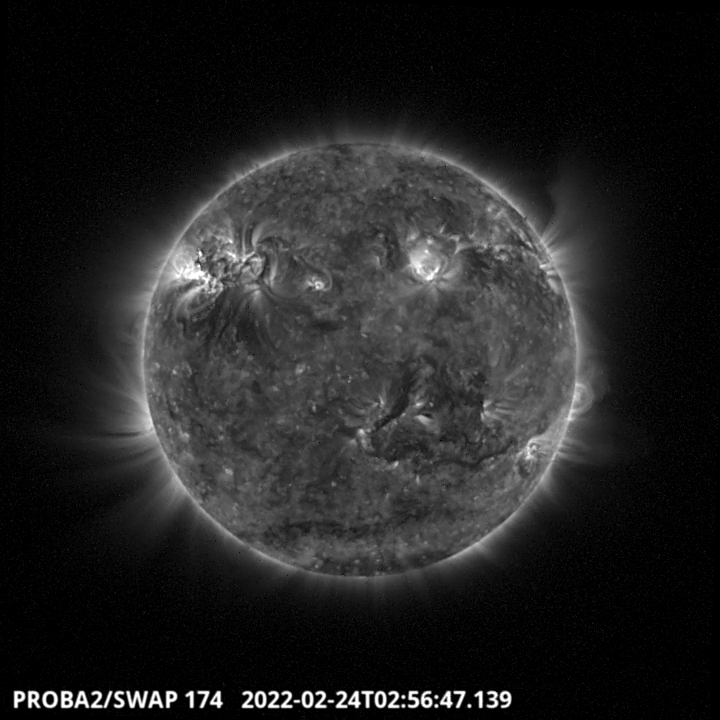
Three successive flows erupted in North East Quadrant, the last one peaking around 2:56 UT - SWAP image. Find a movie of the events here (SWAP difference movie) https://proba2.oma.be/swap/data/mpg/movies/20220224_swap_movie.mp4
Friday Feb 25
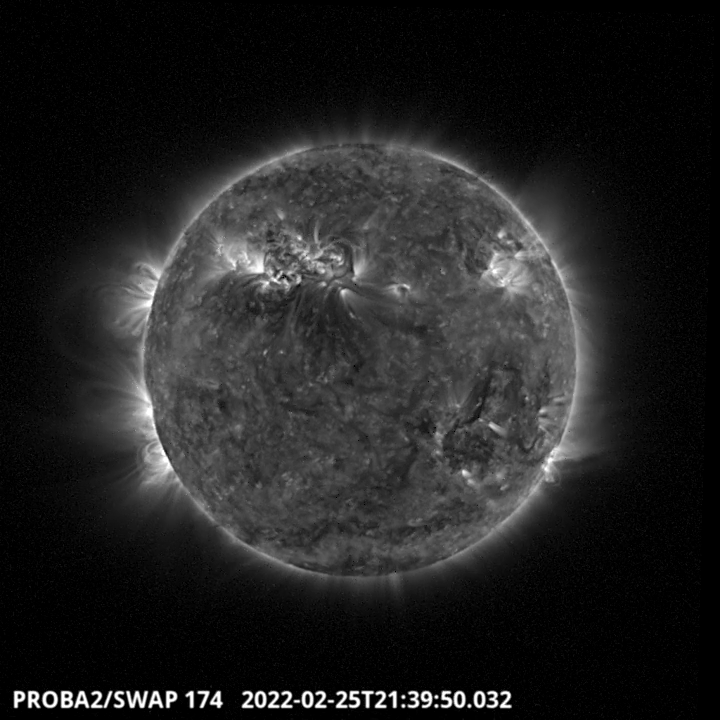
The largest flare of the week, a C5.1, erupted in the North East part of the Solar disk around 21:40 UT. Find a movie of the events here (SWAP movie) https://proba2.oma.be/swap/data/mpg/movies/20220225_swap_movie.mp4
Geomagnetic Observations in Belgium (21 Feb 2022 - 27 Feb 2022)
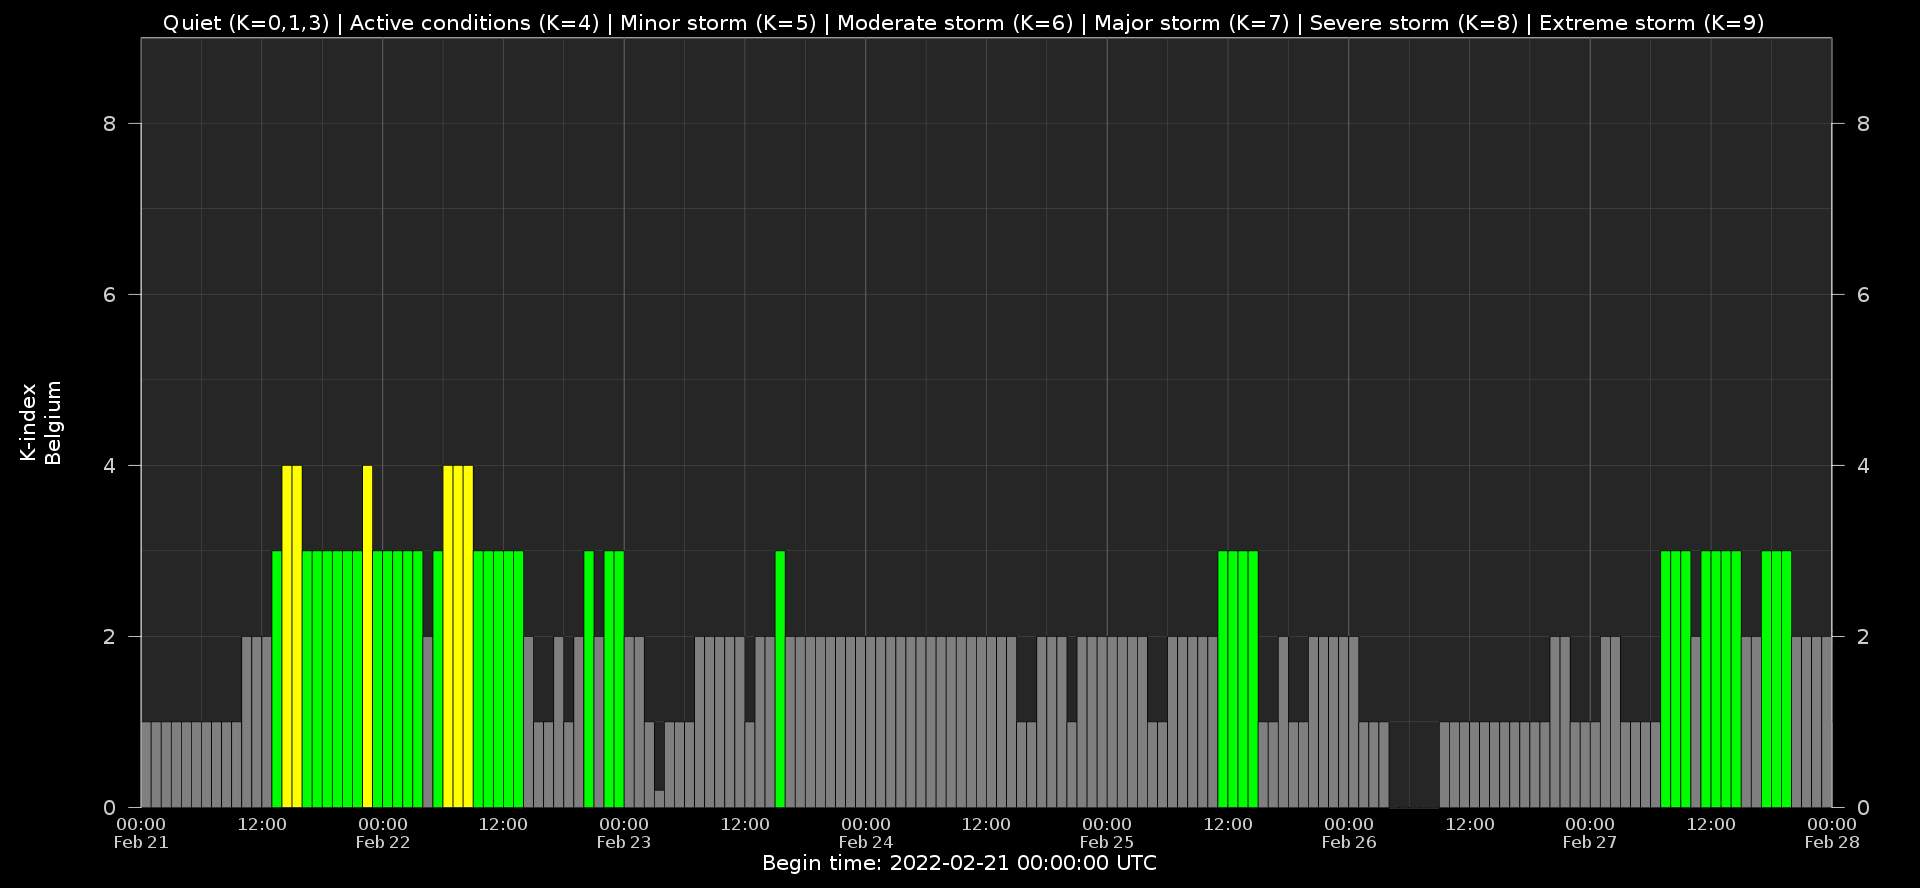
Local K-type magnetic activity index for Belgium based on data from Dourbes (DOU) and Manhay (MAB). Comparing the data from both measurement stations allows to reliably remove outliers from the magnetic data. At the same time the operational service availability is improved: whenever data from one observatory is not available, the single-station index obtained from the other can be used as a fallback system.
Both the two-station index and the single station indices are available here: http://ionosphere.meteo.be/geomagnetism/K_BEL/
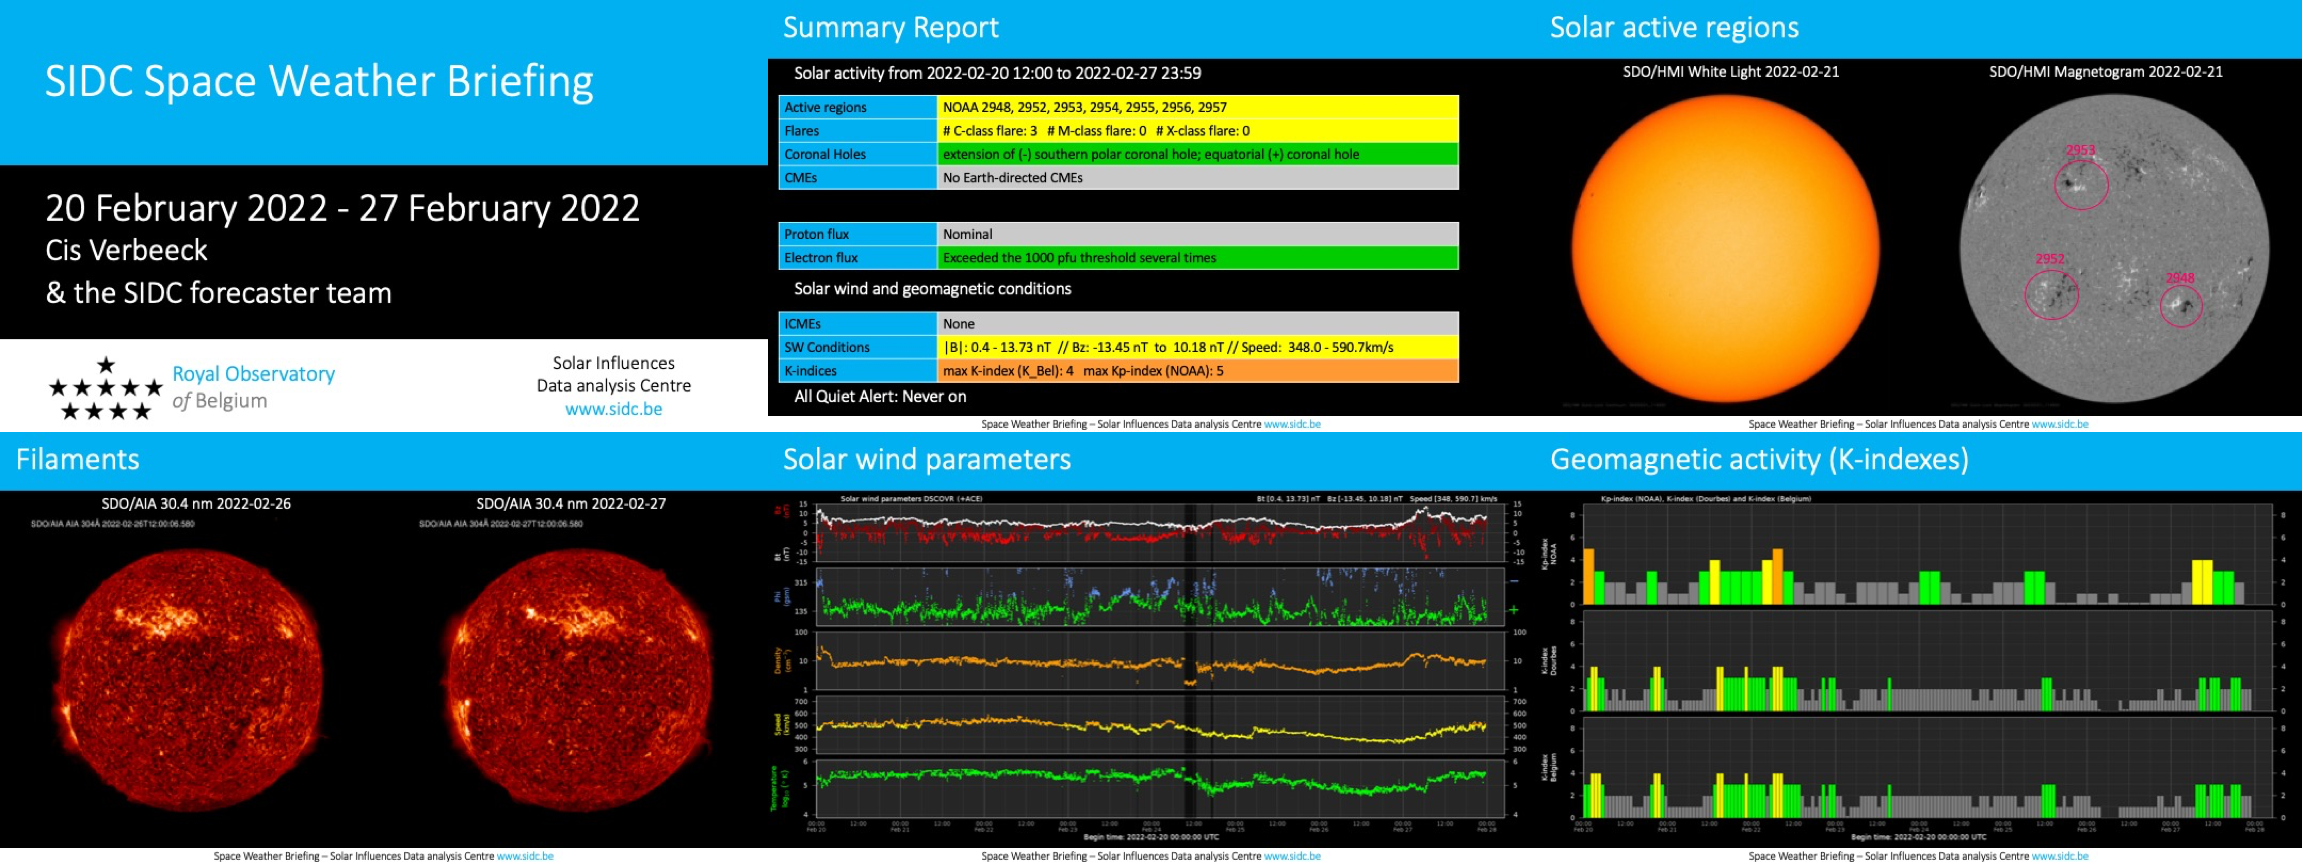
The SIDC Space Weather Briefing
The Space Weather Briefing presented by the forecaster on duty from Feb 21 to 27. It reflects in images and graphs what is written in the Solar and Geomagnetic Activity report: https://www.stce.be/briefings/20220228_SWbriefing.pdf
If you need to access the movies, contact us: stce_coordination at stce.be
Review of ionospheric activity (21 Feb 2022 - 27 Feb 2022)
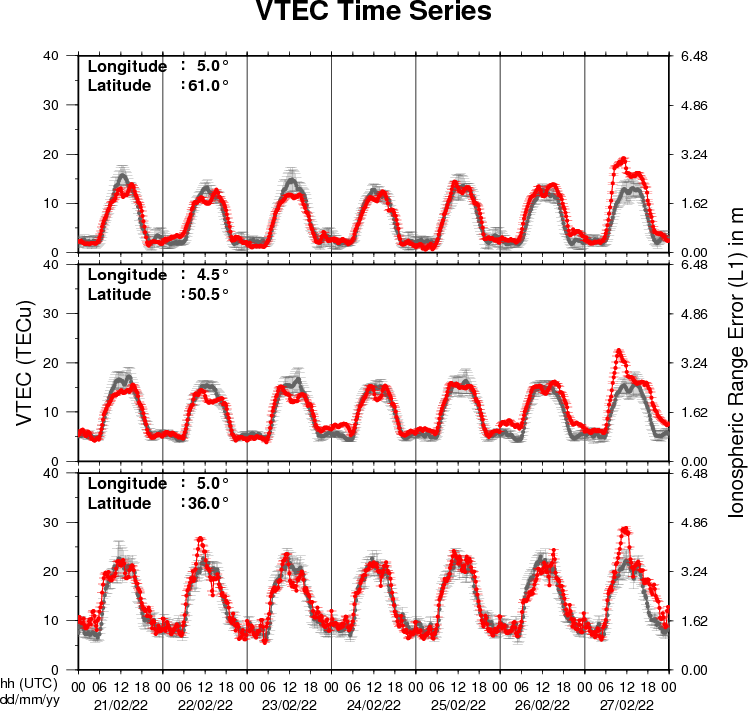
The figure shows the time evolution of the Vertical Total Electron Content (VTEC) (in red) during the last week at three locations:
a) in the northern part of Europe(N 61deg E 5deg)
b) above Brussels(N 50.5deg, E 4.5 deg)
c) in the southern part of Europe(N 36 deg, E 5deg)
This figure also shows (in grey) the normal ionospheric behaviour expected based on the median VTEC from the 15 previous days.
The VTEC is expressed in TECu (with TECu=10^16 electrons per square meter) and is directly related to the signal propagation delay due to the ionosphere (in figure: delay on GPS L1 frequency).
The Sun's radiation ionizes the Earth's upper atmosphere, the ionosphere, located from about 60km to 1000km above the Earth's surface.The ionization process in the ionosphere produces ions and free electrons. These electrons perturb the propagation of the GNSS (Global Navigation Satellite System) signals by inducing a so-called ionospheric delay.
See http://stce.be/newsletter/GNSS_final.pdf for some more explanations ; for detailed information, see http://gnss.be/ionosphere_tutorial.php
Action!
Check out our activity calendar: activities and encounters with the Sun-Space-Earth system and Space Weather as the main theme. We provide occasions to get submerged in our world through educational, informative and instructive activities.
If you want your event in our calendar, contact us: stce_coordination at stce.be
* March 14-16, onsite (!) Space Weather Introductory Course by SWEC, Space Weather Education Center - fully booked
* March 22, Wetenschapsbattle
* March 25-26, Space Days in Leuven
* April 5-17, SUN exhibit at the Africa Museum
* April 26, Public Lecture on the Solar Corona in EUV (Dutch), Urania, Hove, Belgium
* April 28, Public Lecture on SolO/EUI, Astropolis, Oostende, Belgium
* August 25, Public Lecture on Space Weather and Aviation, Astropolis, Oostende, Belgium
* October 24-28, 18th European Space Weather Week, Zagreb, Croatia
Check: https://www.stce.be/calendar