- Table of Content
- 1.Solar activity...
- 2.You have to se...
- 3.Review of sola...
- 4.Review of geom...
- 5.PROBA2 Observa...
- 6.The Internatio...
- 7.Noticeable Sol...
- 8.Geomagnetic Ob...
- 9.The SIDC Space...
- 10.Review of iono...
- 11.Action!
2. You have to see this
3. Review of solar activity
4. Review of geomagnetic activity
5. PROBA2 Observations (21 Mar 2022 - 27 Mar 2022)
6. The International Sunspot Number by Silso
7. Noticeable Solar Events (21 Mar 2022 - 27 Mar 2022)
8. Geomagnetic Observations in Belgium (21 Mar 2022 - 27 Mar 2022)
9. The SIDC Space Weather Briefing
10. Review of ionospheric activity (21 Mar 2022 - 27 Mar 2022)
11. Action!
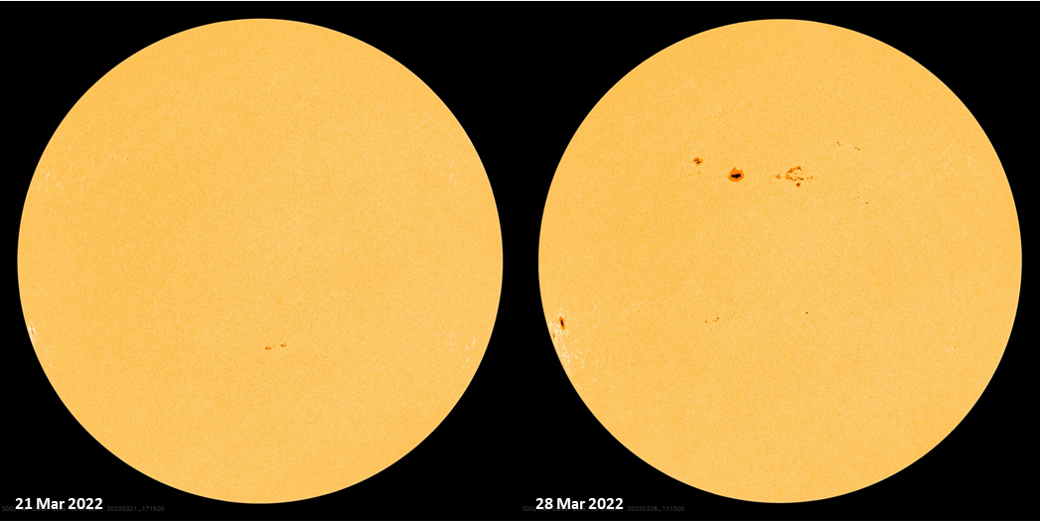
Solar activity moves up a notch
What a difference a week makes! Around the start of spring, sunspot groups were small and few. Barely a week later, sunspot groups are everywhere, rather large, complex, and flare productive. SDO/HMI (http://sdo.gsfc.nasa.gov/data/aiahmi/ ) images show only 3 small sunspot regions on 21 March, but no less than 9 on 28 March, driving the preliminary sunspot numbers from around 40 all the way up to 130 (SILSO: https://wwwbis.sidc.be/silso/eisnplot ). The difference can be seen in the HMI images underneath. Note also the presence of numerous small and inactive groups.
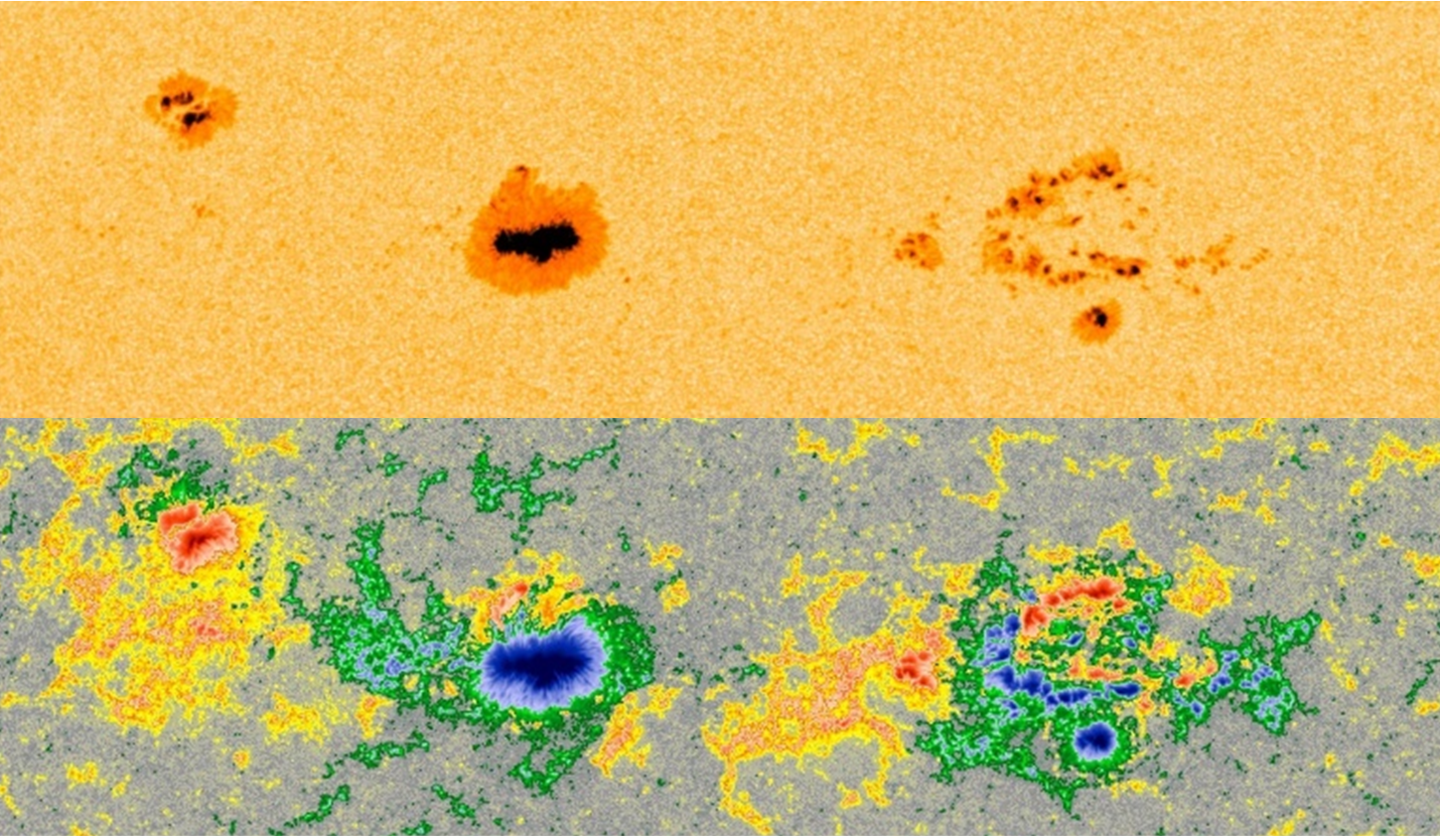
The two largest regions were NOAA 2976 and NOAA 2978, but they had a fairly open sunspot distribution and a magnetically simple configuration. NOAA 2975, which developed on 27-28 March, was smaller but growing and clearly had a much more complex magnetic structure than the 2 other regions. More importantly, it contained several delta spots, i.e. there's at least one mature spot present in which umbrae of opposite polarities are separated by less than 2 degrees and situated within the common penumbra (see the STCE's SWx classification page at https://www.stce.be/educational/classification#wilson ). These delta spots are known for their potential to trigger many and strong solar flares. The SDO images underneath were taken at 11UT on 28 March, with white light on top and the magnetogram below it. Blue and red denote opposite magnetic polarity (resp. "positive" and "negative"). At least 2 delta spots are clearly visible in NOAA 2975, which is the right-most sunspot group. Can you spot them? The answer is available in the online version of this article at https://www.stce.be/news/580/welcome.html
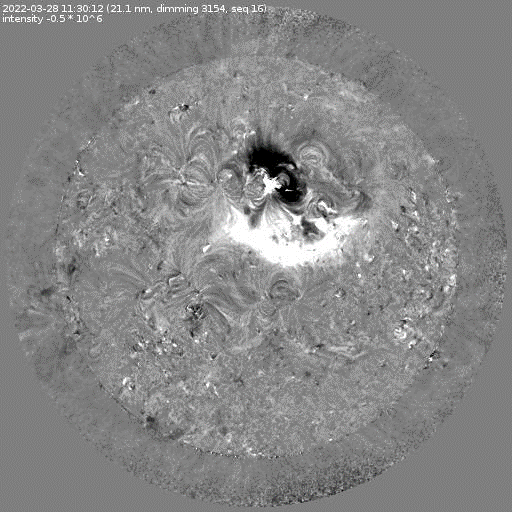
So it was not much of a surprize when NOAA 2975 started to produce M-class flares, with the strongest so far an M4.0 peaking at 11:29UT on 28 March. Imagery in extreme ultraviolet (EUV) by SDO/AIA showed an important coronal dimming near the source region (a temporary darkening in the solar corona, also somewhat confusingly known as "transient coronal hole") as well as a coronal wave (see this STCE news item at https://www.stce.be/news/241/welcome.html for more info). Solar Demon (https://wwwbis.sidc.be/solardemon/ ) captured both features very nicely in SDO/AIA's EUV difference images (one image subtracted from the next). They are strong indicators that a coronal mass ejection (CME) was associated with this eruption. A clip is available in the online version of this article.
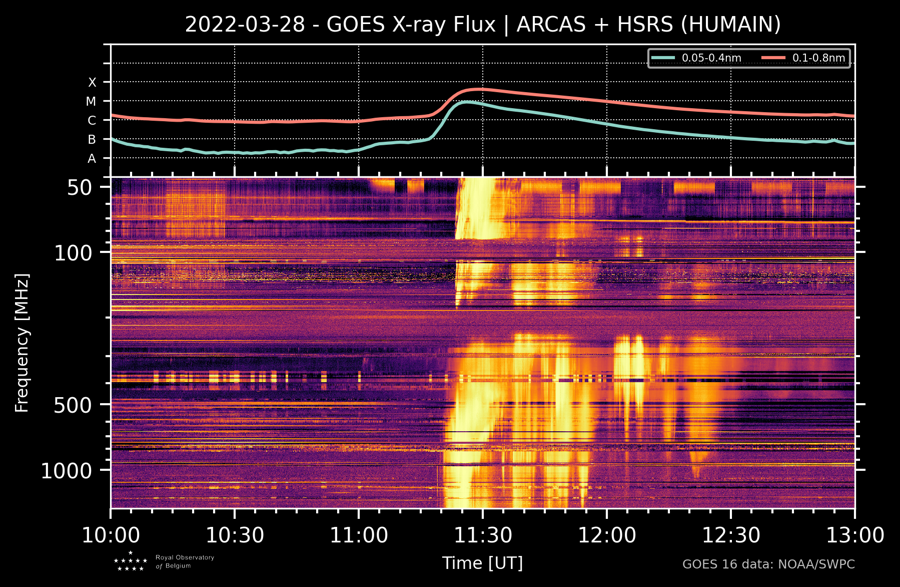
Also radio telescopes of the Humain Radioastronomy Station (https://wwwbis.sidc.be/humain/ ) recorded the eruption in frequencies between 45 and 1495 MHz. Scanning continuously the intensity at these frequencies, disturbances can be discerned which are in this case associated with a CME-driven shock (Type II) and electrons trapped in closed field lines in the post–flare coronal loops produced by flares (Type IV) - See this annotated image and the STCE's SWx classification page at https://www.stce.be/educational/classification#radio for more examples and info on Type II, Type IV and other radio bursts. Note that shock speeds deduced from Type II radio bursts are rarely used in CME arrival calculations, as we usually don't know from which part of the CME/shock the emission is coming. Type IV bursts are strongly correlated with proton events, and indeed a small proton event was observed (18 pfu at 14:50UT on 28 March - https://www.stce.be/educational/acronym#P ).
The CME associated with this flare was observed by coronagraphs on board SOHO (https://soho.nascom.nasa.gov/ ) and STEREO-A (https://stereo-ssc.nascom.nasa.gov/beacon/ ) and seemed to be directed squarely at Earth. About 8 hours after the first CME, a second CME was observed which was related to an M1 flare from the same active region. Also this CME was directed towards Earth, but more importantly, it had a speed significantly higher than the first one. This can be seen in the time-elongation plots built up from STEREO-A COR2 coronagraphic running difference images, known colloquially by some as "J-plots". The CMEs are seen as diagonal bright and dark bands running from lower-left to upper-right (the vertical black bars are data gaps). The steepness of the band reflects the speed of the CME, which in this case is a bit steeper for the 2nd CME. So, this results in (plane-of-the-sky) speeds of resp. 500 and 670 km/s, and true speeds of the CMEs resp. around 650 and 870 km/s. Hence, it is very likely that this second CME will catch up with the first CME, to impact the earth environment on 31 March (WSA-ENLIL - https://www.swpc.noaa.gov/products/wsa-enlil-solar-wind-prediction ). This "CME cannibalism" is a mechanism known to produce stronger geomagnetic storms than any of the two CMEs individually, so this one will be worth watching as a strong storm (Kp=7) may be possible.
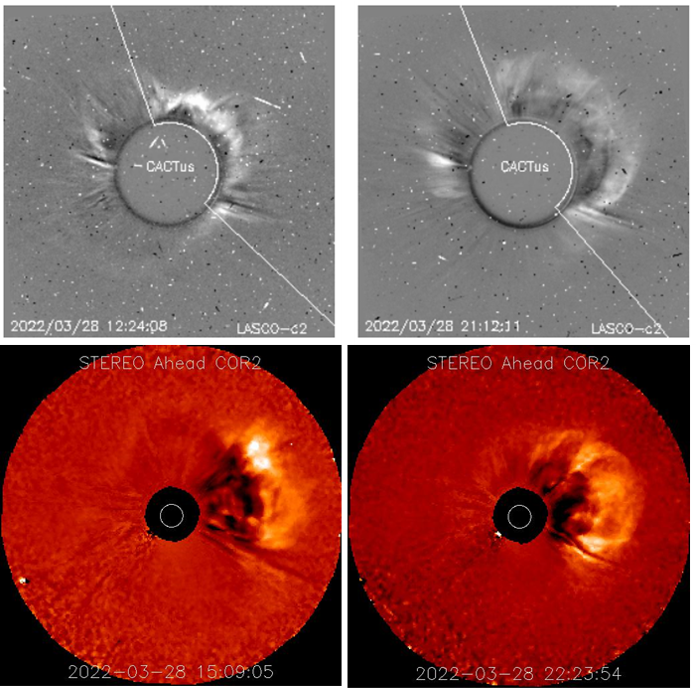
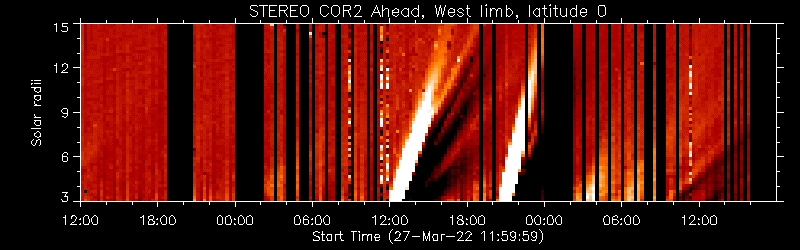
https://wwwbis.sidc.be/spaceweatherservices/applications/cor2speed/cor2speed.html#canvas_position
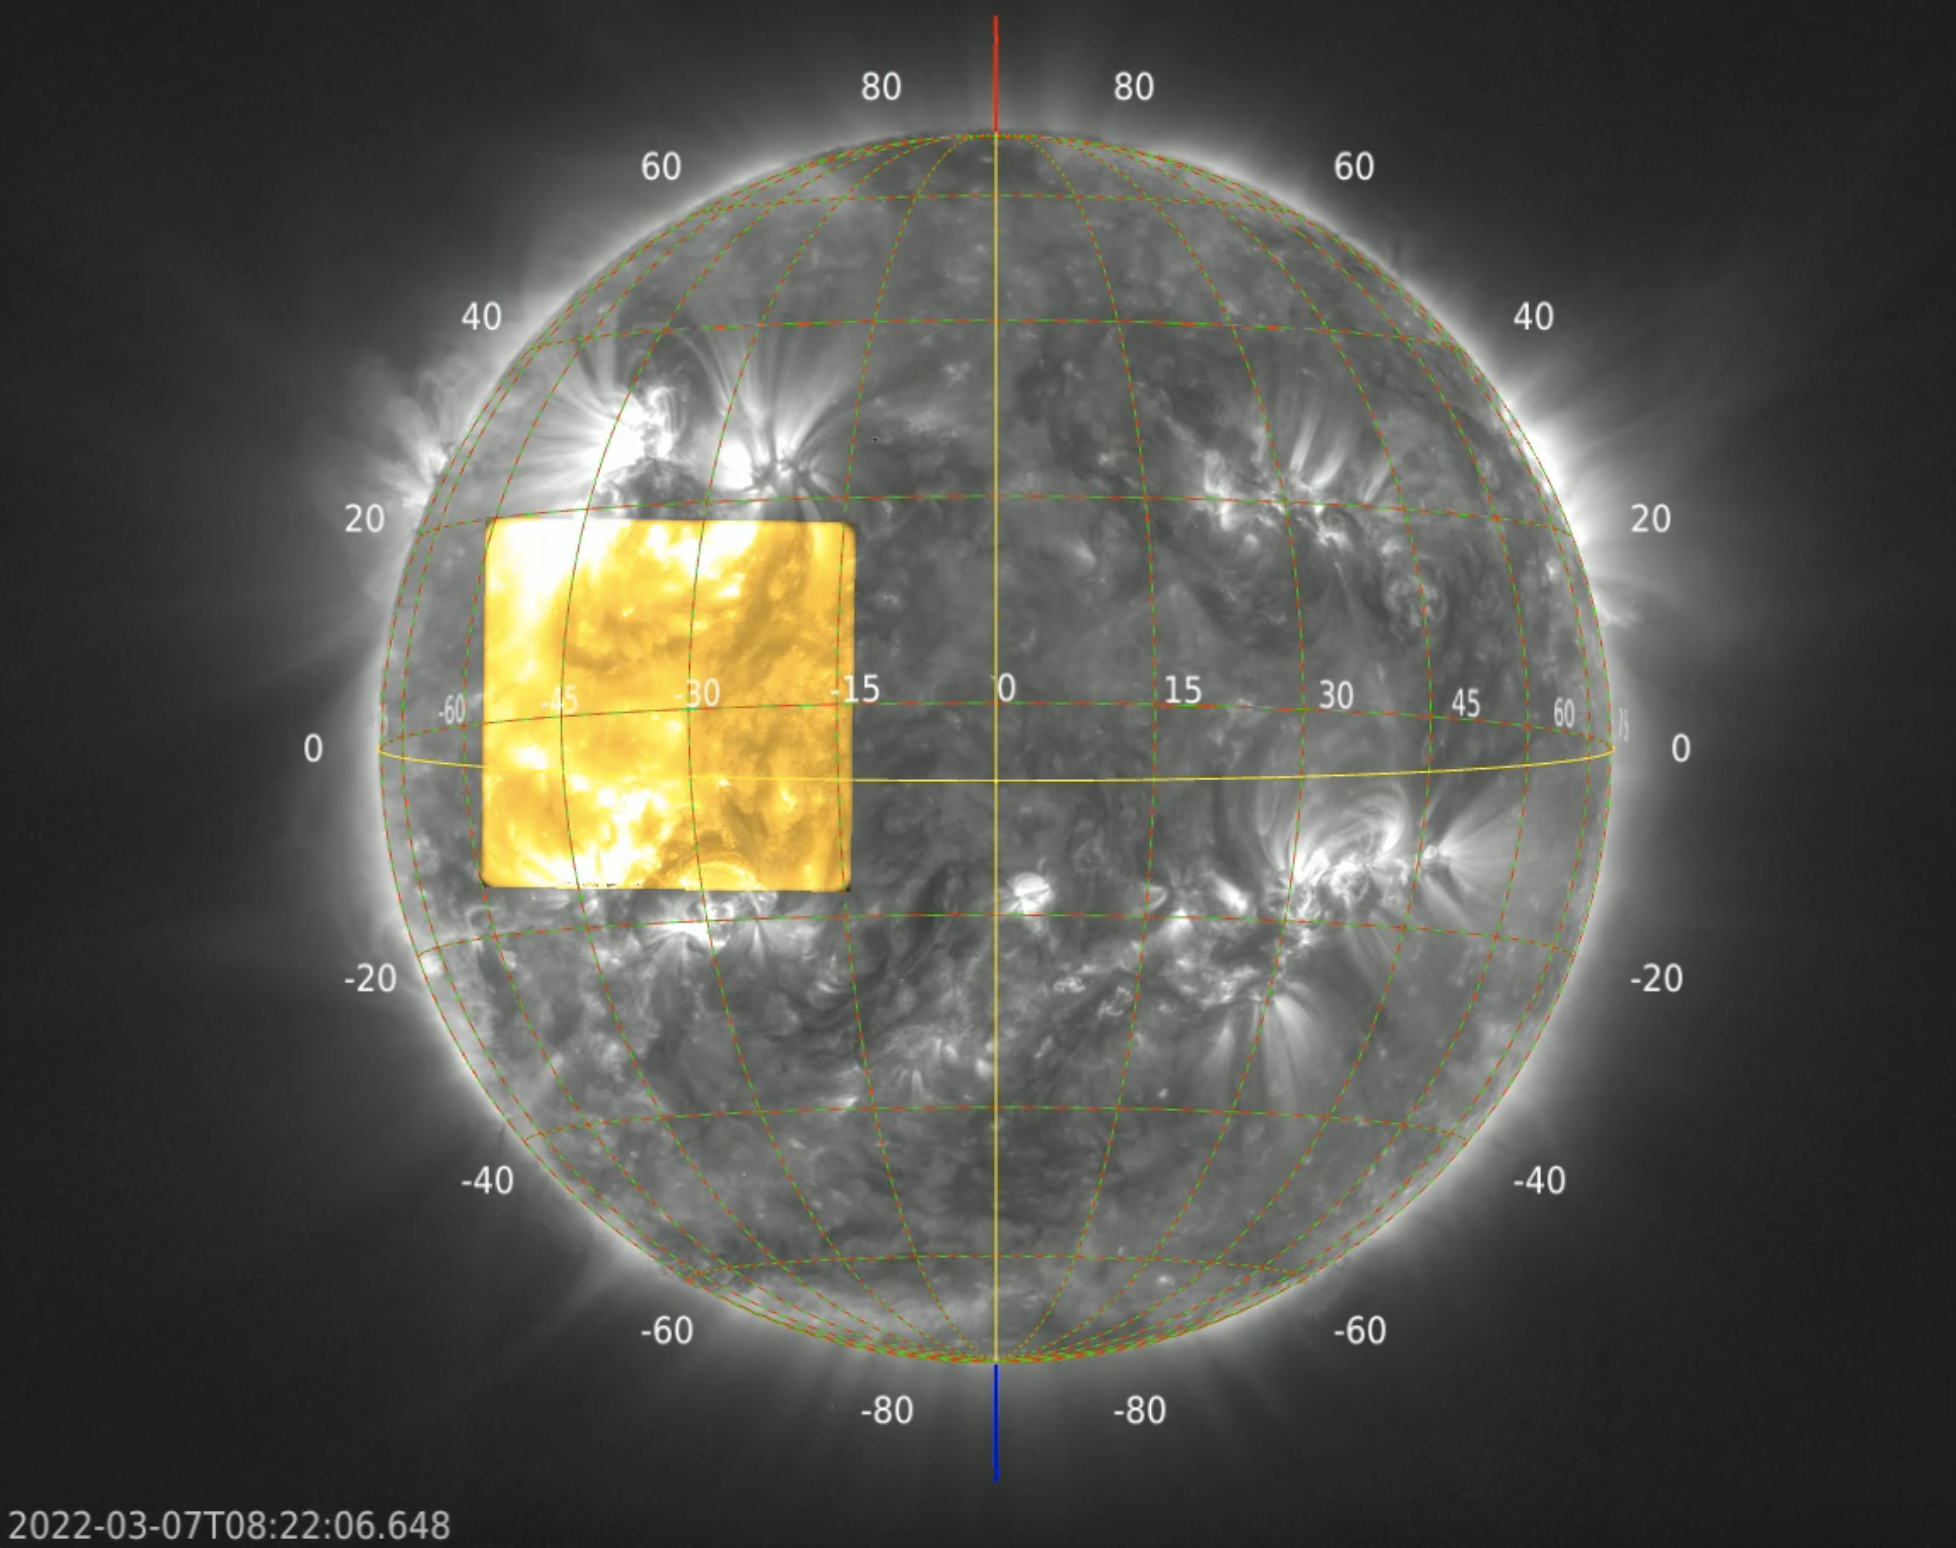
You have to see this
On 7 March 2022, the high-resolution telescope of the Extreme Ultraviolet Imager (EUI) on board Solar Orbiter made a mosaic of 25 images of the sun.
A really fun movie: https://www.stce.be/movies/JHV_2022-03-29_15.44.00.mp4
Review of solar activity
The Sun was active.
Active region NOAA-AR 2974 (Catania sunspots group 63) produced a M1.5 flare on March 25 with a peak time at 05:25 UTC. This flare was associated with a radio burst emission of types II and IV, which indicates the presence of a coronal mass ejection (CME). The AR was located near 19 degrees East and 38 degrees North. A coronal dimming reached the central meridian. The associated CME was also seen by the SOHO/LASCO-C2 coronagraph. While, then main bulk of the CME was directed to the south-east, a very fainted halo around the Sun could also be observed in the imagery. This indicates that the western flank component of this interplanetary CME may impact Earth, and enhanced the solar wind conditions near-Earth environment.
NOAA-AR 2975 (Catania sunspots group 64) produced several C-class flare including a C8.1 flare on March 24 with a peak time at 01:45 UTC.
The greater than 10 MeV proton flux showed a slight increase on March 21 around 06:45 UTC. This increase was associated to a halo Coronal Mass Ejection from a source region located on the backside of the solar disc. Then the proton flux remained a nominal levels for the rest of the past week. The greater than 2 MeV electron flux was below the 1000 pfu alert threshold and the greater than 2 MeV electron fluence was between nominal and moderate levels in the past week.
Review of geomagnetic activity
The solar wind parameters in the Earth environment (by DSCOVR) were enhanced. It reflected the high-speed streams (up to 597 km/s) associated to a small equatorial coronal hole facing Earth on March 20 (positive magnetic polarity) followed by the high-speed stream (up to 553 km/s) associated to a large equatorial coronal hole facing Earth on March 24 (positive magnetic polarity). The interplanetary magnetic field reached up to 14.9 nT and the Bz magnetic field component was ranging between -11.3 nT and 13.3 nT.
Over the past week, periods of active geomagnetic conditions were observed (K_Bel and NOAA-Kp 4) in response to the solar wind enhancement due to the fast wind coming from the coronal holes.
PROBA2 Observations (21 Mar 2022 - 27 Mar 2022)
Solar Activity
Solar flare activity fluctuated from very low to moderate during the week.
In order to view the activity of this week in more detail, we suggest to go to the following website from which all the daily (normal and difference) movies can be accessed: https://proba2.oma.be/ssa
This page also lists the recorded flaring events.
A weekly overview movie can be found here (SWAP week 626). https://proba2.sidc.be/swap/data/mpg/movies/weekly_movies/weekly_movie_2022_03_21.mp4
Details about some of this week’s events can be found further below.
If any of the linked movies are unavailable they can be found in the P2SC movie repository here https://proba2.sidc.be/swap/data/mpg/movies/
Friday Mar 25
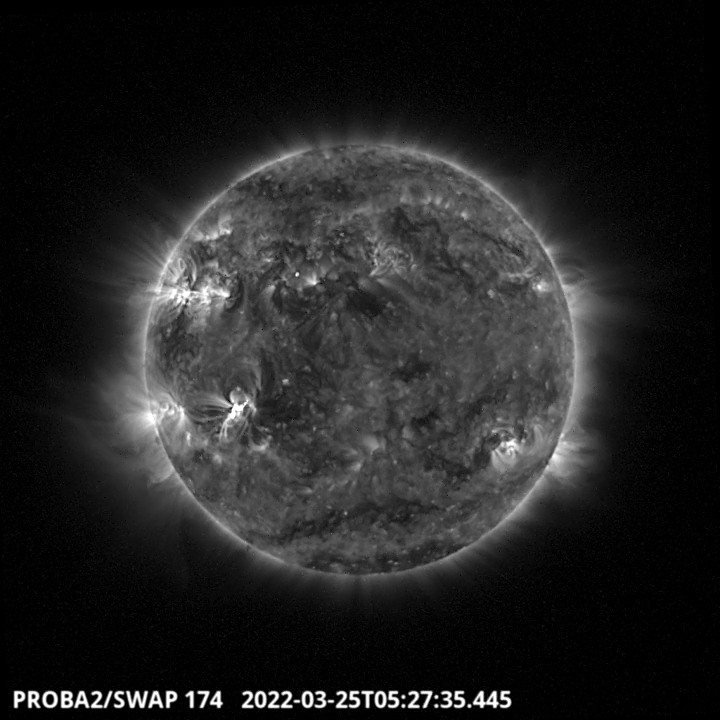
The largest flow of the week occurred in the South-East quadrant of the solar disk around 5:27
UT. It is associated to a M1.4 class flare produced by the active region NOAA 2974 - SWAP image
Find a movie of the events here (SWAP movie) https://proba2.sidc.be/swap/data/mpg/movies/20220325_swap_movie.mp4
The International Sunspot Number by Silso
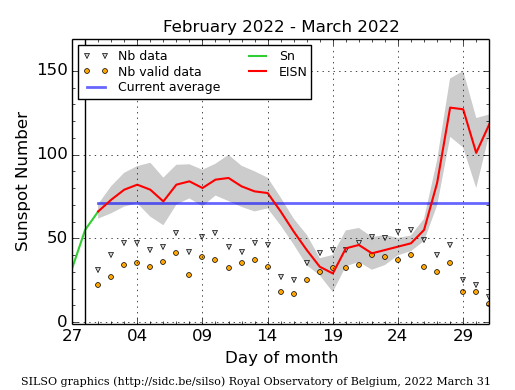
The daily Estimated International Sunspot Number (EISN, red curve with shaded error) derived by a simplified method from real-time data from the worldwide SILSO network. It extends the official Sunspot Number from the full processing of the preceding month (green line), a few days more than one solar rotation. The horizontal blue line shows the current monthly average. The yellow dots give the number of stations that provided valid data. Valid data are used to calculate the EISN. The triangle gives the number of stations providing data. When a triangle and a yellow dot coincide, it means that all the data is used to calculate the EISN of that day.
Noticeable Solar Events (21 Mar 2022 - 27 Mar 2022)
| DAY | BEGIN | MAX | END | LOC | XRAY | OP | 10CM | TYPE | Cat | NOAA |
| 25 | 0502 | 0526 | 0550 | S21E36 | M1.4 | 1F | II/2VI/2IV/2III/1 | 63 | 2974 |
| LOC: approximate heliographic location | TYPE: radio burst type |
| XRAY: X-ray flare class | Cat: Catania sunspot group number |
| OP: optical flare class | NOAA: NOAA active region number |
| 10CM: peak 10 cm radio flux |
Geomagnetic Observations in Belgium (21 Mar 2022 - 27 Mar 2022)
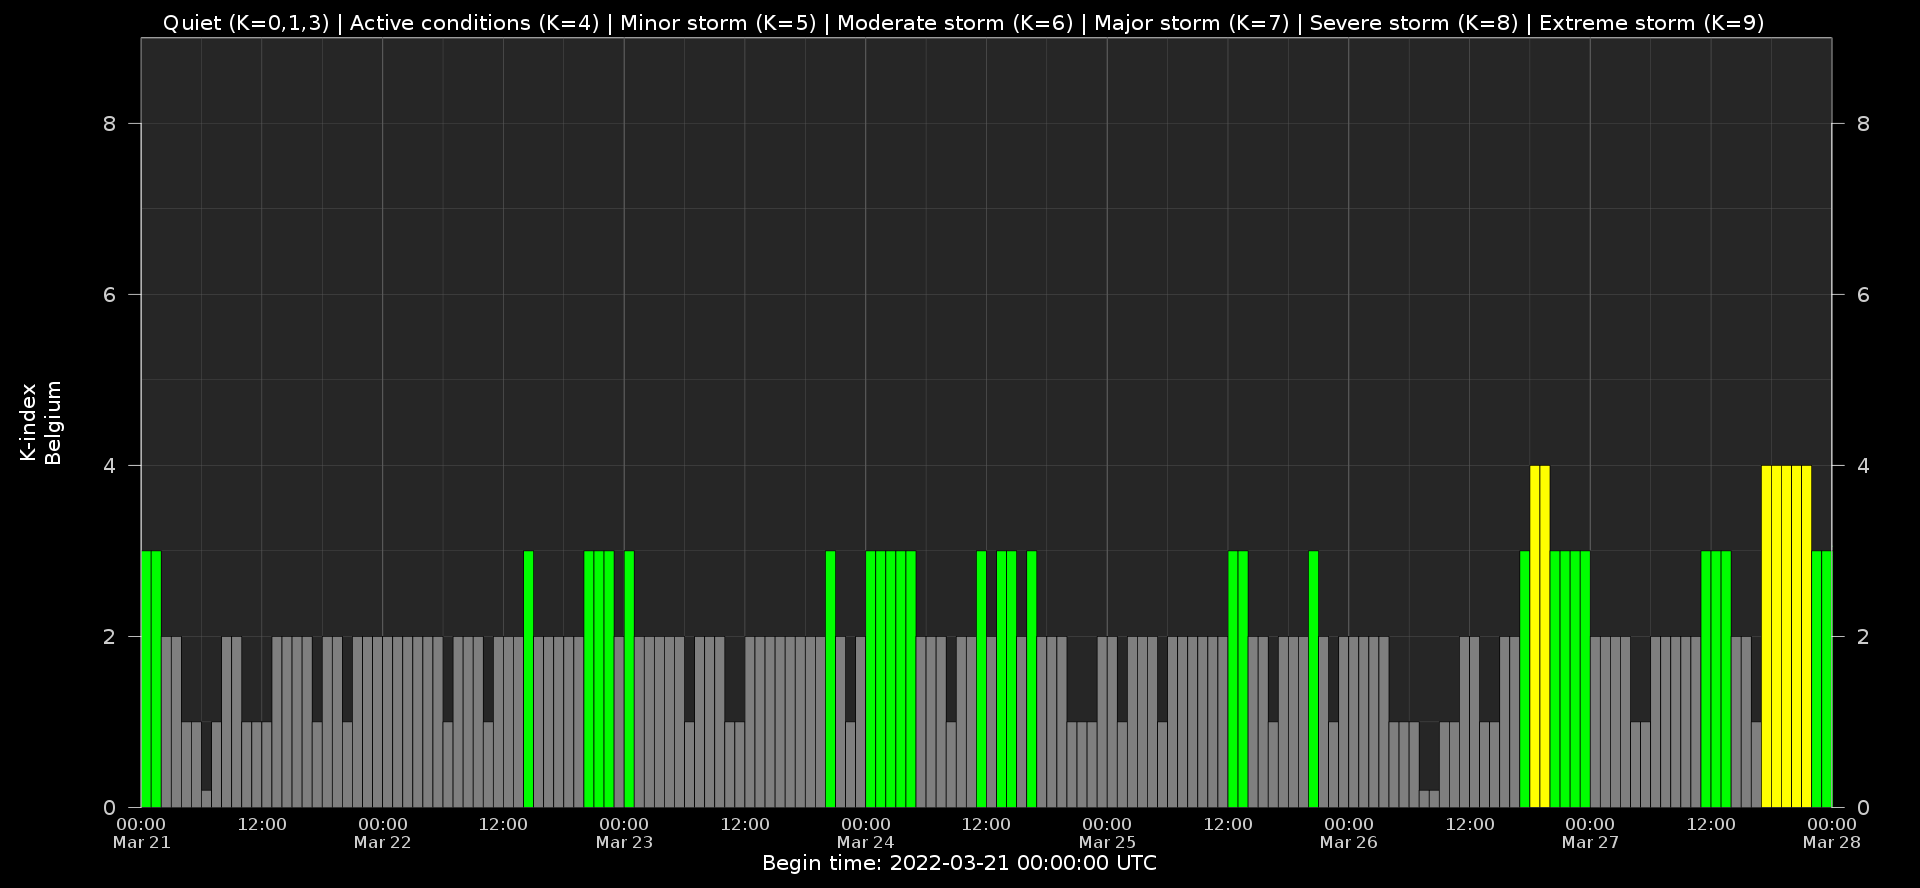
Local K-type magnetic activity index for Belgium based on data from Dourbes (DOU) and Manhay (MAB). Comparing the data from both measurement stations allows to reliably remove outliers from the magnetic data. At the same time the operational service availability is improved: whenever data from one observatory is not available, the single-station index obtained from the other can be used as a fallback system.
Both the two-station index and the single station indices are available here: http://ionosphere.meteo.be/geomagnetism/K_BEL/
The SIDC Space Weather Briefing
The Space Weather Briefing presented by the forecaster on duty from to . It reflects in images and graphs what is written in the Solar and Geomagnetic Activity report: https://www.stce.be/briefings/20220328_SWbriefing.pdf
Pdf includes links to movies.
Review of ionospheric activity (21 Mar 2022 - 27 Mar 2022)

The figure shows the time evolution of the Vertical Total Electron Content (VTEC) (in red) during the last week at three locations:
a) in the northern part of Europe(N 61deg E 5deg)
b) above Brussels(N 50.5deg, E 4.5 deg)
c) in the southern part of Europe(N 36 deg, E 5deg)
This figure also shows (in grey) the normal ionospheric behaviour expected based on the median VTEC from the 15 previous days.
The VTEC is expressed in TECu (with TECu=10^16 electrons per square meter) and is directly related to the signal propagation delay due to the ionosphere (in figure: delay on GPS L1 frequency).
The Sun's radiation ionizes the Earth's upper atmosphere, the ionosphere, located from about 60km to 1000km above the Earth's surface.The ionization process in the ionosphere produces ions and free electrons. These electrons perturb the propagation of the GNSS (Global Navigation Satellite System) signals by inducing a so-called ionospheric delay.
See http://stce.be/newsletter/GNSS_final.pdf for some more explanations ; for detailed information, see http://gnss.be/ionosphere_tutorial.php
Action!
Check out our activity calendar: activities and encounters with the Sun-Space-Earth system and Space Weather as the main theme. We provide occasions to get submerged in our world through educational, informative and instructive activities.
If you want your event in our calendar, contact us: stce_coordination at stce.be
* March 25-26, Space Days in Leuven, Belgium
* April 5-24, SUN exhibit at the AfricaMuseum, Tervuren, belgium
* April 22, Workshop PromOptica - Electromagnetic Radiation Sensors, Royal Observatory of Belgium, Brussels, Belgium
* April 26, Public Lecture on the Solar Corona in EUV (Dutch), Urania, Hove, Belgium
* April 27-29, STCE at the Symposium on Space Educational Activities, Barcelona, Spain
* April 28, Public Lecture on SolO/EUI, Astropolis, Oostende, Belgium
* July 3, Public Lecture on ROB's mission to the Sun, Cosmodrome, Genk, Belgium
* August 25, Public Lecture on Space Weather and Aviation, Astropolis, Oostende, Belgium
* October 24-28, 18th European Space Weather Week, Zagreb, Croatia
Check: https://www.stce.be/calendar