- Table of Content
- 1.Lookalikes
- 2.Review of sola...
- 3.Noticeable Sol...
- 4.PROBA2 Observa...
- 5.The Internatio...
- 6.Review of geom...
- 7.Geomagnetic Ob...
- 8.The SIDC space...
- 9.Review of iono...
- 10.Action!
2. Review of solar activity
3. Noticeable Solar Events (18 Apr 2022 - 24 Apr 2022)
4. PROBA2 Observations (18 Apr 2022 - 24 Apr 2022)
5. The International Sunspot Index by SILSO
6. Review of geomagnetic activity
7. Geomagnetic Observations in Belgium (18 Apr 2022 - 24 Apr 2022)
8. The SIDC space weather briefing
9. Review of ionospheric activity (18 Apr 2022 - 24 Apr 2022)
10. Action!
Lookalikes
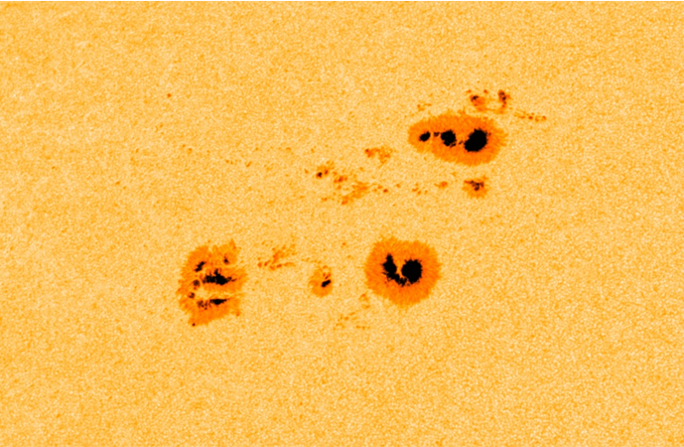
The sunspot complex consisting of NOAA 12993 and 12994 has been dominating the solar disk over the last week. The regions have been very flare productive with more than 10 M-class flares and 1 X-class event so far. With still 1 week before rounding the Sun's west limb, it's likely there are some more M-class events in the pipeline.
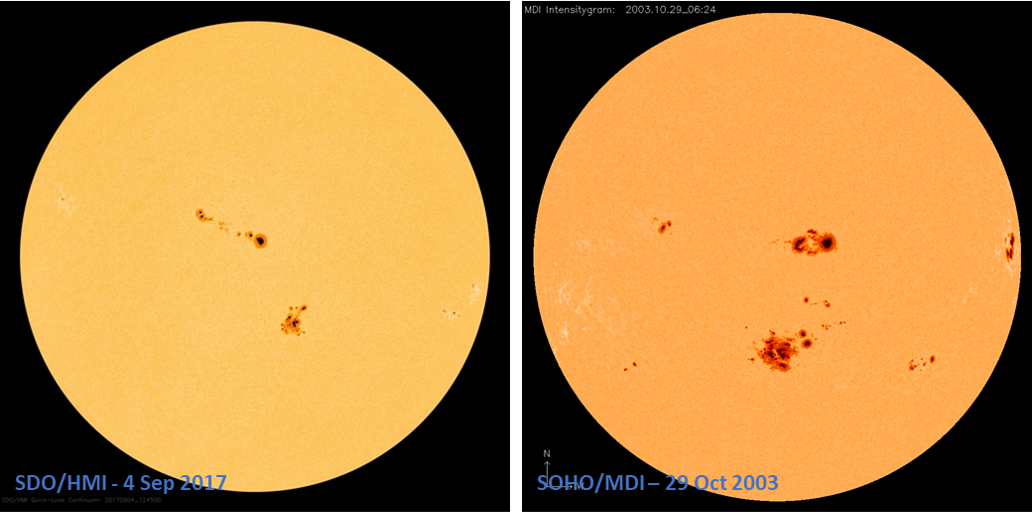
The combination of 2 rather big sunspot groups only a few degrees in latitude from each other, in the same solar hemisphere, is quite rare. During the more active phase of a solar cycle, it is fairly common to have several big sunspot groups visible at the same time, but they are usually quite separated from each other or in opposite solar hemispheres. Some extreme examples are the September 2017 and October 2003 sunspot groups.
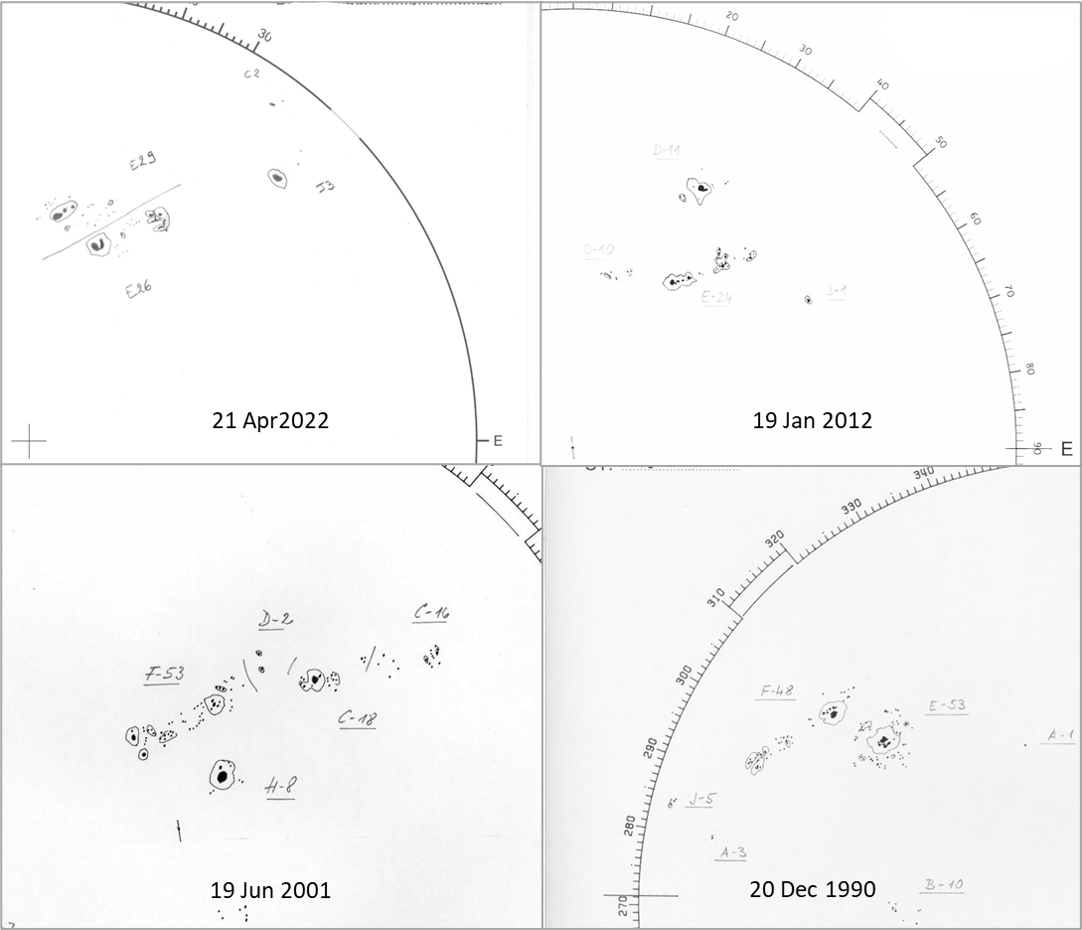
A quick check of sizeable sunspot groups over the last 3 solar cycles (SolarCycleScience - http://solarcyclescience.com/solarcycle.html ) revealed that there are not many good lookalikes for NOAA 12993/94. Underneath is a compilation of ROB/USET (http://www.sidc.be/uset/ ) and Kanzelhöhe (http://cesar.kso.ac.at/ ) drawings for sunspot groups with a similar morphology. The letters and numbers on these drawings represent the Waldmeier type and the number of sunspots for each of the sunspot regions (see the STCE's SWx classification page - https://www.stce.be/educational/classification ). There's a good ressemblance with NOAA 11401/11402 in January 2012, which were also prolific M- and X-class flare producers. For NOAA 9503/9504 in June 2001, and NOAA 6413/6415 in December 1990, the isolated spot is located to the south of the main group, but clearly still belonging to the same "family". These two pairs produced only M-class flares, and they were also the smallest of the 4 cases. Of note is that all 4 duos appeared in the northern hemisphere, but this may be due to the limited number of cases examined.
Review of solar activity
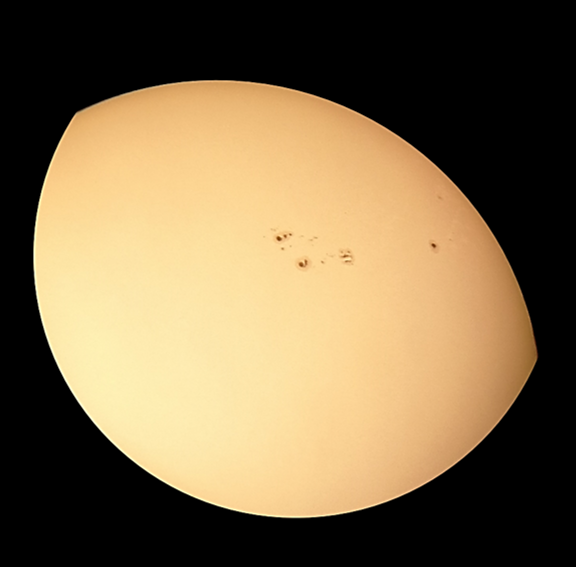
The main active regions (AR) of the week were NOAA AR 2993 and 2994 which rotated onto the disc at the end of the previous week and NOAA AR 2992 which rotated off the visible disc during the course of this week. NOAA AR 2993 and 2994 were complex regions with significant flux emergence and mixed polarity flux, mostly in the intermediate area of NOAA AR 2994 and near the leading spot of NOAA 2993. While these were the source of an X-class flare late in the previous week, they only produced a series of M-class flares throughout the rest of the week. The SDO/HMI white light image shows both regions on April 21 (NOAA AR 2993 is the upper region).
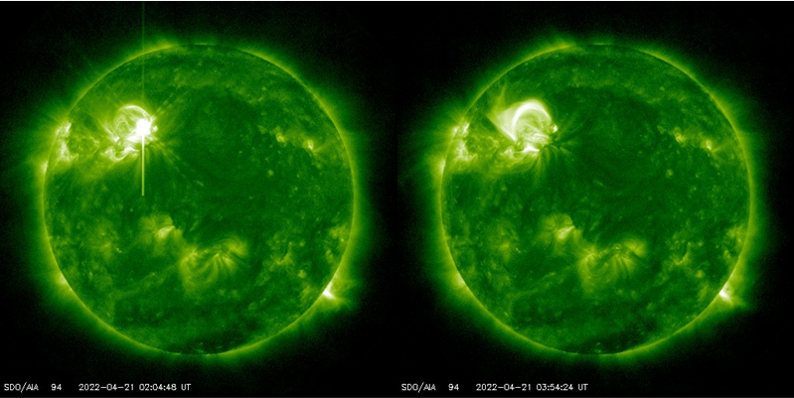
The strongest activity during the first part of the week was from NOAA AR 2992 which produced an M7.2 and an X2.2 flare early on April 20 as the region was on the western limb (see the previous STCE Newsletter and https://www.stce.be/news/584/welcome.html for a discussion). The remainder of the week was then dominated again by NOAA AR 2993 and 2994 transitioning from the northeast to the northwest quadrant, with an M9.6 flare from NOAA AR 2993 early on April 21. The SDO/AIA 094 images underneath show the M9 flare and subsequent post-flare coronal loops. The activity then overall decreased with only a few more M-class flares from NOAA AR regions 2993 and 2994. Other regions on disc were comparatively insignificant.
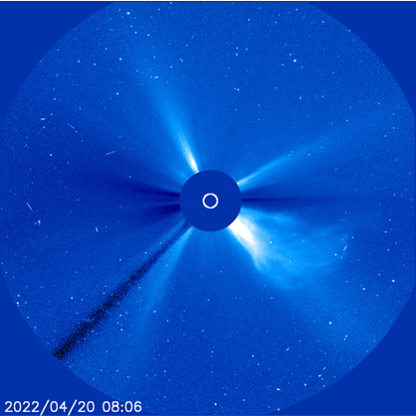
Some filament eruptions associated with the flaring activity from NOAA AR 2992 were observed but all of them were too far west of the Sun-Earth line to reach Earth. Similarly, some eruptions from near NOAA 2993 were too narrow and too far north to reach Earth. No earth-directed coronal mass ejections (CMEs) were identified in coronagraph data during the week. The coronagraph image underneath (SOHO/LASCO C3) shows the CME associated with the X2.2 flare early on April 20.
The greater than 10 MeV proton flux was at background levels throughout the week. There was a risk of a proton event as NOAA AR 2993 and 2994 were moving in the western solar hemisphere, but no such event has occurred so far. Following the high speed solar wind conditions, the greater than 2 MeV electron flux was above the 1000 pfu alert threshold at the start of the week, but has remained below this threshold since April 21. Similarly, the 24h electron fluence was at normal to moderate levels first, but since April 21 at normal levels.
Noticeable Solar Events (18 Apr 2022 - 24 Apr 2022)
| DAY | BEGIN | MAX | END | LOC | XRAY | OP | 10CM | TYPE | Cat | NOAA |
| 18 | 0737 | 0748 | 0754 | N19E67 | M1.3 | SF | 2993 | |||
| 18 | 1004 | 1027 | 1049 | M1.1 | III/1 | 2993 | ||||
| 18 | 1712 | 1724 | 1731 | S31W87 | M1.9 | SF | III/2 | 2987 | ||
| 19 | 0443 | 0450 | 0459 | M1.0 | 150 | 81 | 2993 | |||
| 19 | 2039 | 2049 | 2058 | M3.7 | III/1 | 76 | 2992 | |||
| 19 | 2109 | 2113 | 2118 | N14E47 | M1.6 | SN | 82 | 2994 | ||
| 20 | 0107 | 0114 | 0120 | N12E44 | M1.2 | 1N | 82 | 2994 | ||
| 20 | 0120 | 0136 | 0144 | M7.2 | III/1 | 2992 | ||||
| 20 | 0341 | 0357 | 0404 | X2.2 | 510 | VII/3II/3 | 2992 | |||
| 20 | 1224 | 1253 | 1302 | N21E38 | M1.9 | SF | VI/1III/2 | 81 | 2993 | |
| 21 | 0147 | 0159 | 0205 | M9.6 | 370 | II/2 | 81 | 2993 | ||
| 22 | 0452 | 0514 | 0528 | M1.1 | 81 | 2993 | ||||
| 22 | 1316 | 1325 | 1330 | N22W1 | M3.4 | 2B | II/1 | 81 | 2993 |
| LOC: approximate heliographic location | TYPE: radio burst type |
| XRAY: X-ray flare class | Cat: Catania sunspot group number |
| OP: optical flare class | NOAA: NOAA active region number |
| 10CM: peak 10 cm radio flux |
PROBA2 Observations (18 Apr 2022 - 24 Apr 2022)
Solar Activity
Solar flare activity fluctuated from low to high during the week.
In order to view the activity of this week in more detail, we suggest to go to the following website from which all the daily (normal and difference) movies can be accessed: https://proba2.oma.be/ssa
This page also lists the recorded flaring events.
A weekly overview movie (SWAP week 630) can be found here: https://proba2.sidc.be/swap/data/mpg/movies/weekly_movies/weekly_movie_2022_04_18.mp4.
Details about some of this week's events can be found further below.
If any of the linked movies are unavailable they can be found in the P2SC movie repository here: https://proba2.oma.be/swap/data/mpg/movies/.
Wednesday April 20
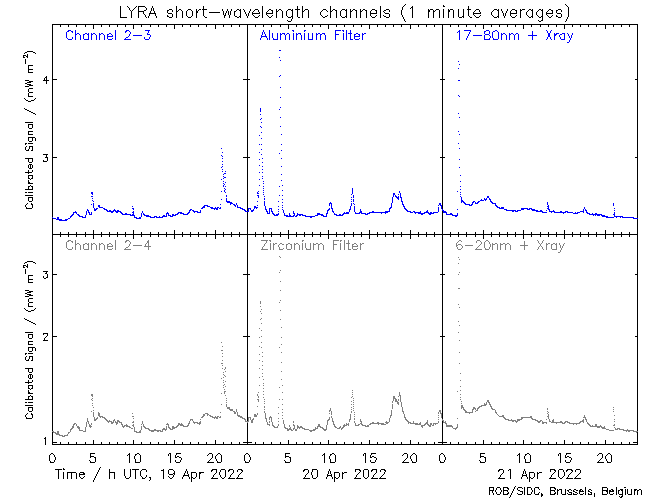
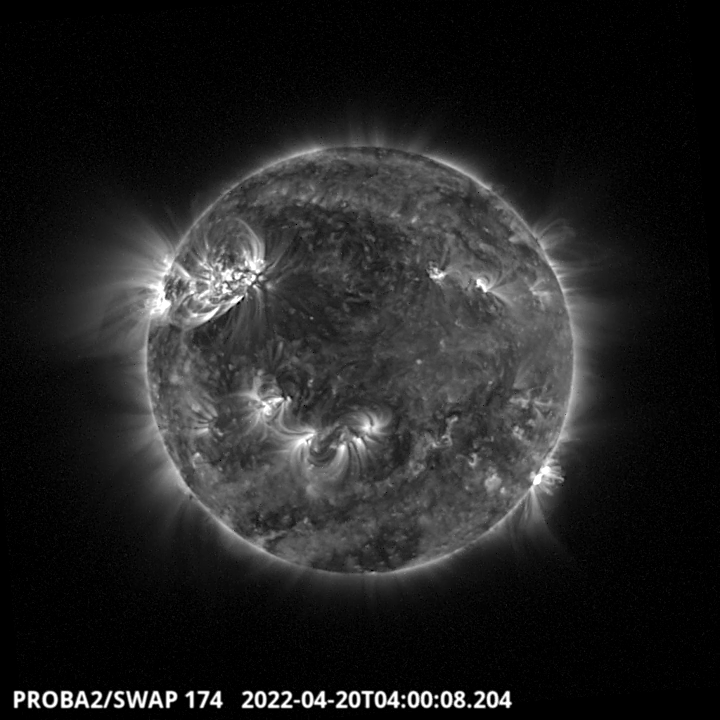
The largest flare of the week, an X2.2 flare originating from NOAA active region 2992, was observed by SWAP and LYRA. The flare is visible on the south-western limb on 2022-Apr-20, as shown in the SWAP image above taken at 04:00 UT.
Find a SWAP movie of the event here: https://proba2.sidc.be/swap/movies/20220420_swap_movie.mp4.
The International Sunspot Index by SILSO
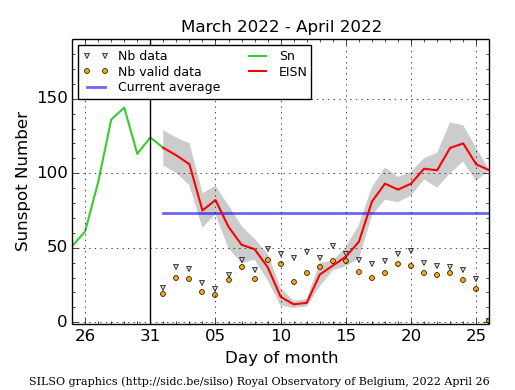
The daily Estimated International Sunspot Number (EISN, red curve with shaded error) derived by a simplified method from real-time data from the worldwide SILSO network. It extends the official Sunspot Number from the full processing of the preceding month (green line), a few days more than one solar rotation. The horizontal blue line shows the current monthly average. The yellow dots give the number of stations that provided valid data. Valid data are used to calculate the EISN. The triangle gives the number of stations providing data. When a triangle and a yellow dot coincide, it means that all the data is used to calculate the EISN of that day.
Review of geomagnetic activity
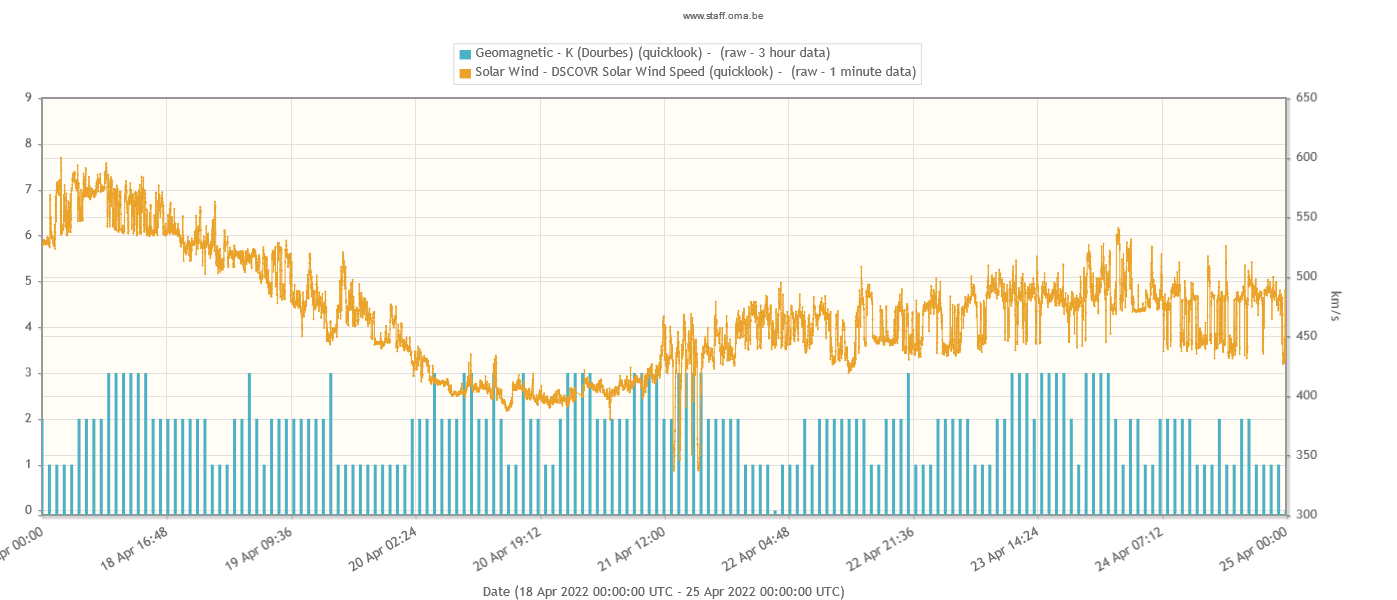
The week started with diminishing high speed solar wind conditions as the solar wind speed was coming down from its maximum close to 600 km/s. A low around 400 km/s was reached during the afternoon of April 20, after which the solar wind speed slowly increased again, reaching slightly enhanced values of around 500 km/s later in the week. The magnetic field magnitude was mostly around 5 nT but saw a surge to 11 nT around noon April 21. Throughout the entire week, the magnetic field orientation indicated connection to a positive magnetic polarity sector.
Geomagnetic conditions were mostly quiet to unsettled (both NOAA Kp and local K Belgium mostly 1-3), with just two isolated active periods (only NOAA Kp reaching 4) late in the week. The figure underneath captures the evolution of the solar wind speed and the local K Dourbes index during the reported week.
Geomagnetic Observations in Belgium (18 Apr 2022 - 24 Apr 2022)
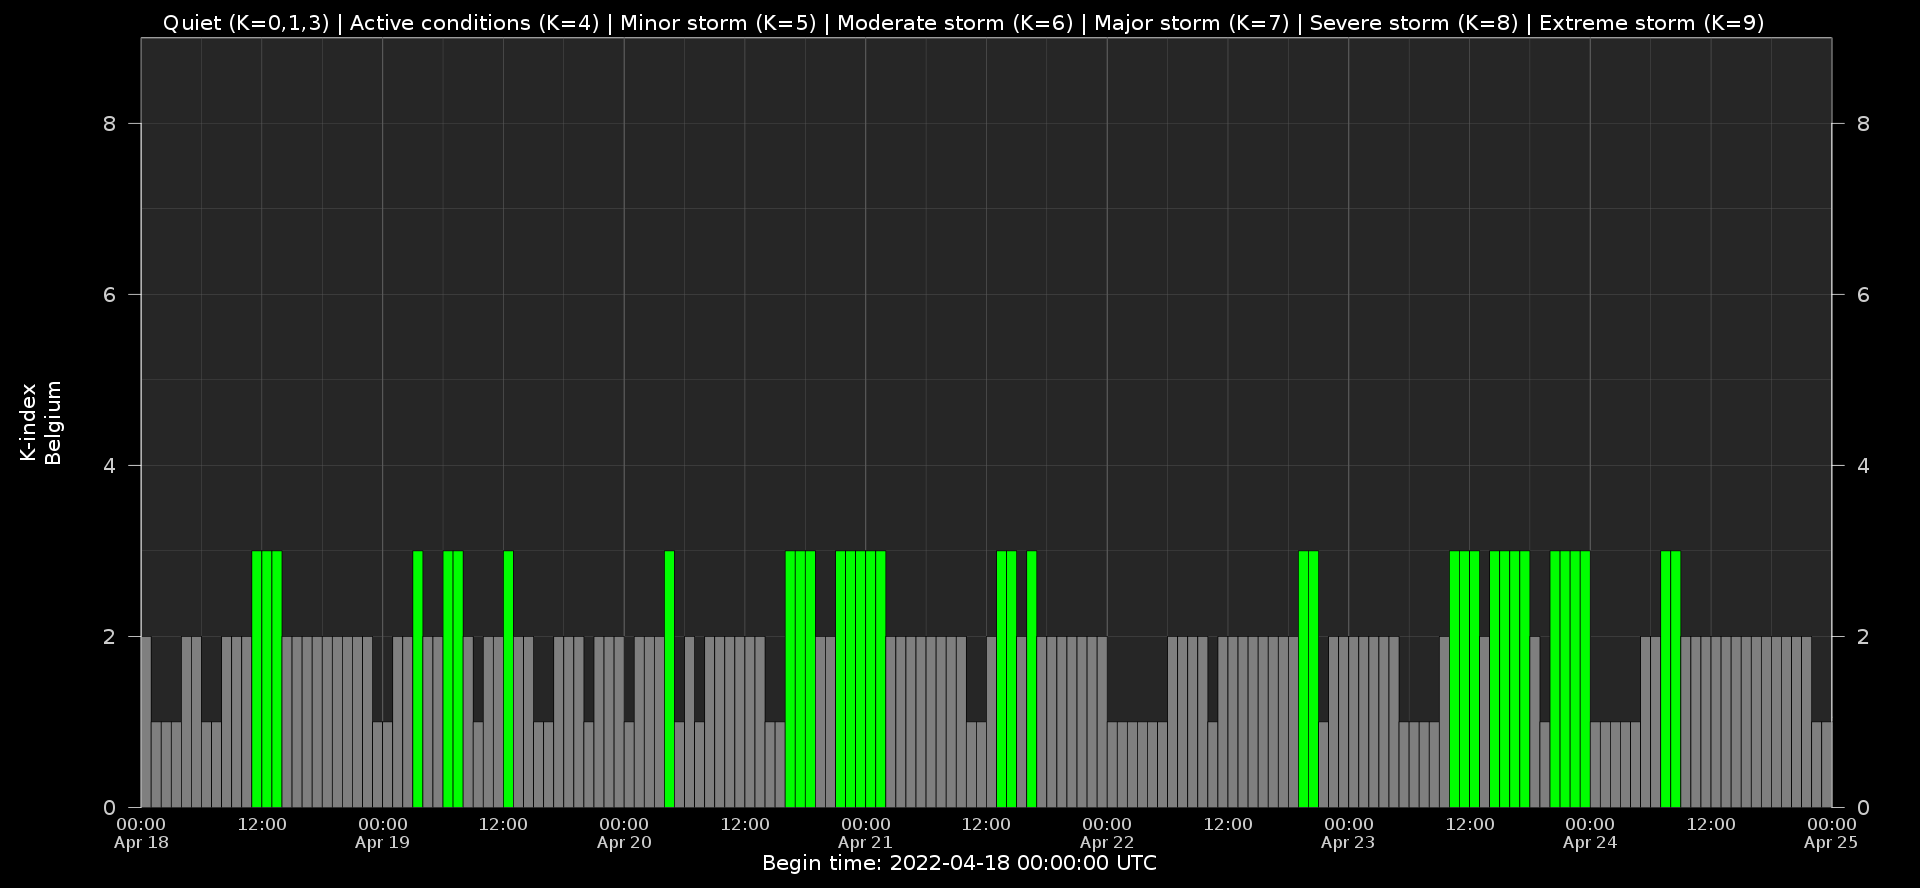
Local K-type magnetic activity index for Belgium based on data from Dourbes (DOU) and Manhay (MAB). Comparing the data from both measurement stations allows to reliably remove outliers from the magnetic data. At the same time the operational service availability is improved: whenever data from one observatory is not available, the single-station index obtained from the other can be used as a fallback system.
Both the two-station index and the single station indices are available here: http://ionosphere.meteo.be/geomagnetism/K_BEL/
The SIDC space weather briefing
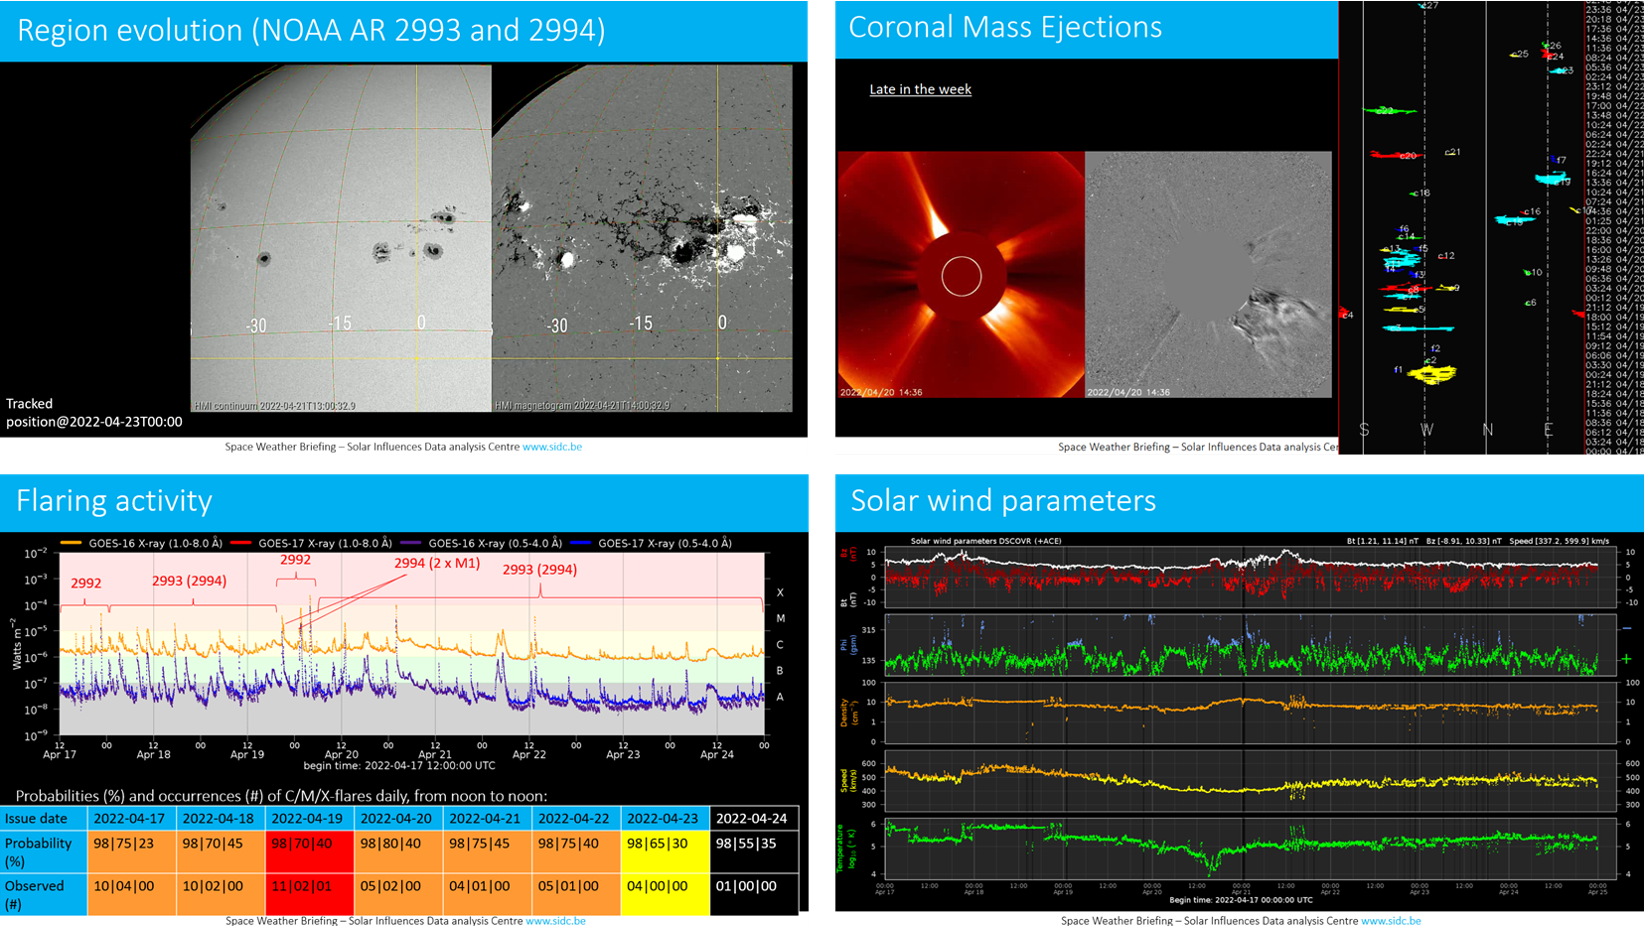
The Space Weather Briefing presented by the forecaster on duty from April 18 to April 24. It reflects in images and graphs what is written in the Solar and Geomagnetic Activity reports. The pdf and movies can be found in: https://www.stce.be/briefings/20220425/
Review of ionospheric activity (18 Apr 2022 - 24 Apr 2022)
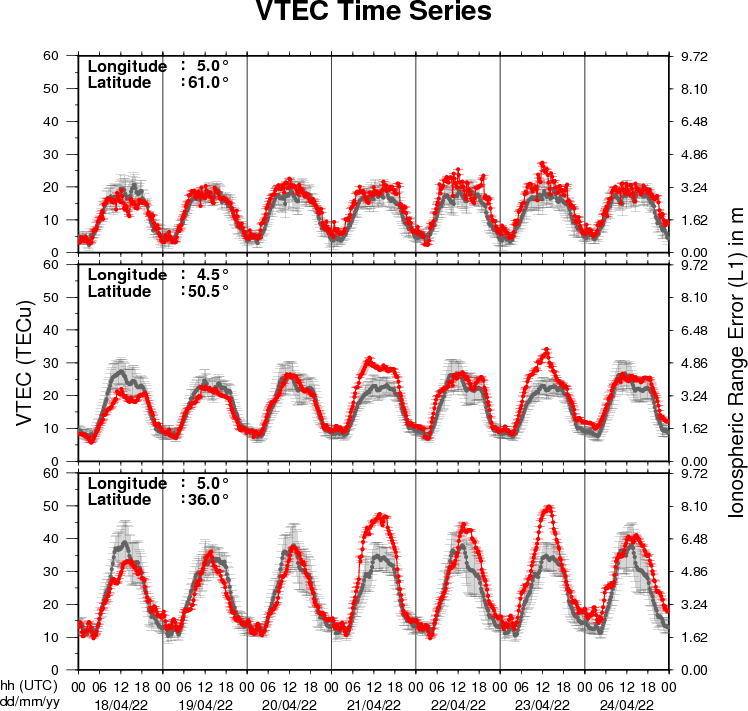
The figure shows the time evolution of the Vertical Total Electron Content (VTEC) (in red) during the last week at three locations:
a) in the northern part of Europe(N 61deg E 5deg)
b) above Brussels(N 50.5deg, E 4.5 deg)
c) in the southern part of Europe(N 36 deg, E 5deg)
This figure also shows (in grey) the normal ionospheric behaviour expected based on the median VTEC from the 15 previous days.
The VTEC is expressed in TECu (with TECu=10^16 electrons per square meter) and is directly related to the signal propagation delay due to the ionosphere (in figure: delay on GPS L1 frequency).
The Sun's radiation ionizes the Earth's upper atmosphere, the ionosphere, located from about 60km to 1000km above the Earth's surface.The ionization process in the ionosphere produces ions and free electrons. These electrons perturb the propagation of the GNSS (Global Navigation Satellite System) signals by inducing a so-called ionospheric delay.
See http://stce.be/newsletter/GNSS_final.pdf for some more explanations ; for detailed information, see http://gnss.be/ionosphere_tutorial.php
Action!
Check out our activity calendar: activities and encounters with the Sun-Space-Earth system and Space Weather as the main theme. We provide occasions to get submerged in our world through educational, informative and instructive activities.
If you want your event in our calendar, contact us: stce_coordination at stce.be
* April 27-29, STCE at the Symposium on Space Educational Activities, Barcelona, Spain
* April 28, Public Lecture on SolO/EUI, Astropolis, Oostende, Belgium
* April 28, KU Leuven CmPA Seminar: Quasimodes in the cusp continuum in nonuniform photospheric flux tubes, Leuven, Belgium and online
* April 29, KU Leuven CmPA Seminar: Intermittent energy release in the solar atmosphere, Leuven, Belgium and online
* June 13-15, Space Weather Introductory Course - onsite, by the STCE, Brussels, Belgium
* July 3, Public Lecture on STCE's mission to the Sun, Cosmodrome, Genk, Belgium
* August 25, Public Lecture on Space Weather and Aviation, Astropolis, Oostende, Belgium
* October 24-28, 18th European Space Weather Week, Zagreb, Croatia
* November 21-23, Space Weather Introductory Course - onsite, by the STCE, Brussels, Belgium
* December 5, 6, 8, 9, Space Weather Introductory Course - online, by the STCE, zoom
Check: https://www.stce.be/calendar