- Table of Content
- 1.A curious prot...
- 2.STCE@Symposium...
- 3.Review of sola...
- 4.Review of geom...
- 5.Noticeable Sol...
- 6.PROBA2 Observa...
- 7.The Internatio...
- 8.Geomagnetic Ob...
- 9.The SIDC space...
- 10.Review of iono...
- 11.Action!
2. STCE@Symposium Space Educational Activities
3. Review of solar activity
4. Review of geomagnetic activity
5. Noticeable Solar Events (25 Apr 2022 - 1 May 2022)
6. PROBA2 Observations (25 Apr 2022 - 1 May 2022)
7. The International Sunspot Index by SILSO
8. Geomagnetic Observations in Belgium (25 Apr 2022 - 1 May 2022)
9. The SIDC space weather briefing
10. Review of ionospheric activity (25 Apr 2022 - 1 May 2022)
11. Action!
A curious proton flux enhancement
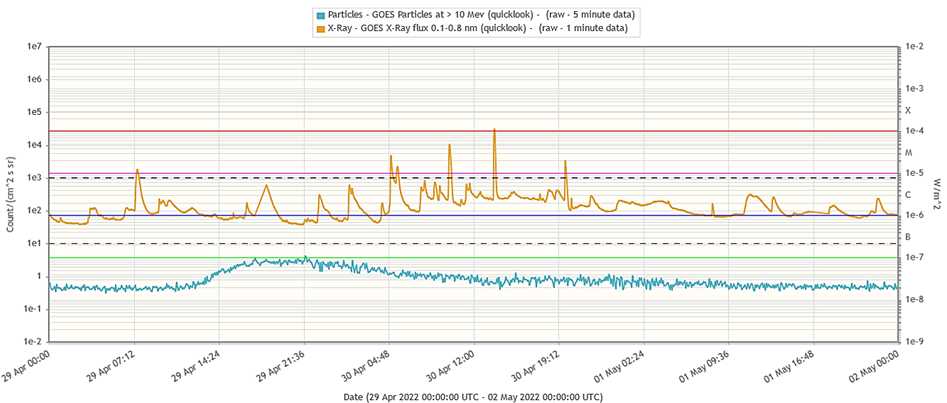
Solar flaring activity reached once again high levels last week following an X-class flare by active region NOAA 2994 on 30 April, as discussed in this STCE's newsitem (https://www.stce.be/news/586/welcome.html ). The graph underneath, created with the STAFF tool at http://www.staff.oma.be/ , shows the evolution of the x-ray flux and the greater than 10 MeV proton flux as observed by GOES . An enhancement of the proton flux can be observed but clearly starts prior to the X-class event and the series of M-class flares initiated by NOAA 2994. With only the M1.2 flare peaking at 07:30UT on 29 April, and no other important solar activity ongoing (including on the farside), it seems to be very likely that the proton flux enhancement was related to this M1.2 flare. Though the enhancement of the proton flux was fairly pronounced, its peak of 4.2 pfu remained well below the 10 pfu alert threshold (1 pfu = 1 particle per (cm2 s sr); see the STCE's SWx acronyms page at https://www.stce.be/educational/acronym#P ).
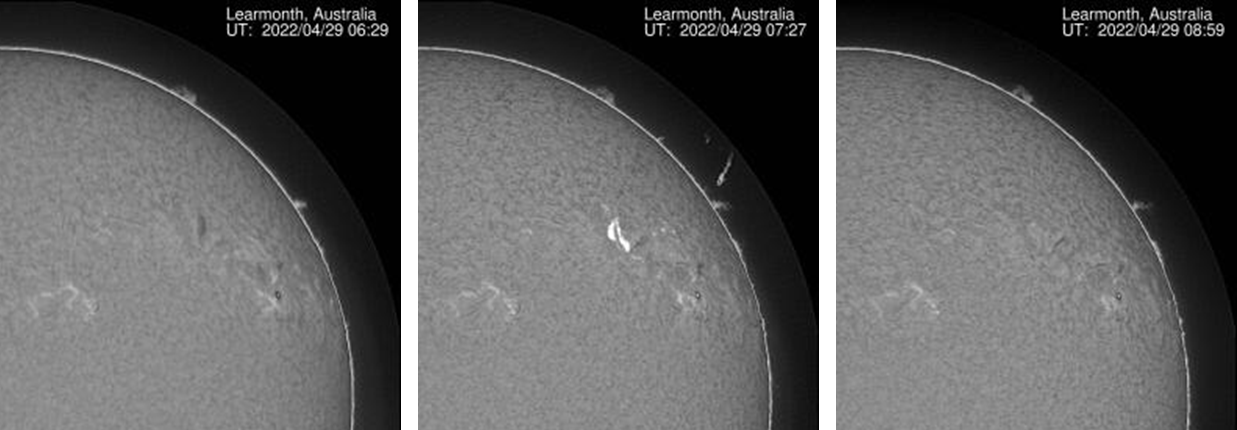
The source of the M1.2 event was the violent eruption of a small filament in the then spotless active region NOAA 2996. This can be seen in the H-alpha imagery underneath obtained by the Learmonth observatory as part of the GONG H-alpha network (https://gong2.nso.edu/products/tableView/table.php?configFile=configs/hAlpha.cfg ). Solar filaments are clouds of charged particles ("plasma") above the solar surface squeezed between magnetic regions of opposite polarity. Being cooler and denser than the plasma underneath and their surroundings, they appear as dark lines when seen on the solar disk. Special filters are required to observe these features, such as in the Hydrogen-alpha (H-alpha) line in the red part of the solar spectrum at a wavelength of 656.3 nm. The 3 H-alpha images show the outlook of the northwest solar quadrant before, during and after the eruption, when the filament has completely gone.
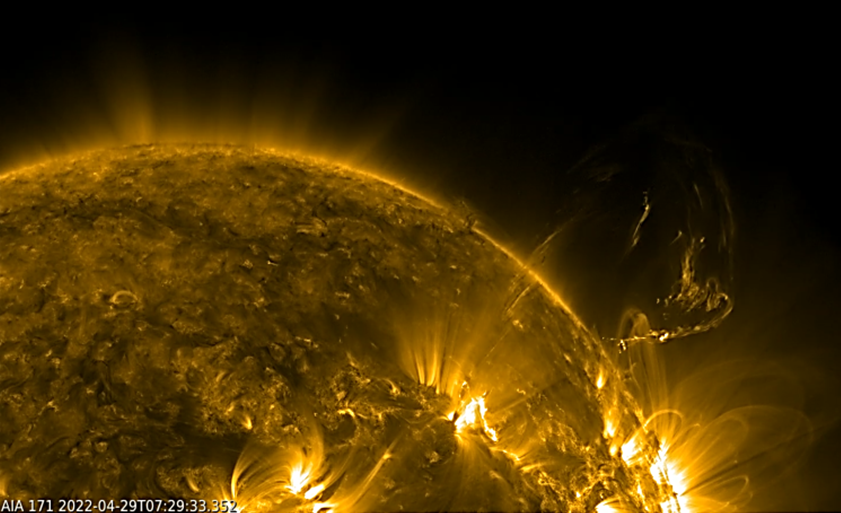
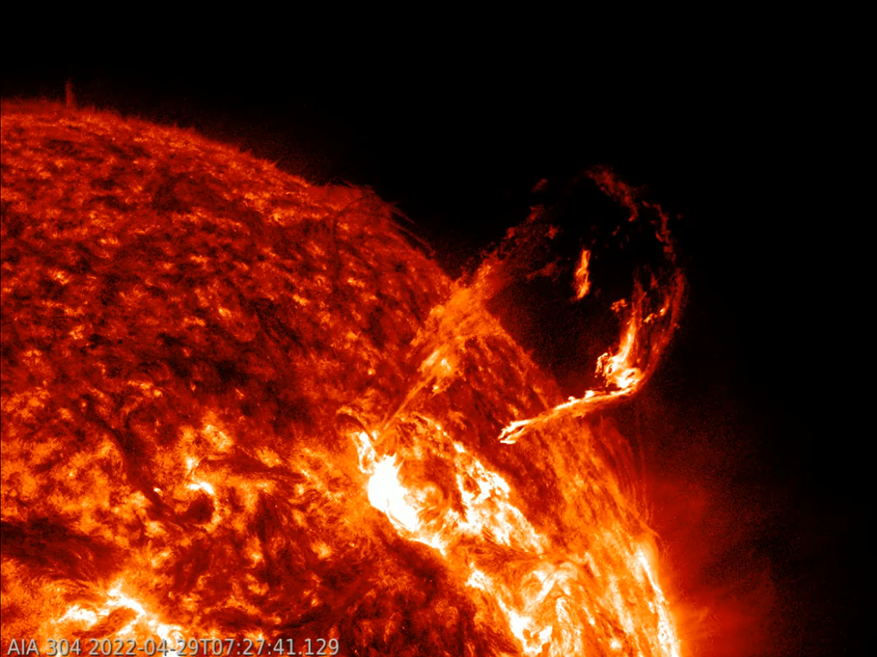
Extreme ultraviolet images such as from SDO/AIA (http://sdo.gsfc.nasa.gov/data/aiahmi/ ) showed quite some detail in the eruption. Images were taken around the time of the flare peak, with clips and difference imagery available in the online version of this newsitem at https://www.stce.be/news/587/welcome.html . Aside the ejected material, the AIA 171 images (top - temperatures around 700.000 degrees) also show the post-flare coronal loops, whereas AIA 304 imagery (temperatures around 80.000 degrees) gives a better view on some of the material raining back to the Sun along the magnetic field lines.
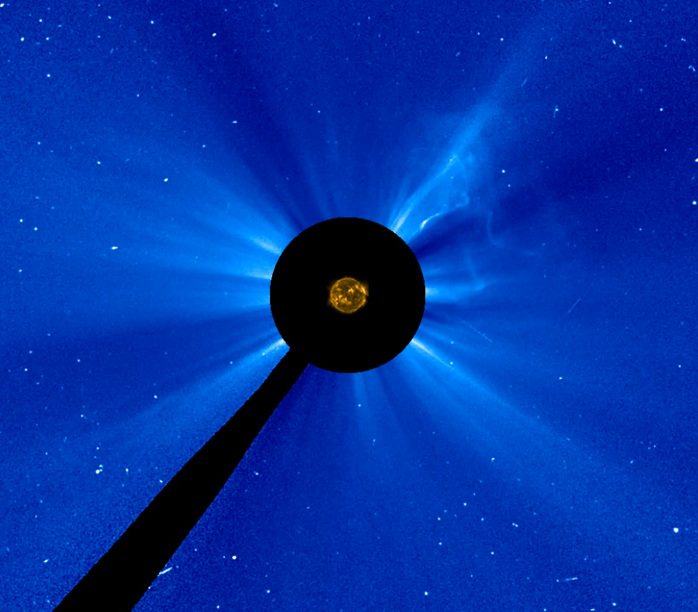
The associated coronal mass ejection (CME) was quite fast with an estimated speed in excess of 1000 km/s. However, the CME did not seem to have an earth-directed component. The image underneath was taken around 09:00UT and combines a coronagraph image from SOHO/LASCO C3 (https://soho.nascom.nasa.gov/ ) with an EUV image of the Sun by SDO/AIA 171. The CME can be seen moving to the right and upper-right.
STCE@Symposium Space Educational Activities
We were at the 4th Symposium Space Educational Activities in Barcelona, Spain. It is a conference for and by students: https://sseasymposium.org
Preparar el camino para nuevas colaboraciones
The STCE sponsored and got the opportunity to present its Space Weather Education Centre. It proved to be valuable as there is a huge need for space weather education and training activities.
It was very enthusing to speak live to people and this old fashioned way to settle new collaborations proved to be very effective.

Review of solar activity
Solar storms: flares
The Sun was active. Catania sunspot group 81 (NOAA active region 2993) produced M-class flares in the beginning of the week. On April 29, Catania sunspot group 85 (NOAA active region 2996) produced an M1.2 flare which was associated with a Type III solar radio burst and a slight proton flux increase in the Earth environment. Catania sunspot group 82 (NOAA active region 2994) produced extra M class flares and an X1.1 flare on April 30 at 13:47 UTC. This extreme flare was associated with a Type II Radio Burst Emission and a coronal mass ejection.
Solar storms: Coronal Mass Ejections
Several Coronal Mass Ejections (CME) were observed in the coronagraph imagery over the last week. However, due to the location of the source region, none of the CMEs were expected to be geoeffective.
Particle flux near Earth
The greater than 10 MeV protons flux slightly increased following the M1.2-class flare from Catania sunspot group 85 (NOAA active region 2996) on April 29.
Accordingly, the greater than 2 MeV electrons flux shortly went above the 1000 pfu alert threshold. The greater than 2 MeV electron fluence also show a slight increase.
Review of geomagnetic activity
The solar wind parameters in the Earth environment (as recorded by ACE and DSCOVR) were slightly elevated over the past week.
On April 27, the interplanetary magnetic field magnitude showed an increase up to 10 nT due to the passage of a solar wind transient structure. The solar source of this structure could not be clearly identified.
Following this passage, the solar wind parameters were elevated due to the fast solar wind speed stream associated with the equatorial coronal hole (negative polarity) that reached the central meridian on April 26. The solar wind reached speeds slightly above 500 km/s from April 28 onwards. The interplanetary magnetic field magnitude increased and reached value around 11.41 nT midnight April 29/30. The Bz component of the interplanetary magnetic field was predominantly negative and reached -9.6 nT.
The geomagnetic conditions alternated between active (Kp=4) and minor storm (Kp=5) from April 27, noon. This was due to the passage of the solar wind transient event and the influence of the coronal hole.
Noticeable Solar Events (25 Apr 2022 - 1 May 2022)
| DAY | BEGIN | MAX | END | LOC | XRAY | OP | 10CM | TYPE | Cat | NOAA |
| 25 | 0118 | 0201 | 0239 | N17E4 | M1.2 | SF | III/1 | 84 | 2995 | |
| 25 | 0352 | 0402 | 0407 | N24W35 | M1.1 | SF | 42 | 81 | 2993 | |
| 29 | 0715 | 0730 | 0742 | N25W37 | M1.2 | 1F | 230 | VI/3III/1 | 2996 | |
| 29 | 1801 | 1810 | 1822 | N15E85 | M1.2 | SF | III/1 | 82 | 2994 | |
| 30 | 0446 | 0501 | 0507 | M2.6 | III/2 | 82 | 2994 | |||
| 30 | 0525 | 0534 | 0540 | M1.4 | 65 | III/2 | 82 | 2994 | ||
| 30 | 0948 | 0958 | 1005 | M4.8 | III/2II/1 | 82 | 2994 | |||
| 30 | 1337 | 1347 | 1352 | X1.1 | III/3V/3II/2 | 82 | 2994 | |||
| 30 | 1942 | 1947 | 1954 | M1.9 | V/3II/2 | 82 | 2994 |
| LOC: approximate heliographic location | TYPE: radio burst type |
| XRAY: X-ray flare class | Cat: Catania sunspot group number |
| OP: optical flare class | NOAA: NOAA active region number |
| 10CM: peak 10 cm radio flux |
PROBA2 Observations (25 Apr 2022 - 1 May 2022)
Solar Activity
Solar flare activity fluctuated from low to high during the week.
In order to view the activity of this week in more detail, we suggest to go to the following website from which all the daily (normal and difference) movies can be accessed: https://proba2.oma.be/ssa
This page also lists the recorded flaring events.
A weekly overview movie (SWAP week 631) can be found here: https://proba2.sidc.be/swap/data/mpg/movies/weekly_movies/weekly_movie_2022_04_25.mp4
Details about some of this week's events can be found further below.
If any of the linked movies are unavailable they can be found in the P2SC movie repository here: https://proba2.oma.be/swap/data/mpg/movies/.
Saturday April 30
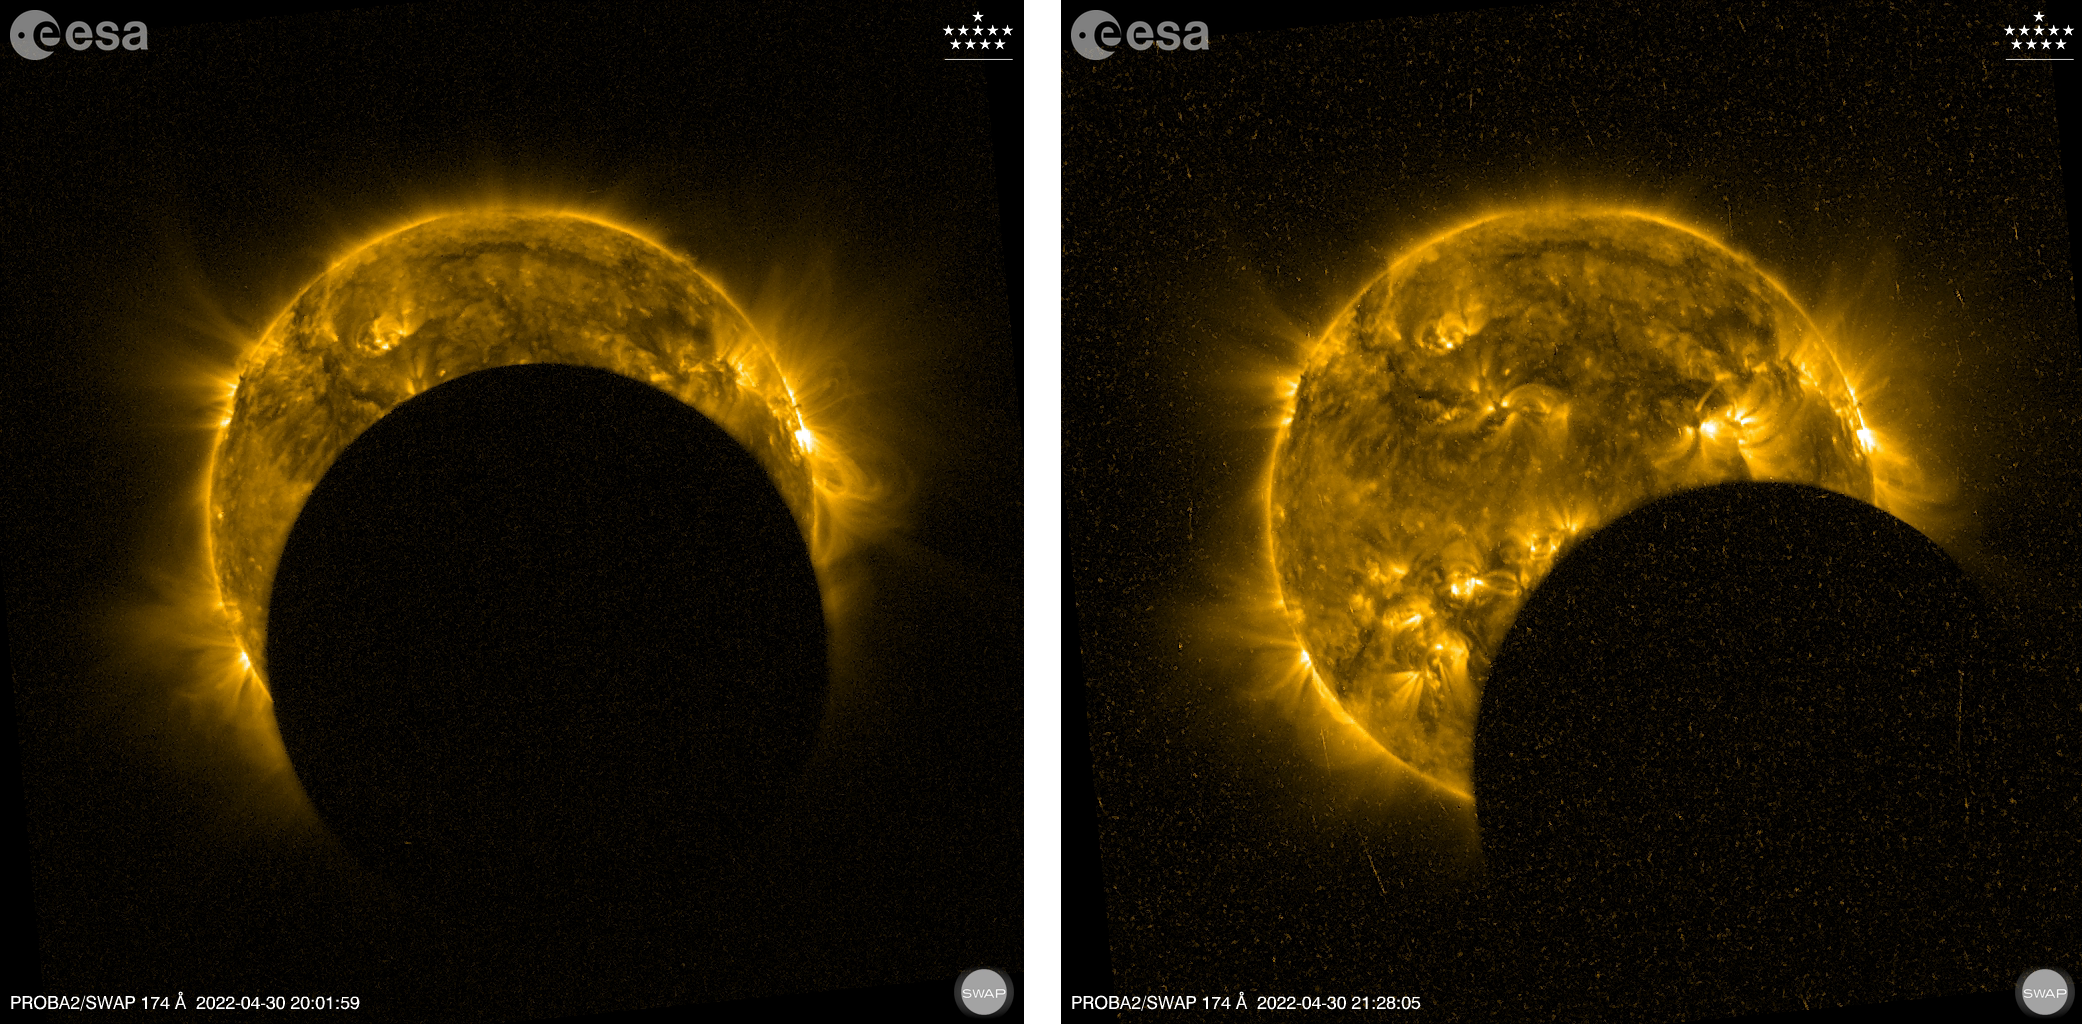
On 2022-Apr-30 a partial eclipse as seen from Earth was observed by SWAP and LYRA as three partial solar eclipses, with an additional pass of the Moon just in front of the solar corona (but not occulting the disk). The SWAP images above were taken during the second (left panel) and third (right panel) partial occultation. The third one occurred during an SEP event.
Find a movie of the event here: https://proba2.sidc.be/Events/2022-Apr-30-SolarEclipse/movies/swap_eclipse_2022_04_30_logos_lossless.mp4. Further images are also available here: https://proba2.sidc.be/Events/2022-Apr-30-SolarEclipse/.
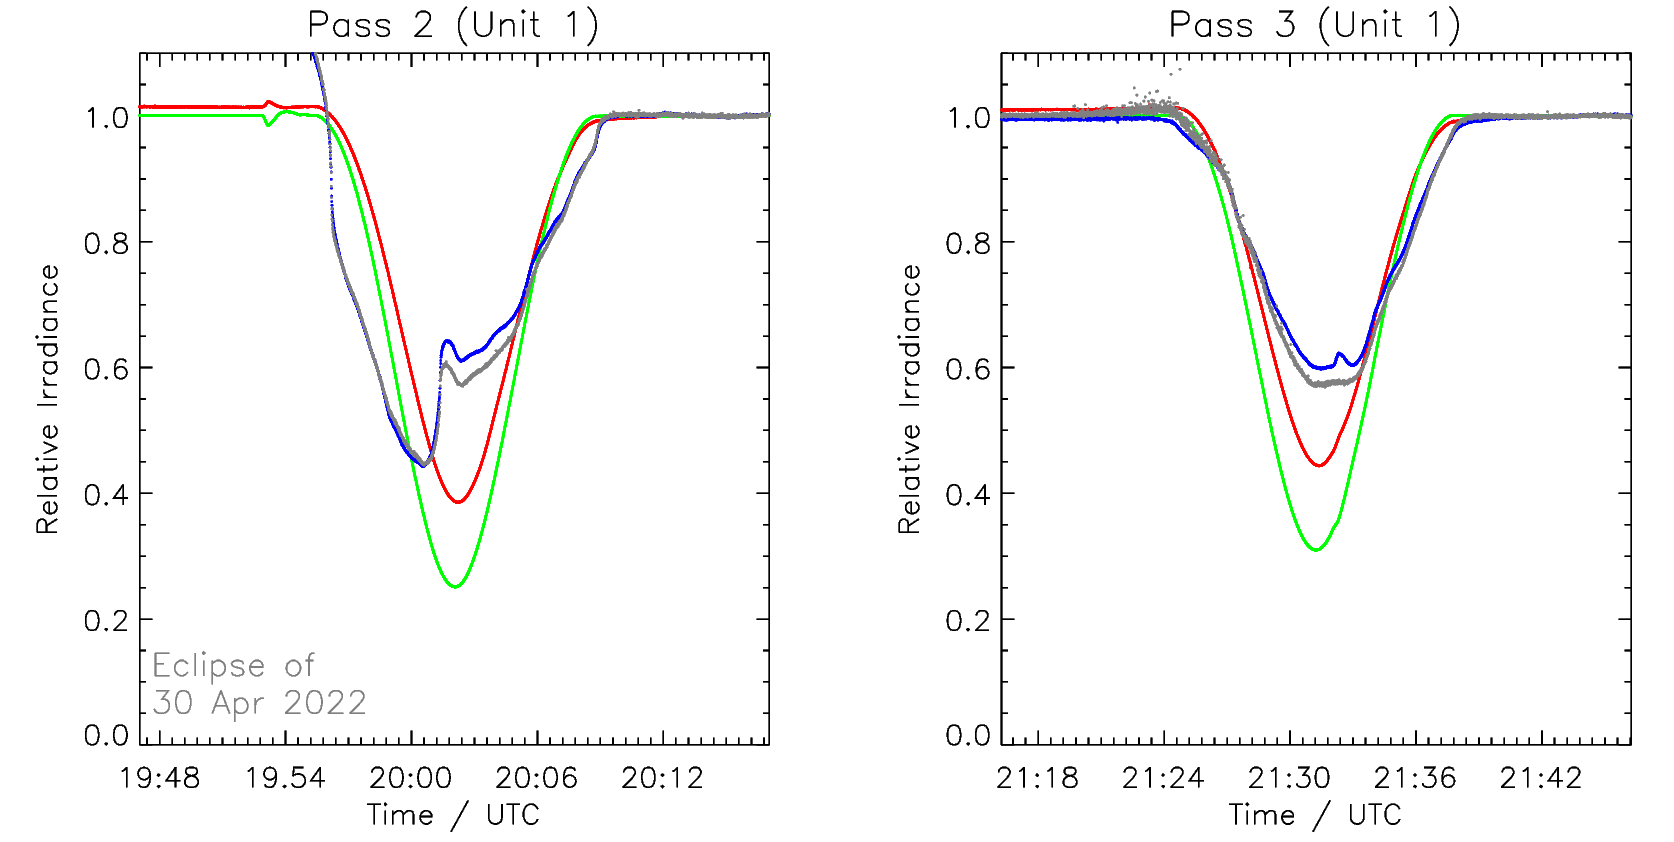
The occultations were also observed by LYRA's "calibration unit" (unit 1) in addition to the nominal one (unit 2). The plots above show normalized observations by LYRA during two passes in the eclipse zone. The colors correspond to the observations by the four channels of LYRA: red = Lyman-alpha, green = Herzberg, blue = Aluminum, black = Zirconium.
Saturday April 30
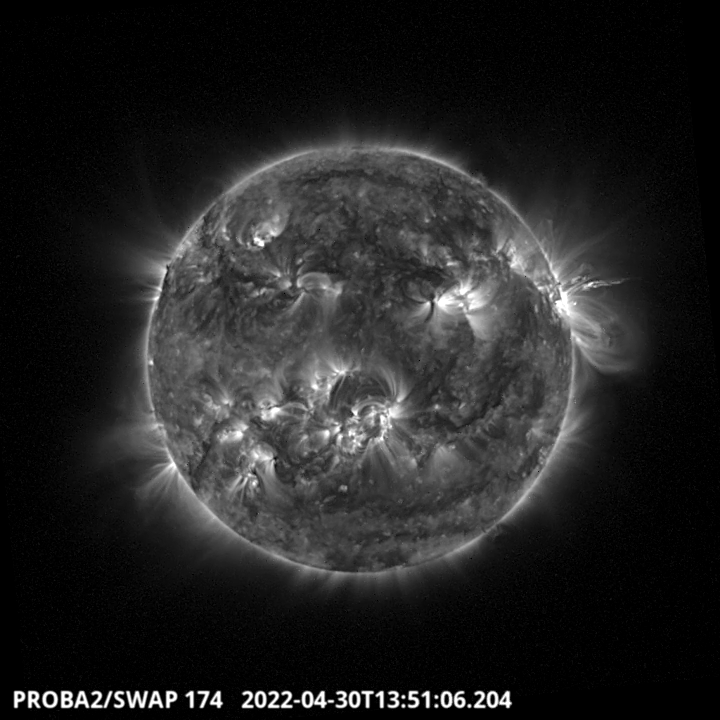
The largest flare of the week, an X1.1 flare originating from NOAA active region 2994, was observed by SWAP and LYRA. The prominence material is visible on the western limb on 2022-Apr-30, as shown in the SWAP image above taken at 13:51 UT.
Find a SWAP movie of the event here: https://proba2.sidc.be/swap/movies/20220430_swap_movie.mp4.
The International Sunspot Index by SILSO
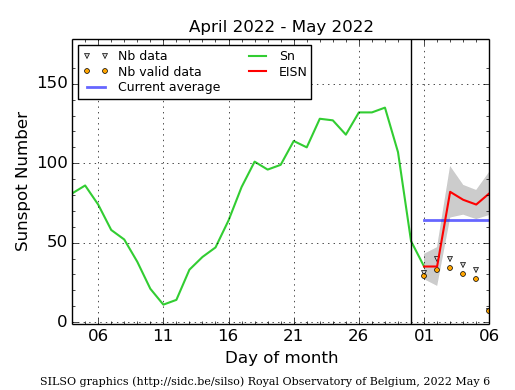
The daily Estimated International Sunspot Number (EISN, red curve with shaded error) derived by a simplified method from real-time data from the worldwide SILSO network. It extends the official Sunspot Number from the full processing of the preceding month (green line), a few days more than one solar rotation. The horizontal blue line shows the current monthly average. The yellow dots gives the number of stations that provided valid data. Valid data are used to calculate the EISN. The triangle gives the number of stations providing data. When a triangle and a yellow dot coincide, it means that all the data is used to calculate the EISN of that day.
Geomagnetic Observations in Belgium (25 Apr 2022 - 1 May 2022)
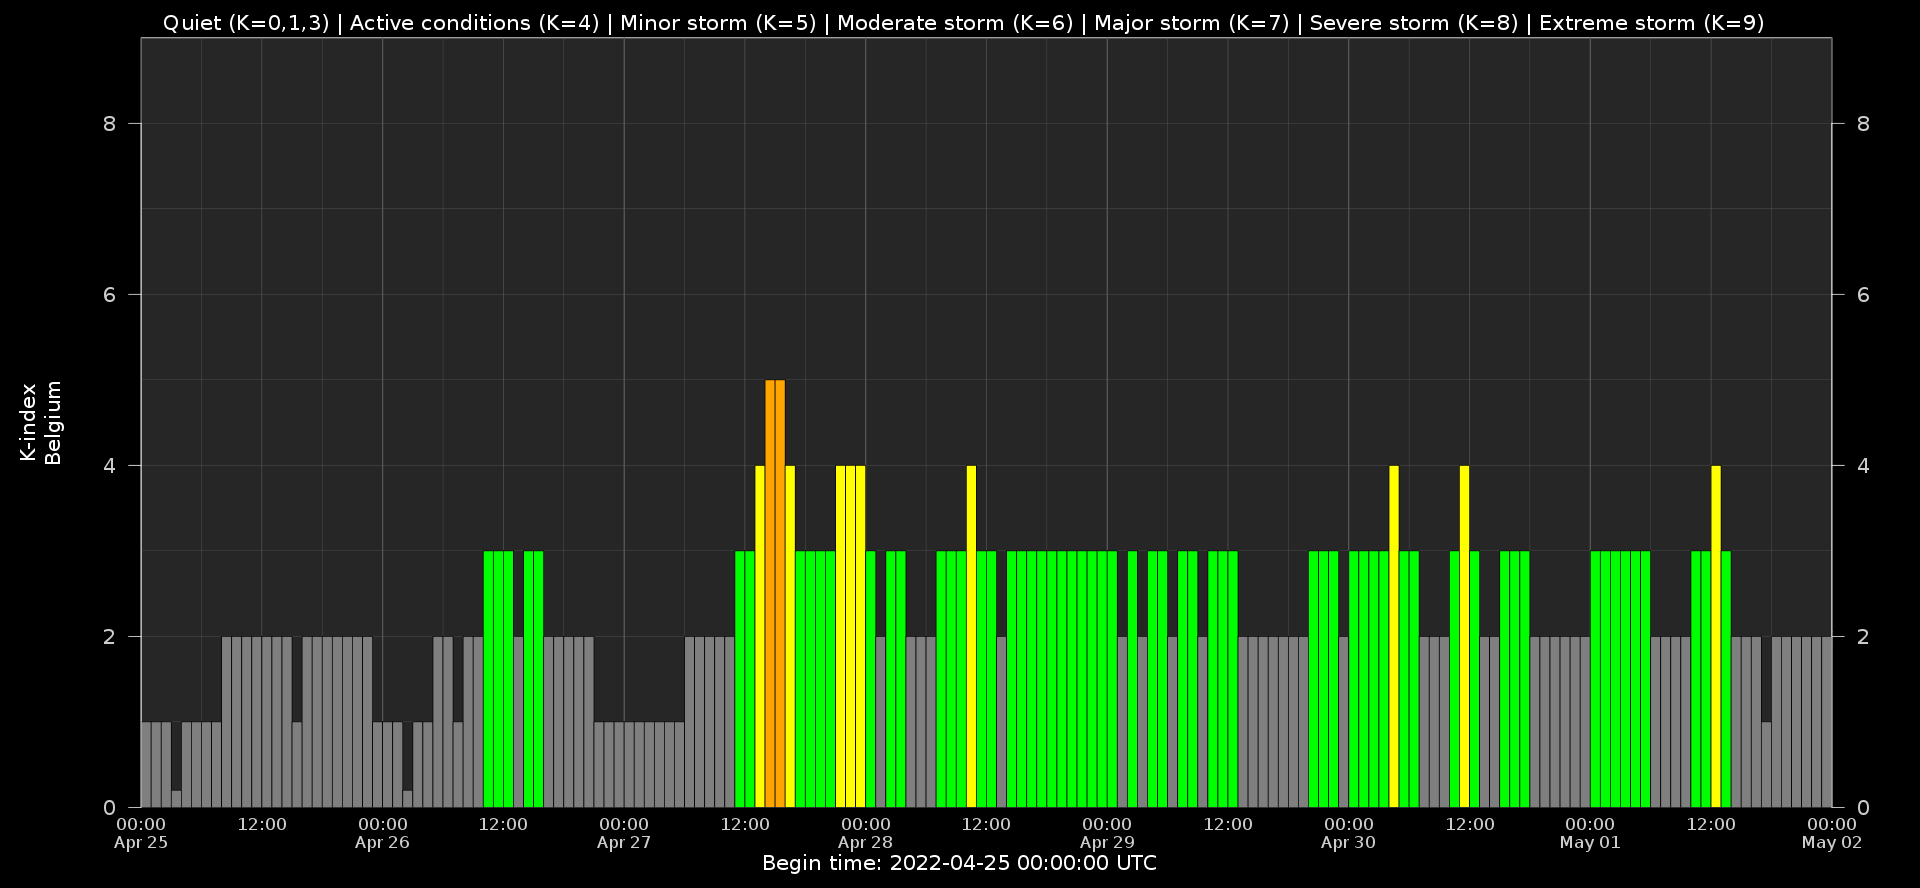
Local K-type magnetic activity index for Belgium based on data from Dourbes (DOU) and Manhay (MAB). Comparing the data from both measurement stations allows to reliably remove outliers from the magnetic data. At the same time the operational service availability is improved: whenever data from one observatory is not available, the single-station index obtained from the other can be used as a fallback system.
Both the two-station index and the single station indices are available here: http://ionosphere.meteo.be/geomagnetism/K_BEL/
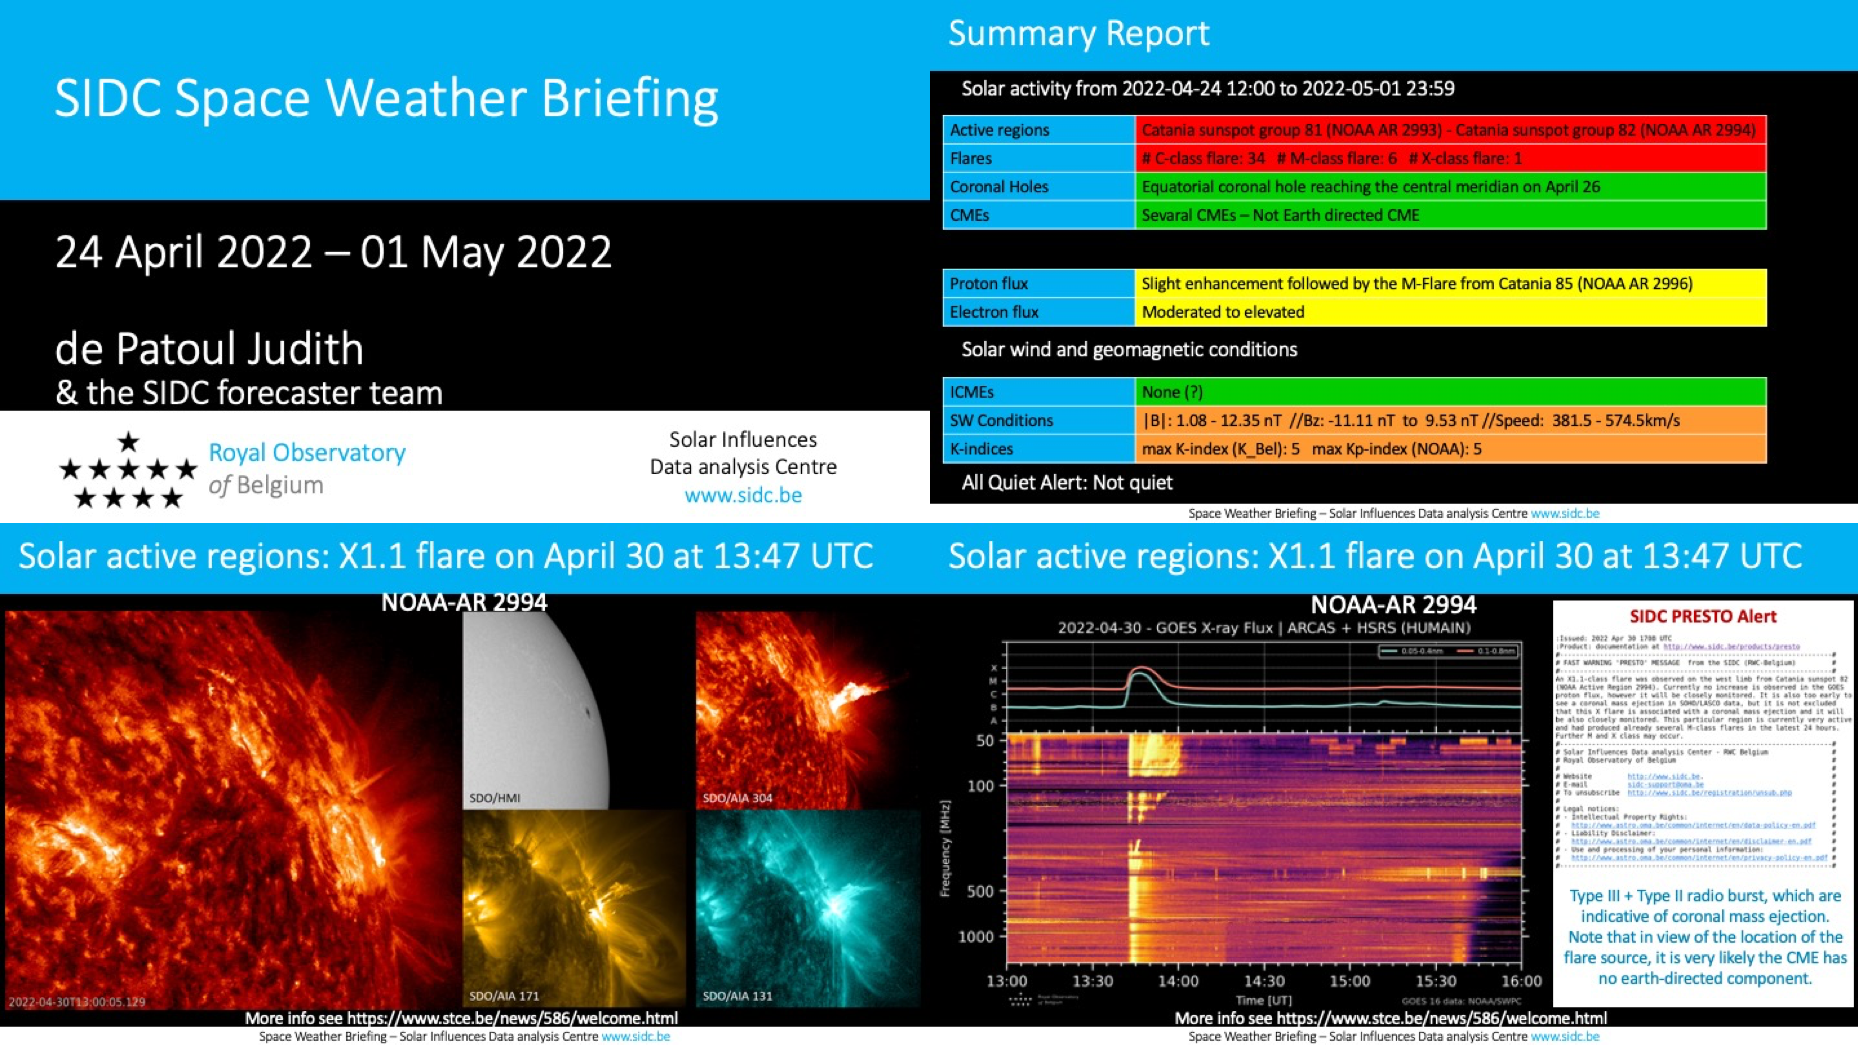
The SIDC space weather briefing
The Space Weather Briefing presented by the forecaster on duty from April 24 to May 1. It reflects in images and graphs what is written in the Solar and Geomagnetic Activity report: https://www.stce.be/briefings/20220502_SWbriefing.pdf
Review of ionospheric activity (25 Apr 2022 - 1 May 2022)
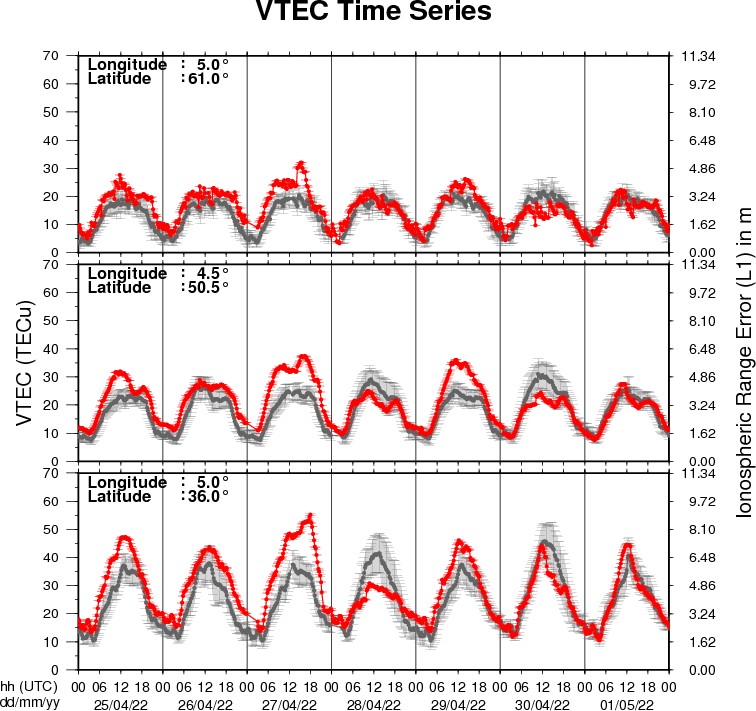
The figure shows the time evolution of the Vertical Total Electron Content (VTEC) (in red) during the last week at three locations:
a) in the northern part of Europe(N 61deg E 5deg)
b) above Brussels(N 50.5deg, E 4.5 deg)
c) in the southern part of Europe(N 36 deg, E 5deg)
This figure also shows (in grey) the normal ionospheric behaviour expected based on the median VTEC from the 15 previous days.
The VTEC is expressed in TECu (with TECu=10^16 electrons per square meter) and is directly related to the signal propagation delay due to the ionosphere (in figure: delay on GPS L1 frequency).
The Sun's radiation ionizes the Earth's upper atmosphere, the ionosphere, located from about 60km to 1000km above the Earth's surface.The ionization process in the ionosphere produces ions and free electrons. These electrons perturb the propagation of the GNSS (Global Navigation Satellite System) signals by inducing a so-called ionospheric delay.
See http://stce.be/newsletter/GNSS_final.pdf for some more explanations ; for detailed information, see http://gnss.be/ionosphere_tutorial.php
Action!
Check out our activity calendar: activities and encounters with the Sun-Space-Earth system and Space Weather as the main theme. We provide occasions to get submerged in our world through educational, informative and instructive activities.
If you want your event in our calendar, contact us: stce_coordination at stce.be
* May 12, KU Leuven/ CmPA Seminar: Dynamical evolution and oscillation of highly magnetised compact objects
* May 17, ROB Seminar: Teaching and learning astronomy and astrophysics in a planetarium – Open Call for collaboration with scientists of the Space Pole
* May 19, KU Leuven/ CmPA Seminar: Of coronas and coconuts - The COCONUT solver for global coronal modelling
* June 13-15, Space Weather Introductory Course - onsite, by the STCE, Brussels, Belgium
* June 25, STCE at the Summer Space Festival
* July 3, Public Lecture on STCE's mission to the Sun, Cosmodrome, Genk, Belgium
* August 25, Public Lecture on Space Weather and Aviation, Astropolis, Oostende, Belgium
* October 24-28, 18th European Space Weather Week, Zagreb, Croatia
* November 21-23, Space Weather Introductory Course - onsite, by the STCE, Brussels, Belgium
* December 5, 6, 8, 9, Space Weather Introductory Course - online, by the STCE, zoom
Check: https://www.stce.be/calendar