- Table of Content
- 1.Déjà-vu all ov...
- 2.Review of sola...
- 3.Review of geom...
- 4.Noticeable Sol...
- 5.PROBA2 Observa...
- 6.The Internatio...
- 7.Geomagnetic Ob...
- 8.The SIDC space...
- 9.Action!
2. Review of solar activity
3. Review of geomagnetic activity
4. Noticeable Solar Events (16 May 2022 - 22 May 2022)
5. PROBA2 Observations
6. The International Sunspot Index by SILSO
7. Geomagnetic Observations in Belgium
8. The SIDC space weather briefing
9. Action!
Déjà-vu all over? Not quite.
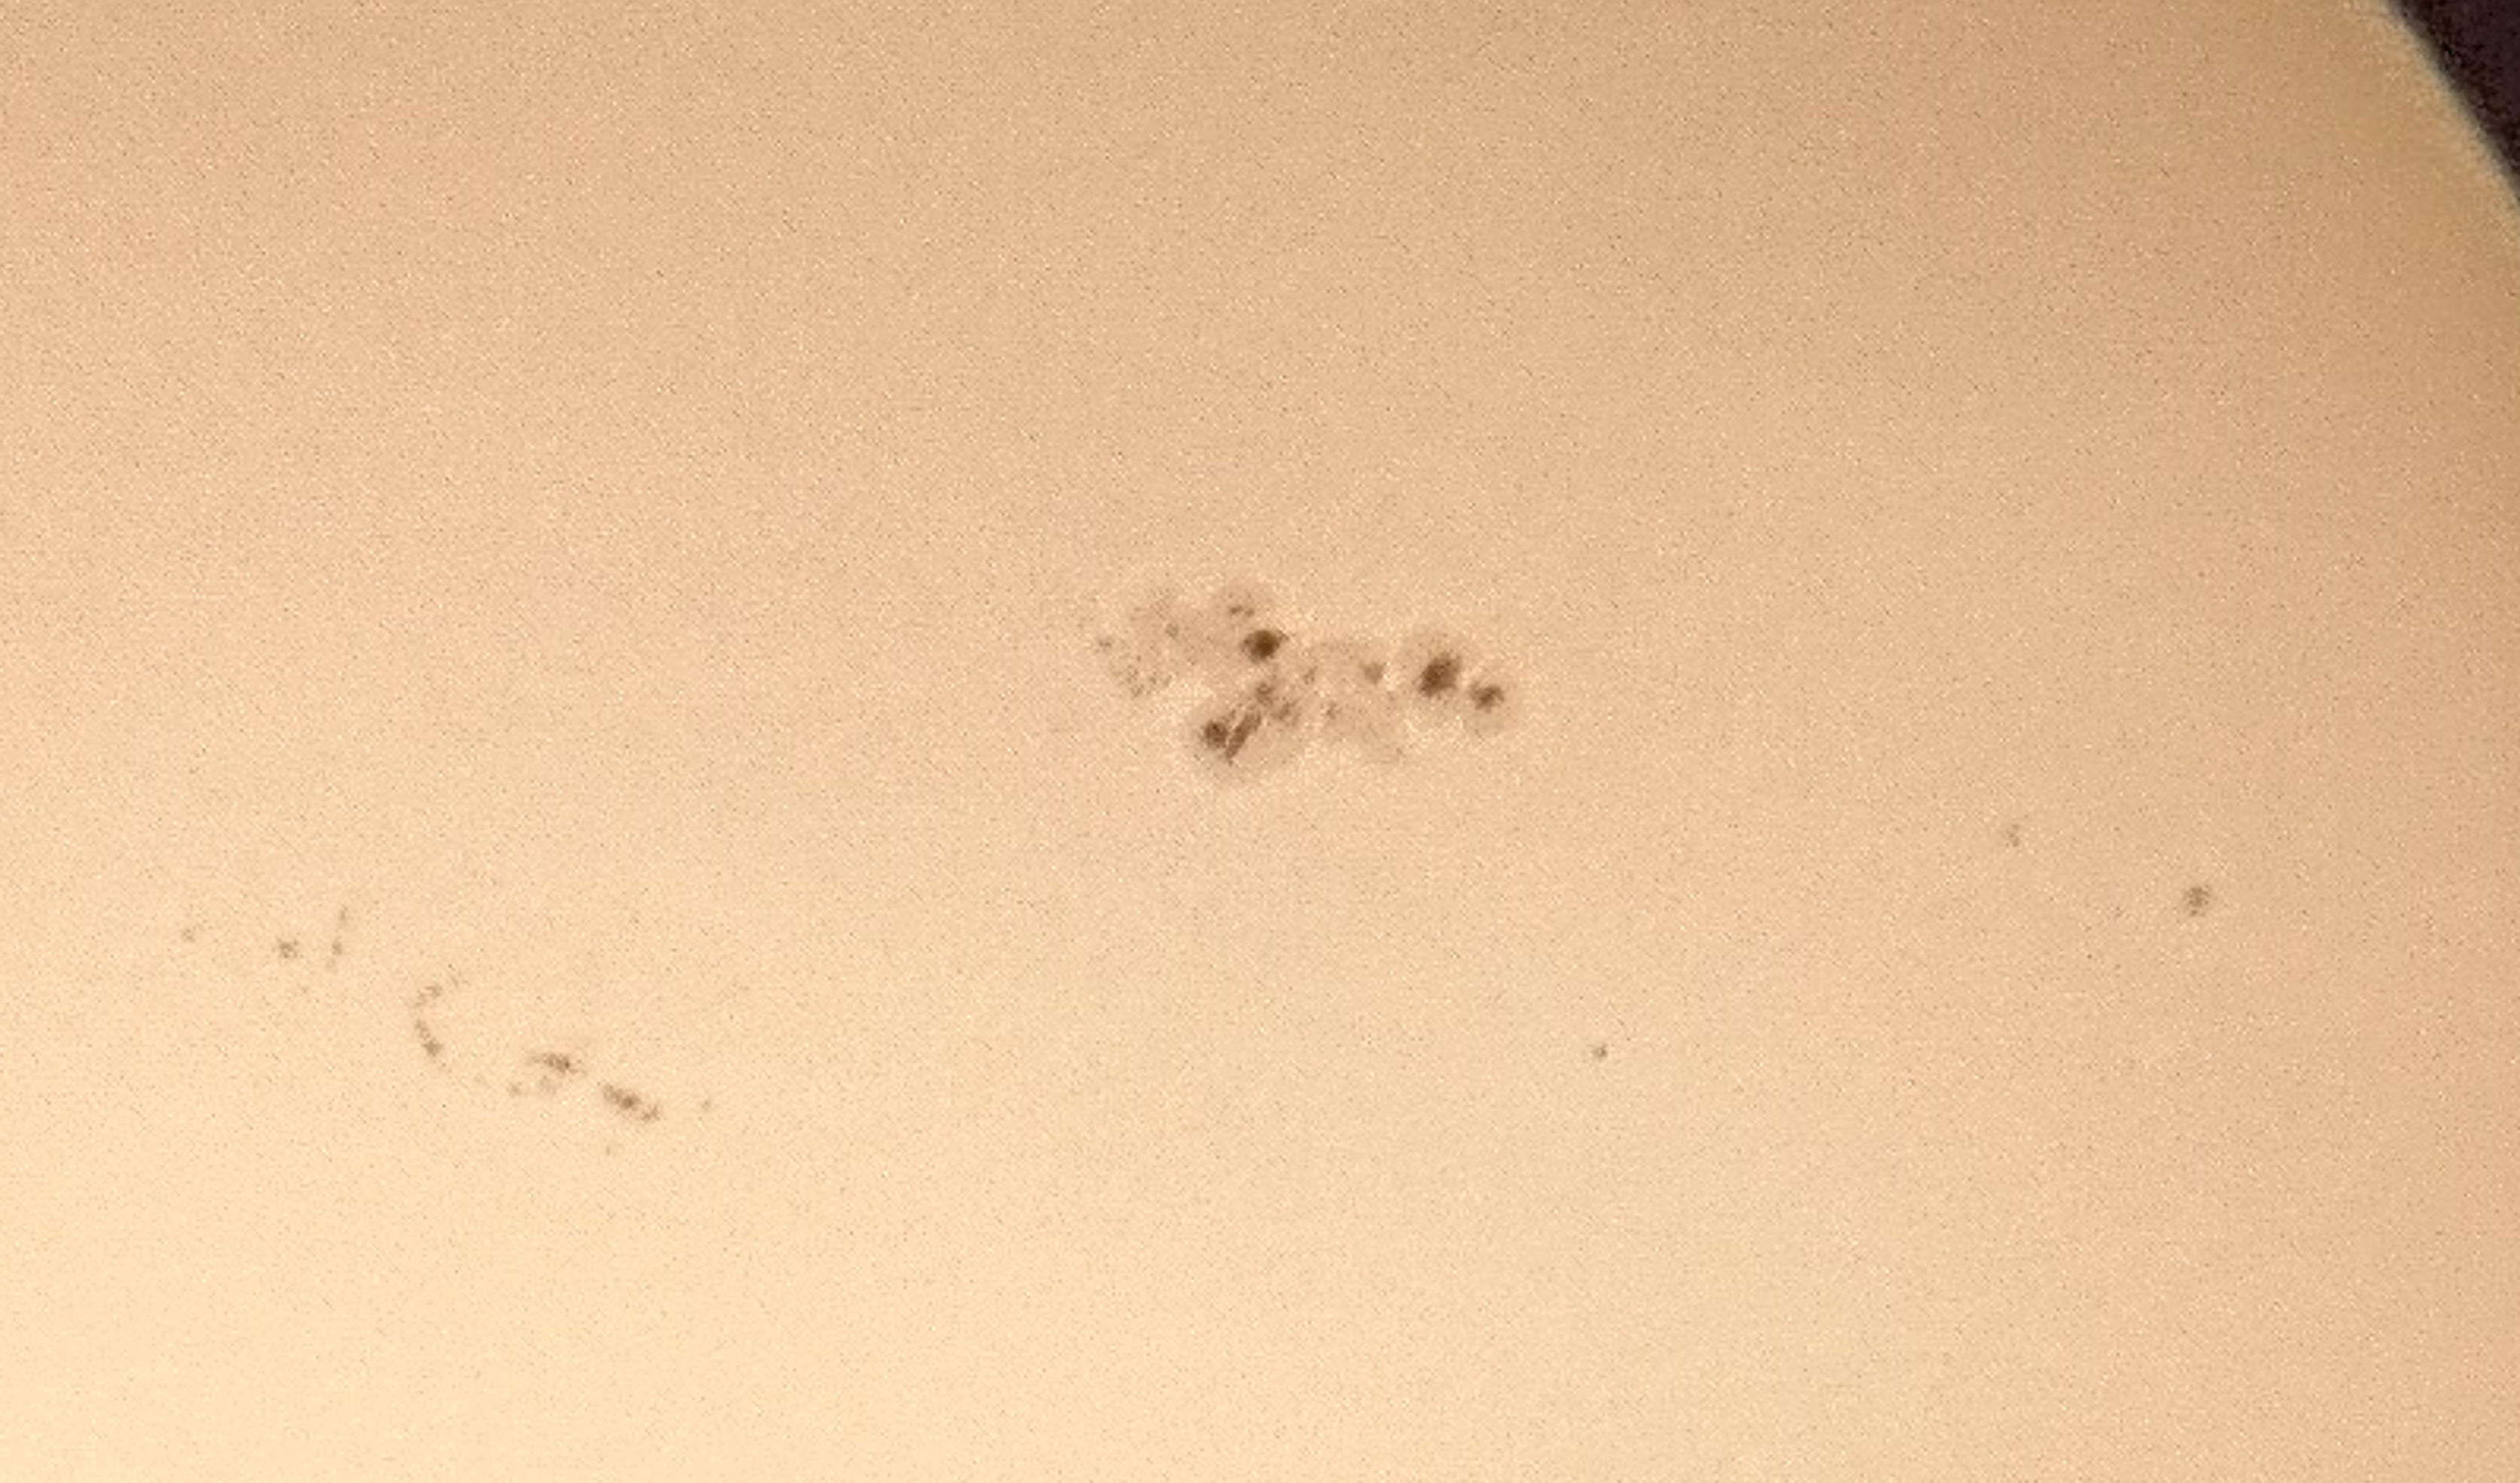
NOAA 3014 dominated the solar surface during the past week, with - according to the NOAA/SWPC data - its sunspot area about 7 times that of the Earth's surface. This makes it the largest sunspot group of solar cycle 25 (SC25) so far. Underneath a picture of this big and complex sunspot group and its surroundings taken in white light using a 20cm telescope on 22 May. The clip in the online version of this newsitem at https://www.stce.be/news/592/welcome.html shows the evolution of the sunspot region from 16 till 22 May, as observed by SDO/HMI (https://sdo.gsfc.nasa.gov/data/aiahmi/ ).
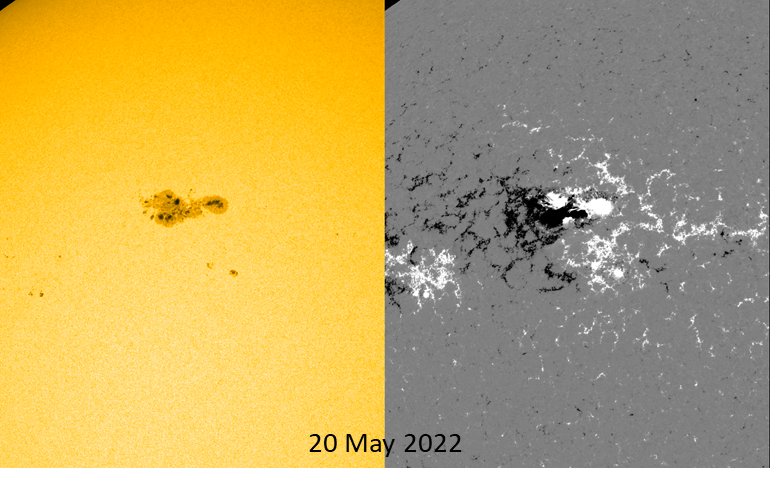
The region was also magnetically very complex, with an important delta structure present from 18 May onwards. A sunspot group is said to have a delta structure when it contains at least one mature spot in which umbrae of opposite magnetic polarities are separated by less than 2 degrees and situated within the common penumbra. This is shown in the comparison images underneath, with a white light image on the left and a magnetogram on the right as taken by the SDO/HMI istrument. White indicates magnetic field lines leaving the Sun ("positive polarity"), black indicates magnetic field lines returning to the Sun ("negative polarity"). The line separating these areas of opposite polarity magnetic fields is called the "neutral line" or also the "magnetic polarity inversion line" (PIL).
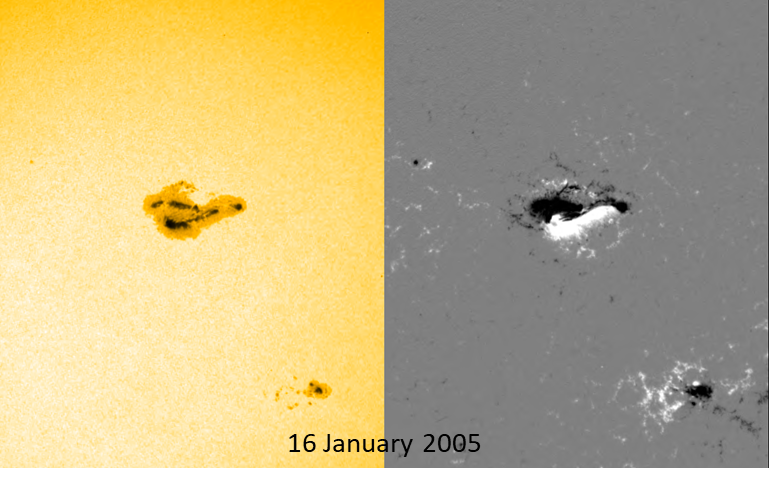
During its transit, the general outlook of NOAA 3014 reminded some observers of another sunspot group that was visible in January 2005 (SC23). Though similar in overall outlook, NOAA 0720 was slightly larger than NOAA 3014, its area at about 9 times that of the Earth's surface. More importantly, it had a much more complex magnetic structure, with one single huge penumbra containing several spots of opposite magnetic polarity and with the neutral line cutting the group almost in half. It basically looked like one huge delta structure, as can be seen from the SOHO/MDI imagery underneath on 16 January 2005 (http://soi.stanford.edu/data/ ). Correcting for the GOES scaling factor (https://www.ngdc.noaa.gov/stp/satellite/goes/index.html ), this region produced 25 M-class flares and 7 X-class events, the strongest an X10.1 flare on 20 January 2005. This eruption was associated with a moderate proton event, however the greater than 100 MeV proton flux peaked at 652 pfu (proton flux units), a value that had not been observed since October 1989 (680 pfu). It resulted in GLE 69, one of the more outstanding Ground Level Enhancements of the last few decades (see the Oulu webpage at https://gle.oulu.fi/#/ ). Despite its prominent delta structure, NOAA 3014 produced only 4 low-level M-class flares so far, thus remaining quite under the expectations for such a large and complex sunspot group.
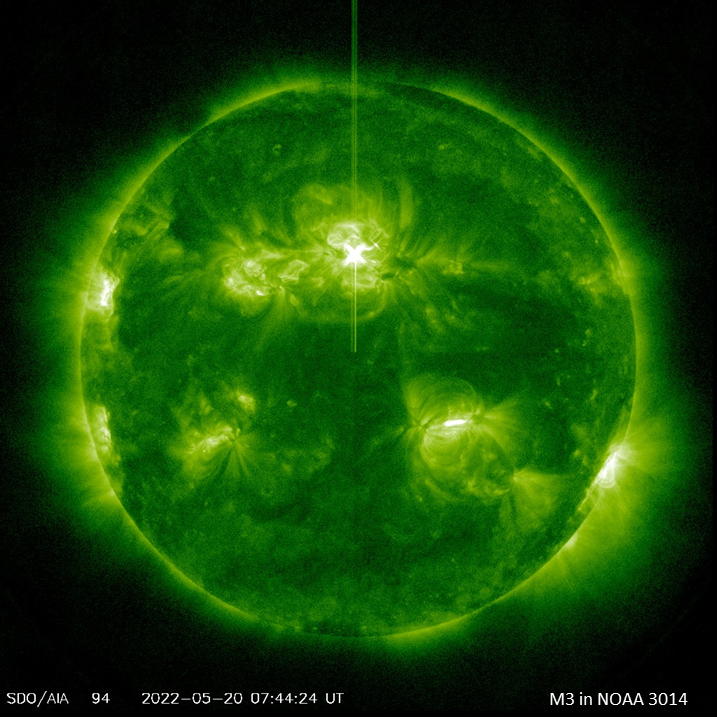
In the past, several research groups have examined the underlying causes of flare production by sunspot groups, such as Al-Ghraibah et al. (2015 - https://doi.org/10.1051/0004-6361/201525978 ) and Nishizuka et al. (2017 - https://iopscience.iop.org/article/10.3847/1538-4357/835/2/156 ). In the former study, magnetic gradients showed the best forecasting ability, whereas in the latter study, from amongst 60 (!) potentially contributing parameters, it was found that preceding flare activity by the group was most effective, followed by the length of the magnetic neutral lines, the unsigned magnetic flux, and the area of ultraviolet brightening, all of which are strongly correlated with the flux emergence dynamics in an active region. With still so many potentially contributing parameters, the solar flare forecaster's life has not gotten any easier. The online imagery shows the Sun in extreme ultraviolet on 19 and 20 May as observed by SDO/AIA 094, during which NOAA 3017 produced an M5 flare (first bright flash in the clip), and NOAA 3014 3 M-class flares. The image underneath shows the M3 eruption in NOAA 3014 on 20 May at 07:44UT.
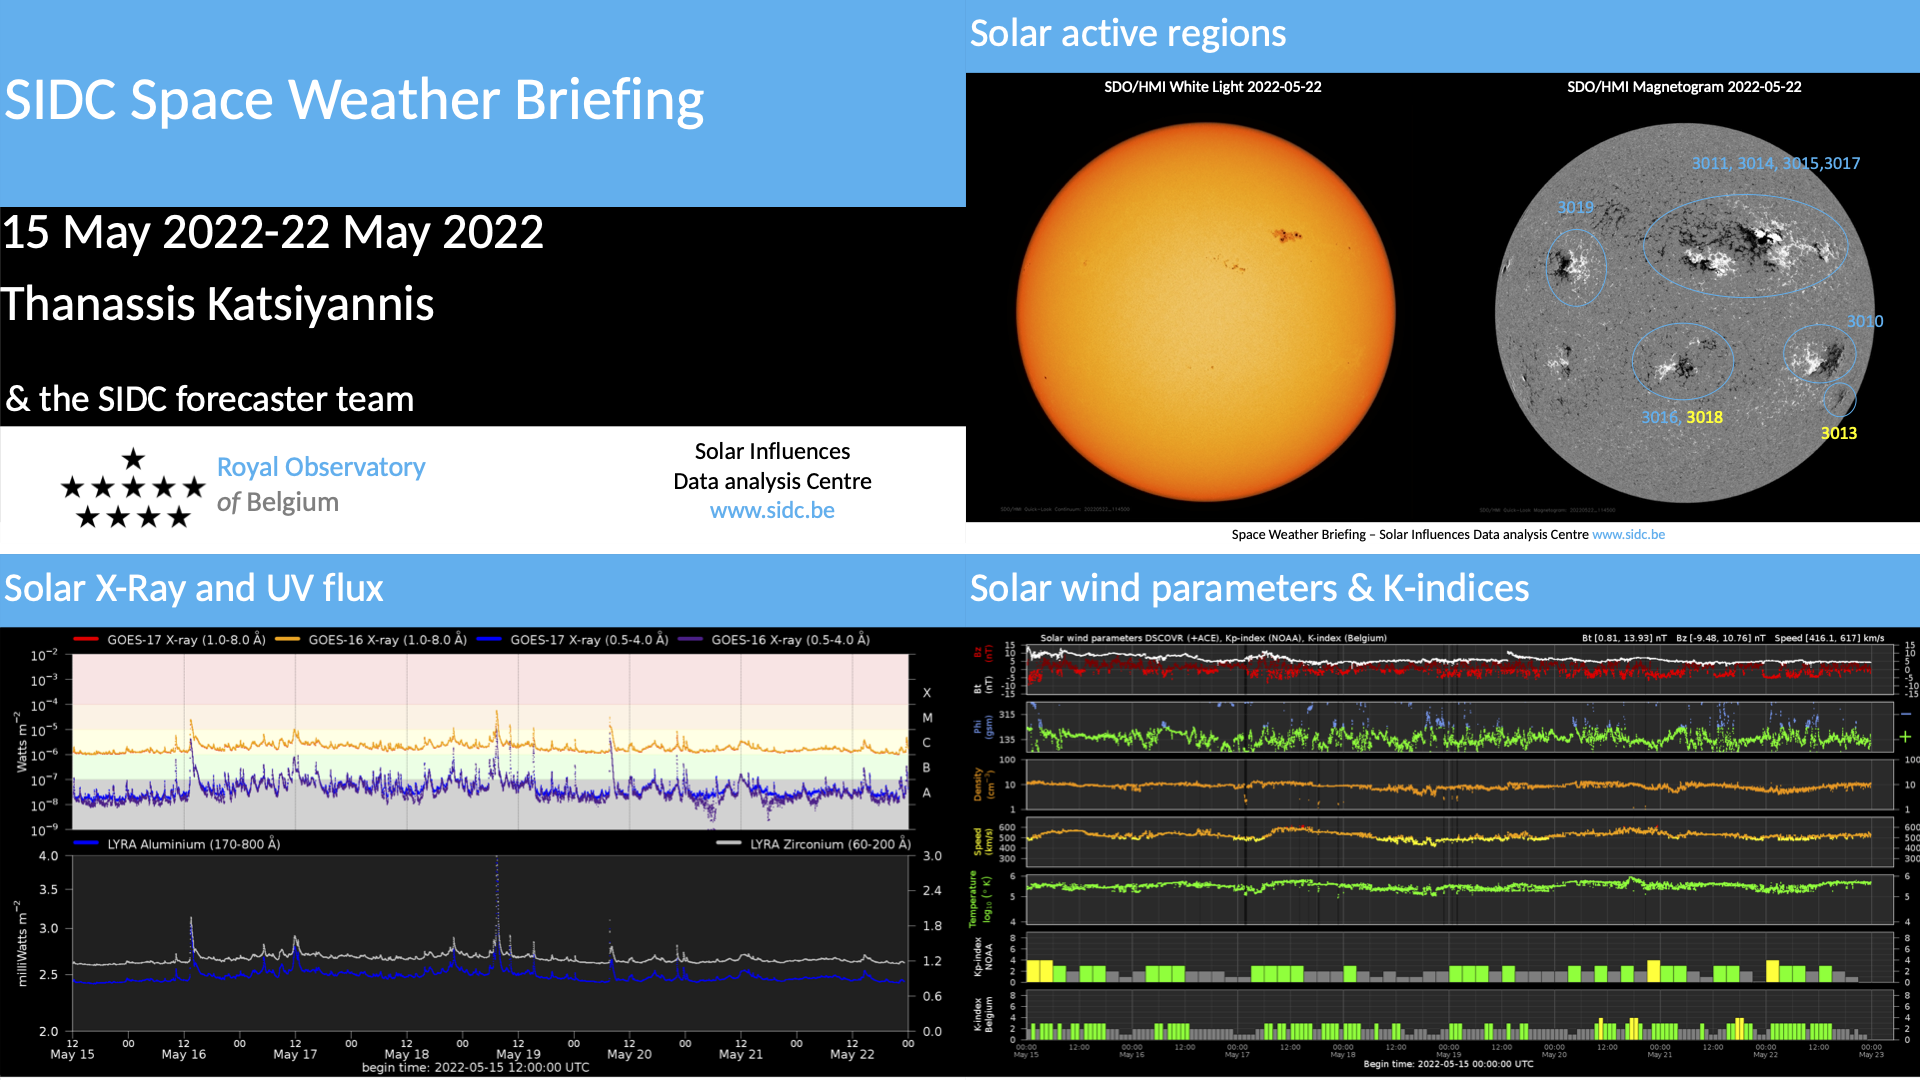
Review of solar activity
Flares
Solar flaring activity was mostly at moderate levels during the week.
NOAA Active Region (AR) 3014 (magnetic type Beta-Gamma-Delta, Catania group 14) produced all but one of the M-class flares (an M1 on 18 May, two M1 flares on 19 May, and an M3 flare on 20 May); while NOAA AR 3017 (magnetic type Beta, Catania group 15) produced the brightest event, an M5.6 flare, on 19 May 07:19 UT.
Numerous C-class flares were detected all days of the week. Throughout the week the solar disk featured a number of AR, the most prominent of which was a group consisting of NOAA AR 3011, 3014, 3015, and 3017.
Coronal Mass Ejections
There were a number of filaments observed on disk over the week, but no significant filament eruptions were observed. Several Coronal Mass Ejections (CME) were observed during the week, however, none of them was detected at L1. The only partial halo CME was found to be back-sided.
Particle flux near Earth
The greater than 10 MeV proton flux was at nominal levels. The greater than 2MeV electron flux was below the 1000 pfu threshold during the week. The 24h electron fluence was at normal levels throughout the week.
Review of geomagnetic activity
The solar wind speed, measured at L1, was at high levels throughout the week, ranging between 420 and 620 km/s. The total magnetic field magnitude remained below 12 nT throughout the week, while the phi angle of the interplanetary magnetic field was predominantly in the positive sector (directed away from the Sun).
Geomagnetic conditions were globally moderate on 20 and 22 May and quiet for the rest of the week (NOAA Kp 0-4). Locally they were moderate on 21 and 22 May and quiet on all the other days (Local K Bel 1-4).
Noticeable Solar Events (16 May 2022 - 22 May 2022)
| DAY | BEGIN | MAX | END | LOC | XRAY | OP | 10CM | TYPE | Cat | NOAA |
| 16 | 1310 | 1327 | 1344 | N14E73 | M2.4 | SF | 3017 | |||
| 18 | 2156 | 2202 | 2208 | S15W1 | M1.1 | SF | 14 | 3014 | ||
| 19 | 0700 | 0719 | 0731 | N12E37 | M5.6 | 1F | III/1 | 15 | 3017 | |
| 19 | 1000 | 1009 | 1020 | N20E18 | M1.5 | 1N | III/1 | 14 | 3014 | |
| 19 | 1505 | 1516 | 1523 | N21E13 | M1.1 | SF | VI/1 | 14 | 3014 | |
| 20 | 0735 | 0745 | 0749 | N20E3 | M3.0 | 1B | 210 | 14 | 3014 |
| LOC: approximate heliographic location | TYPE: radio burst type |
| XRAY: X-ray flare class | Cat: Catania sunspot group number |
| OP: optical flare class | NOAA: NOAA active region number |
| 10CM: peak 10 cm radio flux |
PROBA2 Observations
Solar Activity
Solar flare activity fluctuated from low to moderate during the week.
In order to view the activity of this week in more detail, we suggest to go to the following website from which all the daily (normal and difference) movies can be accessed: https://proba2.oma.be/ssa
This page also lists the recorded flaring events.
A weekly overview movie can be found here (SWAP week 634): http://proba2.oma.be/swap/data/mpg/movies/20220519_swap_movie.mp4
Details about some of this week's events can be found further below.
If any of the linked movies are unavailable they can be found in the P2SC movie repository here: https://proba2.oma.be/swap/data/mpg/movies/
Thursday May 19
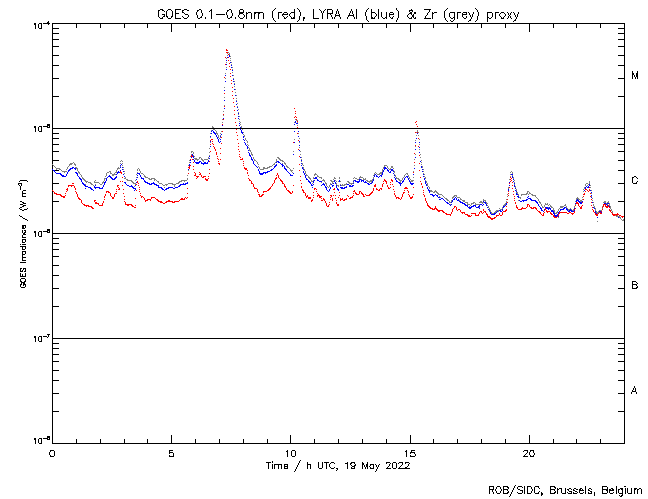
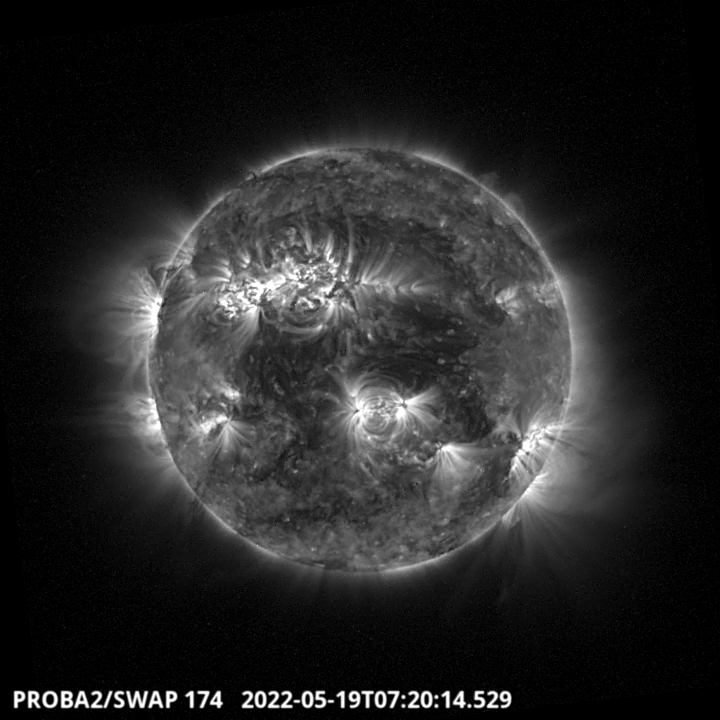
The largest flare of the week is a M5.6 flare. It has been produced by the active region NOAA 3017, which is localized in the North-Est part of the solar disk. This event is visible on the LYRA and SWAP images above. Find a movie of the events here (SWAP difference movie): https://proba2.oma.be/swap/data/mpg/movies/20220519_swap_movie.mp4
The International Sunspot Index by SILSO
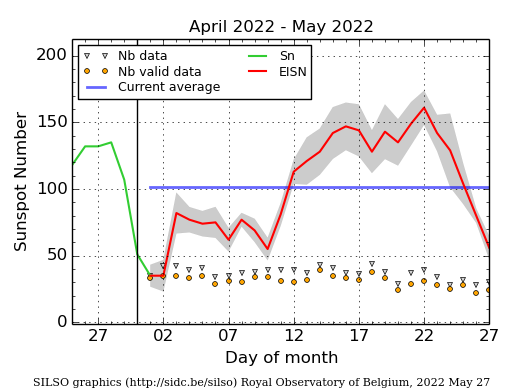
The daily Estimated International Sunspot Number (EISN, red curve with shaded error) derived by a simplified method from real-time data from the worldwide SILSO network. It extends the official Sunspot Number from the full processing of the preceding month (green line), a few days more than one solar rotation. The horizontal blue line shows the current monthly average. The yellow dots give the number of stations that provided valid data. Valid data are used to calculate the EISN. The triangle gives the number of stations providing data. When a triangle and a yellow dot coincide, it means that all the data is used to calculate the EISN of that day.
Geomagnetic Observations in Belgium
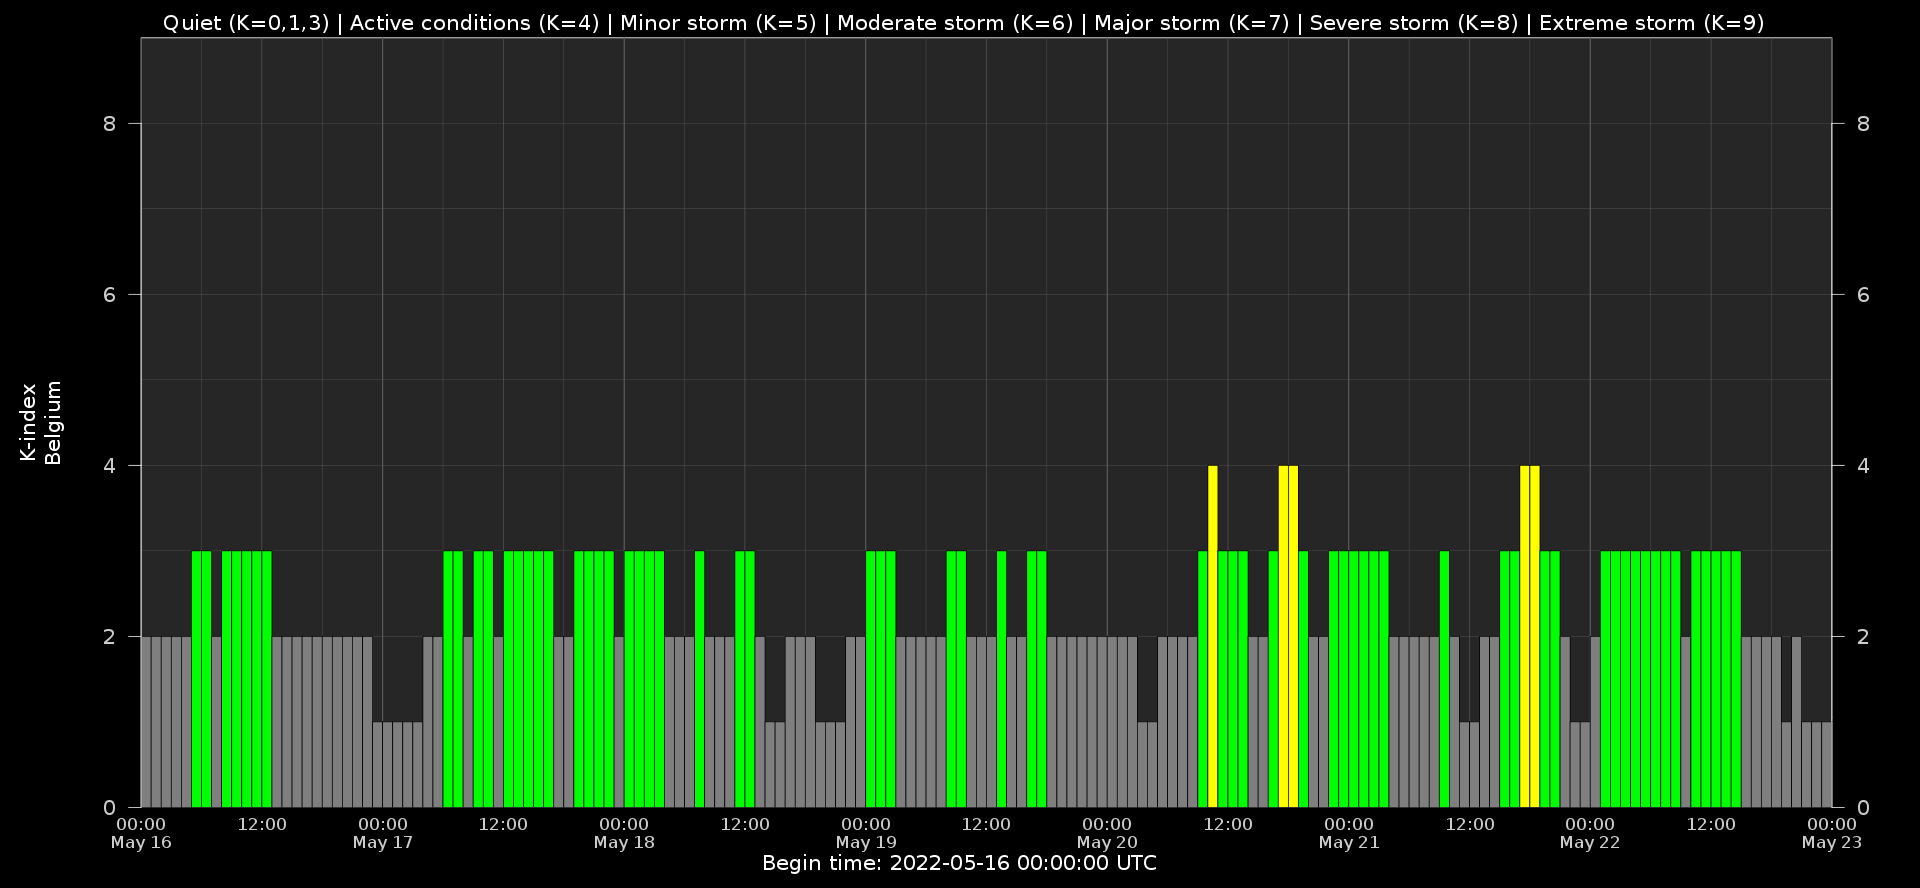
Local K-type magnetic activity index for Belgium based on data from Dourbes (DOU) and Manhay (MAB). Comparing the data from both measurement stations allows to reliably remove outliers from the magnetic data. At the same time the operational service availability is improved: whenever data from one observatory is not available, the single-station index obtained from the other can be used as a fallback system.
Both the two-station index and the single station indices are available here: http://ionosphere.meteo.be/geomagnetism/K_BEL/
The SIDC space weather briefing
The forecaster on duty presented the space weather overview from May 16 to 22. The pdf and movies can be found in: https://www.stce.be/briefings/20220523/
Action!
Check out our activity calendar: activities and encounters with the Sun-Space-Earth system and Space Weather as the main theme. We provide occasions to get submerged in our world through educational, informative and instructive activities.
If you want your event in our calendar, contact us: stce_coordination at stce.be
* June 9, Public Lecture, Noorderlicht - hemelse wetenschap, Molenhof, Leuven, Belgium
* June 13-15, Space Weather Introductory Course - onsite, by the STCE, Brussels, Belgium
* June 21, First Innovation day of PITHIA-NRF, Rome, Italy
* June 25, STCE at the Summer Space Festival
* July 3, Public Lecture on STCE's mission to the Sun, Cosmodrome, Genk, Belgium
* August 25, Public Lecture on Space Weather and Aviation, Astropolis, Oostende, Belgium
* October 24-28, 18th European Space Weather Week, Zagreb, Croatia
* November 21-23, Space Weather Introductory Course - onsite, by the STCE, Brussels, Belgium
* December 5, 6, 8, 9, Space Weather Introductory Course - online, by the STCE, zoom
Check: https://www.stce.be/calendar