- Table of Content
- 1.Long duration ...
- 2.Review of sola...
- 3.Review of geom...
- 4.USET Observati...
- 5.Noticeable Sol...
- 6.PROBA2 Observa...
- 7.Geomagnetic Ob...
- 8.The SIDC space...
- 9.Action!
2. Review of solar activity
3. Review of geomagnetic activity
4. USET Observations
5. Noticeable Solar Events (13 Jun 2022 - 19 Jun 2022)
6. PROBA2 Observations (13 Jun 2022 - 19 Jun 2022)
7. Geomagnetic Observations in Belgium (13 Jun 2022 - 19 Jun 2022)
8. The SIDC space weather briefing
9. Action!
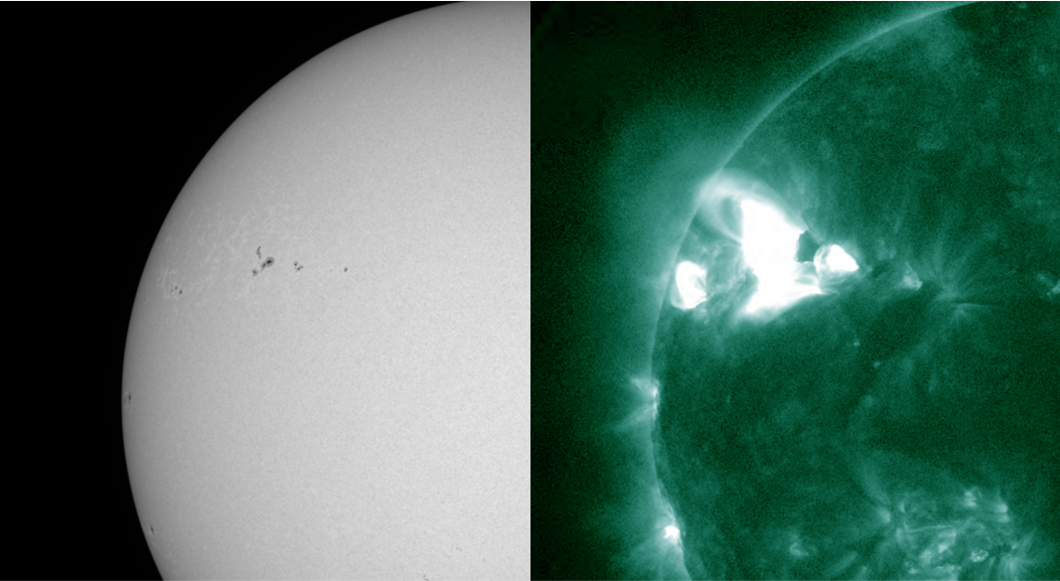
Long duration M3 flare
NOAA 13032 produced an M3.4 flare peaking at 04:07UTC on 13 June. The image underneath was taken at 04:07UTC and compares the view in extreme ultraviolet (EUV, SDO/AIA 094: https://sdo.gsfc.nasa.gov/data/aiahmi/ ) with a white light image (SDO/HMI), clearly confirming NOAA 13032 as the flare source, but with also some contributions from the two smaller regions NOAA 13033 and 13030, respectively to the east ("left") and west ("right") of NOAA 13032. The flare was a long duration event (LDE), lasting from 02:58 until 05:12UTC, or more than 2 hours. An enhancement in the greater than 10 MeV proton flux was observed and lasted for several days, however the values remained well below the alert threshold. The eruption was also noticeable on radio frequencies. At wavelengths near 10.7 cm where the daily solar radio flux is measured, a radio burst was recorded with peak values of 670 sfu (Solar Flux Unit, 1 sfu = 10-22 W / m2 Hz) above the pre-burst background. This qualifies the eruption as a Tenflare, i.e. a solar flare accompanied by a 10 cm radio noise burst of intensity at least double that of the pre-flare 10 cm background flux (in this case, around 130 sfu).
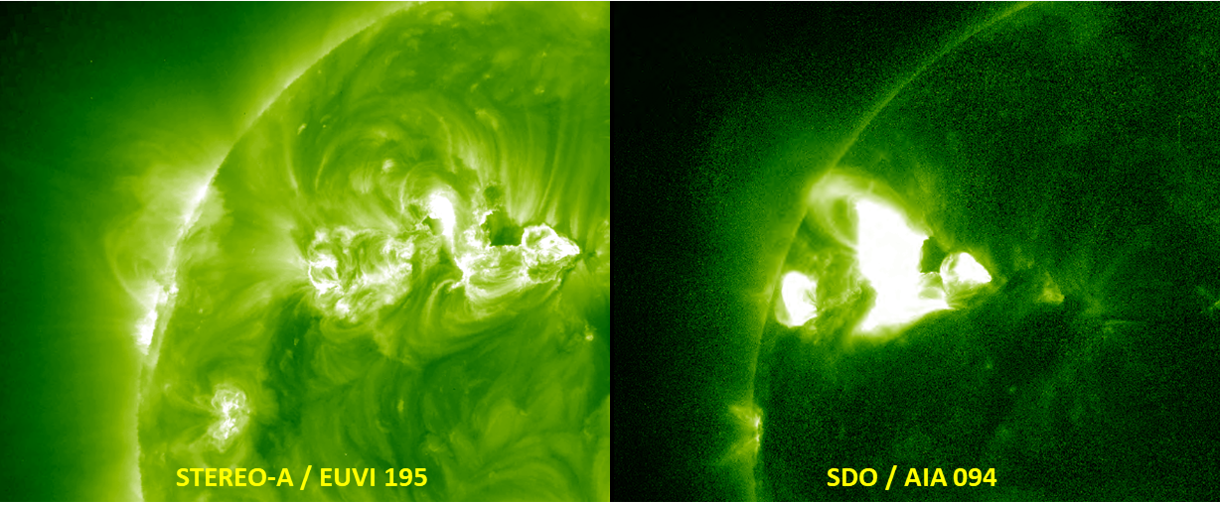
The imagery below compares the view in EUV between SDO/AIA 094 and STEREO-A/EUVI 195 (https://stereo-ssc.nascom.nasa.gov/beacon/beacon_secchi.shtml ), and were both taken at 04:05UTC. Whereas AIA 094 better shows the extent and intensity of the flare at multi-million degrees, EUVI 195 shows the event at "cooler" temperatures around 1.5 million degrees, highlighting the post-flare coronal loops as well as local areas of coronal dimming (the relatively short-lived areas of darkening). STEREO-A is trailing Earth (and thus SDO) by 28 degrees, and thus had a better view on the eruption site. Some clips are in the online version of this newsitem at https://www.stce.be/news/596/welcome.html
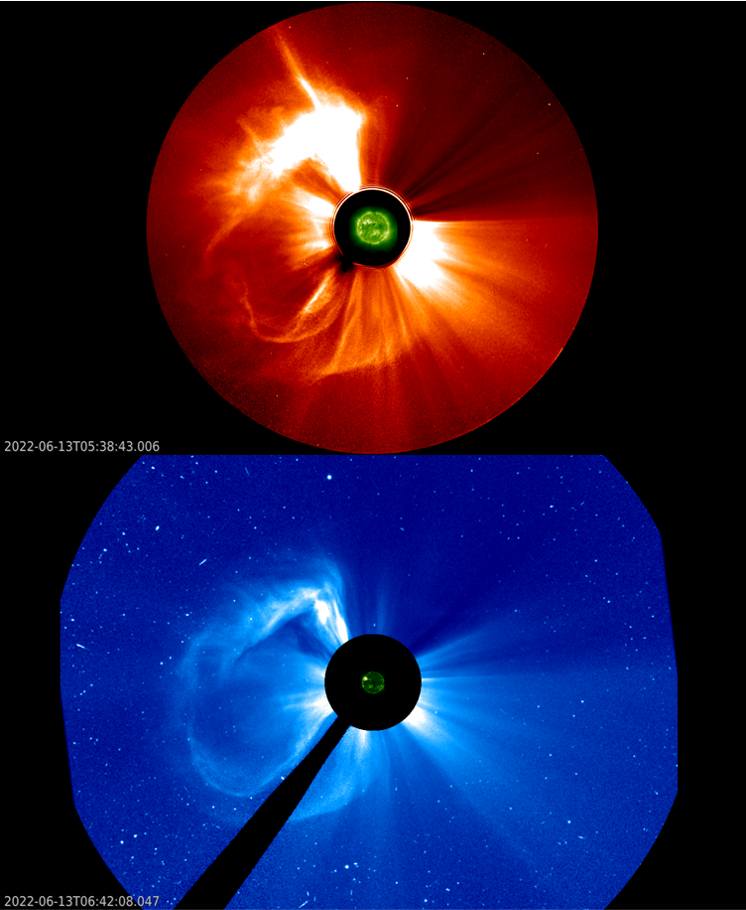
Based then on the above observations, it was no surprize that a coronal mass ejection (CME) was recorded by the various coronagraphs, and that the bulk of this CME was directed behind the Earth. Both STEREO-A/COR2 (top) as SOHO/LASCO C3 (bottom ; https://soho.nascom.nasa.gov/ ) showed this CME had a weak earth-directed component, and indeed, around 04:00UTC on 15 June, a small and brief disturbance was recorded in the solar wind parameters. Kp reached minor storm levels, the preliminary Dst index reached a meager -30 nT which is on the borderline between quiet conditions and a weak storm (see https://www.stce.be/educational/classification for more info on these geomagnetic indices). Of course, nothing more could be expected from this glancing blow.
Review of solar activity
Electromagnetic radiation: Flares
Twelve (12) active regions were observed on the sun, as seen from Earth. Thirty nine (39) C-class flares and 2 M-class flares were measured by GOES. The strongest flare was the long duration M3.4 flare, which peaked at 04:07 UT on June 13. The flare originated from the NOAA AR 3032 and was associated with a partial halo Coronal Mass Ejection (CME).
Solar wind: Coronal Mass Ejections
Two halo CMEs were observed this week with the first associated with the M3.4 flare. The first CME was first observed in the SOHO/LASCO C2 field of view at 01:48 UT on June 13. The CME had a projected plane-of-the-sky velocity of about 1200 km/s (as reported by the CACTUS software) and angular width of about 270 degrees.
The second CME, first observed in the SOHO/LASCO C2 field of view at 01:25 UT on June 14, was back sided. The CME had the angular width of about 280 degrees and projected plane-of-the-sky velocity of 500 km/s (as reported by the CACTUS software).
Solar wind: Coronal Hole
An equatorial, positive polarity coronal hole was observed. The coronal hole reached the central meridian on June 12 and its transition across the central meridian lasted few days due to its patchy longitudinal extensions.
Particle radiation: protons and electrons
The greater than 10 MeV proton flux was at background level.
The greater than 2 MeV electron flux was most of the week bellow the threshold value of 1000 pfu. During the last three days of the week the greater than 2 MeV electron flux crossed the threshold value of 1000 pfu. Similarly, the 24h electron fluence was most of the time at normal level and in the last three days of the week at moderate level.
Review of geomagnetic activity
Earth was influenced by a fast solar wind. From June 13 to 15, the solar wind speed fluctuated around 500 km/s and the rest of the week around 600 km/s. The interplanetary magnetic field (IMF) was elevated during the first two days of the week (going up to about 14 nT) and at the arrival of a shock. The rest of the week, the IMF fluctuated around 6nT.
On June 15, around 04:00 UT, the IMF magnitude, the solar wind speed, density and temperature increased suddenly. The shock was associated with the CME that was first observed in the SOHO/LASCO C2 field of view at 01:48 UT on June 13.
Geomagnetic conditions were quiet to unsettled, with some active intervals. The active periods were linked to the fast solar wind and the shock arrival.
USET Observations
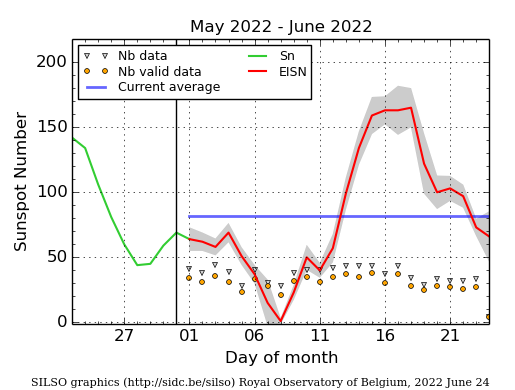
The daily Estimated International Sunspot Number (EISN, red curve with shaded error) derived by a simplified method from real-time data from the worldwide SILSO network. It extends the official Sunspot Number from the full processing of the preceding month (green line), a few days more than one solar rotation. The horizontal blue line shows the current monthly average. The yellow dots give the number of stations that provided valid data. Valid data are used to calculate the EISN. The triangle gives the number of stations providing data. When a triangle and a yellow dot coincide, it means that all the data is used to calculate the EISN of that day
Noticeable Solar Events (13 Jun 2022 - 19 Jun 2022)
| DAY | BEGIN | MAX | END | LOC | XRAY | OP | 10CM | TYPE | Cat | NOAA |
| 13 | 0258 | 0407 | 0512 | M3.4 | N | 670 | I/2 3V/1 | 46 | 3032 | |
| 16 | 0347 | 0353 | 0357 | M1.6 | 44 | 3031 |
| LOC: approximate heliographic location | TYPE: radio burst type |
| XRAY: X-ray flare class | Cat: Catania sunspot group number |
| OP: optical flare class | NOAA: NOAA active region number |
| 10CM: peak 10 cm radio flux |
PROBA2 Observations (13 Jun 2022 - 19 Jun 2022)
Solar Activity
Solar flare activity fluctuated from low to moderate during the week.
In order to view the activity of this week in more detail, we suggest to go to the following website from which all the daily (normal and difference) movies can be accessed: https://proba2.oma.be/ssa
This page also lists the recorded flaring events.
A weekly overview movie can be found here (SWAP week 638). https://proba2.oma.be/swap/data/mpg/movies/weekly_movies/weekly_movie_2022_06_13.mp4
Details about some of this week's events can be found further below.
If any of the linked movies are unavailable they can be found in the P2SC movie repository here https://proba2.oma.be/swap/data/mpg/movies/
Monday Jun 13
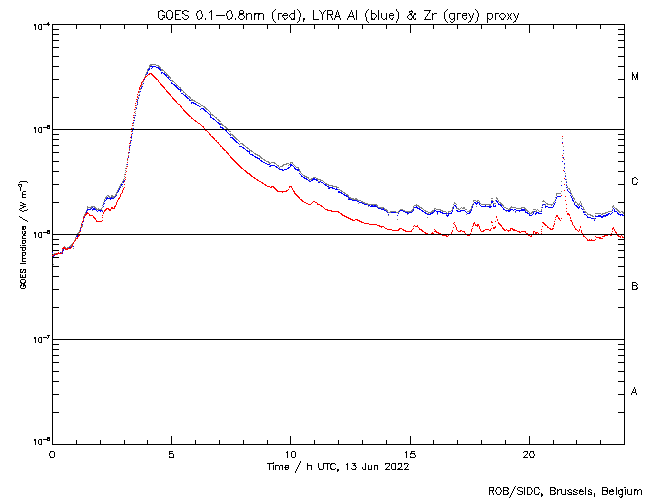
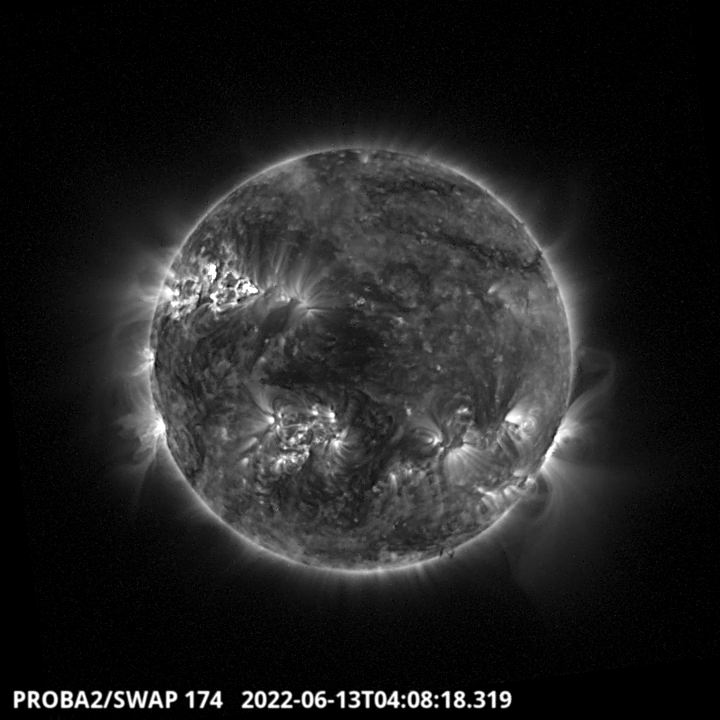
The largest flare of the week was an M3.4. It erupted from the active region 3032 on the North- West side of the solar disk around 4:08 UT. It was a very long flare (more than two hours), which is visible on the LYRA curves and SWAP image above. Find a movie of the events here (SWAP movie) https://proba2.oma.be/swap/data/mpg/movies/20220613_swap_movie.mp4
Geomagnetic Observations in Belgium (13 Jun 2022 - 19 Jun 2022)
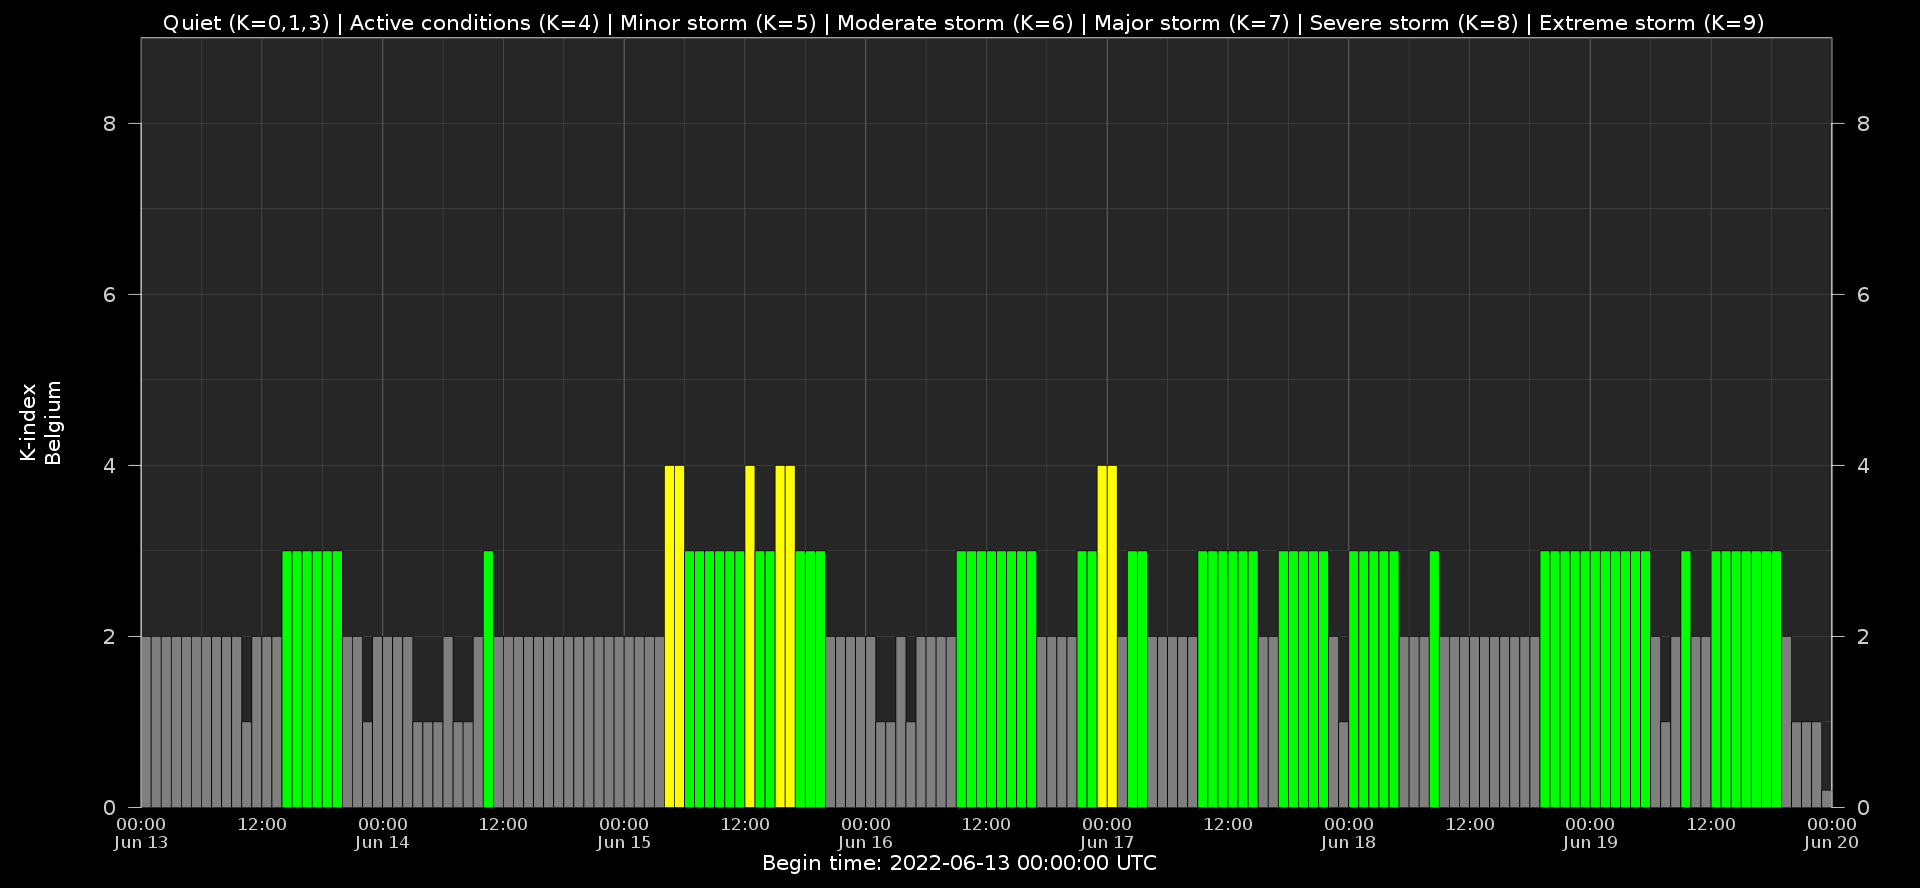
Local K-type magnetic activity index for Belgium based on data from Dourbes (DOU) and Manhay (MAB). Comparing the data from both measurement stations allows to reliably remove outliers from the magnetic data. At the same time the operational service availability is improved: whenever data from one observatory is not available, the single-station index obtained from the other can be used as a fallback system.
Both the two-station index and the single station indices are available here: http://ionosphere.meteo.be/geomagnetism/K_BEL/
The SIDC space weather briefing
The Space Weather Briefing presented by the SIDC (https://www.sidc.be) forecaster on duty from June 12 to 19. It reflects in images and graphs what is written in the Solar and Geomagnetic Activity report: https://www.stce.be/briefings/20220620_SWbriefing.pdf
Action!
Check out our activity calendar: activities and encounters with the Sun-Space-Earth system and Space Weather as the main theme. We provide occasions to get submerged in our world through educational, informative and instructive activities.
If you want your event in our calendar, contact us: stce_coordination at stce.be
* June 25, STCE at the Summer Space Festival, Brussels, Belgium
* July 3, Public Lecture on STCE's missions to the Sun, Cosmodrome, Genk, Belgium
* August 25, Public Lecture on Space Weather and Aviation, Astropolis, Oostende, Belgium
* October 24-28, 18th European Space Weather Week, Zagreb, Croatia
* November 21-23, Space Weather Introductory Course - onsite, by the STCE, Brussels, Belgium
* December 5, 6, 8, 9, Space Weather Introductory Course - online, by the STCE, zoom
Check: https://www.stce.be/calendar