- Table of Content
- 1.GNSS (a bit) i...
- 2.Space Weather ...
- 3.Review of sola...
- 4.Review of geom...
- 5.PROBA2 Observa...
- 6.The Internatio...
- 7.Geomagnetic Ob...
- 8.What to do and...
2. Space Weather Introductory Courses in 2023
3. Review of solar activity
4. Review of geomagnetic activity
5. PROBA2 Observations (21 Nov 2022 - 27 Nov 2022)
6. The International Sunspot Number by SILSO
7. Geomagnetic Observations in Belgium (21 Nov 2022 - 27 Nov 2022)
8. What to do and where to go
GNSS (a bit) in trouble
On 7 November, DSCOVR (https://www.swpc.noaa.gov/products/real-time-solar-wind ) registered a relatively small disturbance in the solar wind parameters. It was basically a 7-hours stretch of enhanced density, low temperature and a southward oriented magnetic field (negative Bz), as shown by respectively the orange, green and red curves underneath. The source of this "transient" is unknown. It was certainly not related to the wind stream from a coronal hole, due to the low solar wind speed (around 390 km/s and declining - yellow curve) and low temperature (green curve). Also, a sector boundary crossing (see this STCE news item at https://www.stce.be/news/269/welcome.html ) can be excluded, as the phi-angle (blue curve), which denotes the orientation of the magnetic field towards or away from the Sun, remained directed away from the Sun for the entire period, thus indicating Earth was in a positive sector all the time.
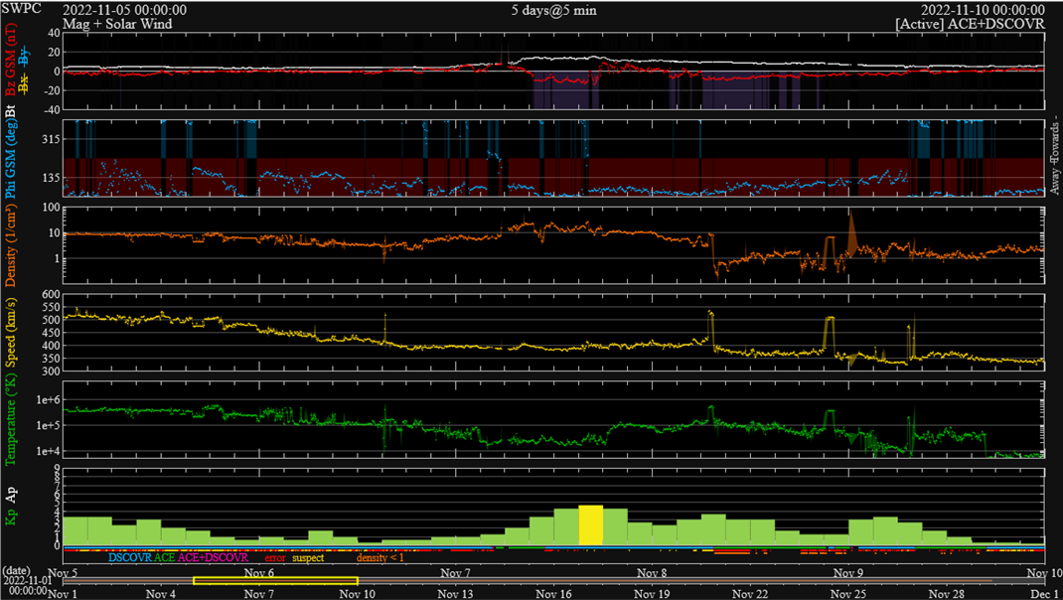
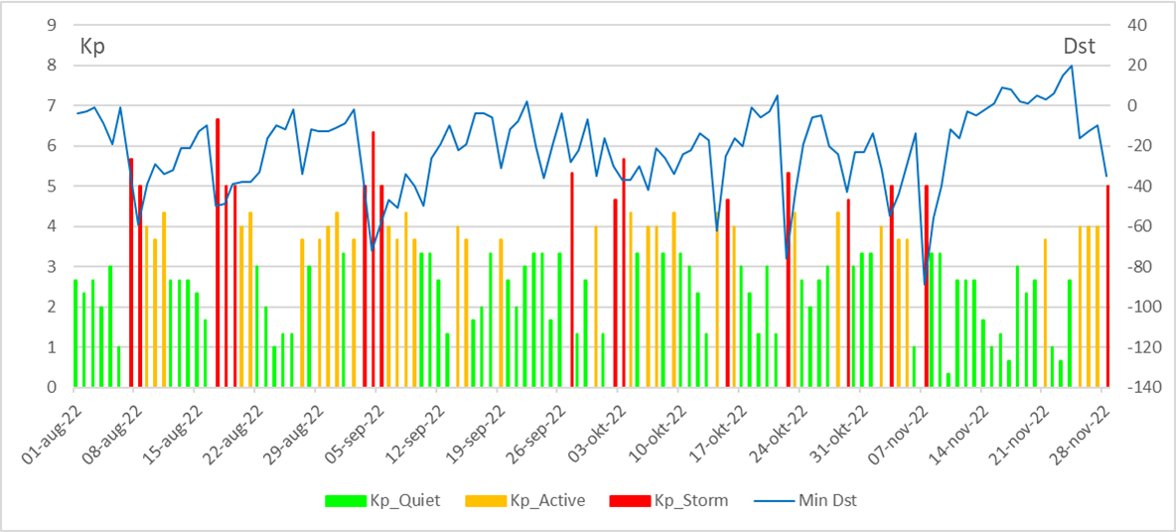
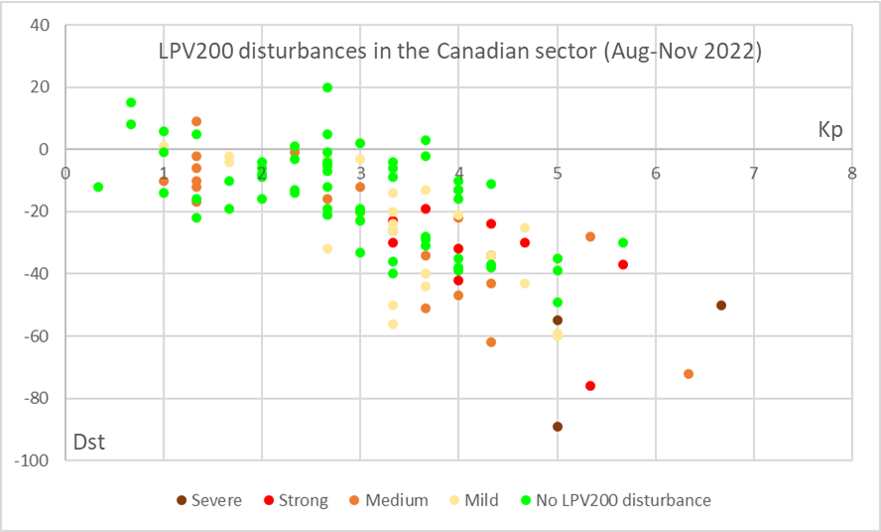
The long period of negative Bz (with values up to -14 nT) resulted in a minor geomagnetic storm during the same day. Kp reached "5-" (see the STCE SWx classification page at https://www.stce.be/educational/classification ) during the 15-18UT interval, and also the K index in Dourbes (http://ionosphere.meteo.be/geomagnetism/K_BEL/ ) reached the value 5, but during the 18-21UT interval. Interestingly, the Dst index reached a provisional value of -89 nT, making it one the strongest storms so far this solar cycle after 4 November 2021 (-105 nT) and 14 January 2022 (-91 nT). The storm-time disturbance index Dst is designed to measure the magnetic signature of mainly the ring current in the earth's magnetosphere. Dst is computed by four geomagnetically low latitude observatories sufficiently distant from the auroral and equatorial electrojets to inhibit noise from these two sources. The values are expressed in nT and are mostly negative in case of a strong geomagnetic disturbance, as the enhanced ring current tends to counteract (weaken) the earth's magnetic field. The graph underneath shows for each day during the period 1 August - 28 November 2022 the maximum Kp index and the minimum Dst index (data from WDC Kyoto at https://wdc.kugi.kyoto-u.ac.jp/ and GFZ Potsdam at https://kp.gfz-potsdam.de/en/ ). Though there's a general trend that with stronger disturbances of the geomagnetic field, Kp reaches higher values and Dst becomes more negative, there's certainly not a one-on-one correspondence between the two, as they are provided by different networks that measure effects from different locations in the magnetosphere.
GNSS, the Global Navigation Satellite System, has become a household term over the last 2 decades. It refers to a fleet of satellites that transmit positioning and timing data to receivers on the ground who can then use these data to accurately determine e.g. their location. Examples of GNSS include Europe’s Galileo (https://www.euspa.europa.eu/european-space/eu-space-programme ), the USA’s Global Positioning System (GPS), Russia’s GLONASS and China’s BeiDou. The transmitted satellite data can be disturbed in various ways, e.g. by space weather, and thus a number of systems have been developed to correct the transmitted data and improve the positional and timing accuracy. One of these "augmented" systems is called WAAS, which is short for Wide Area Augmentation System (https://www.nstb.tc.faa.gov/ ). It is based on GPS satellites and provides various services that enable aircraft to rely on GPS for all phases of flight, including precision approaches to any airport within its coverage area. Europe has a similar system called EGNOS (European Geostationary Navigation Overlay Service - https://egnos-user-support.essp-sas.eu/ ) which is based on Galileo satellites.
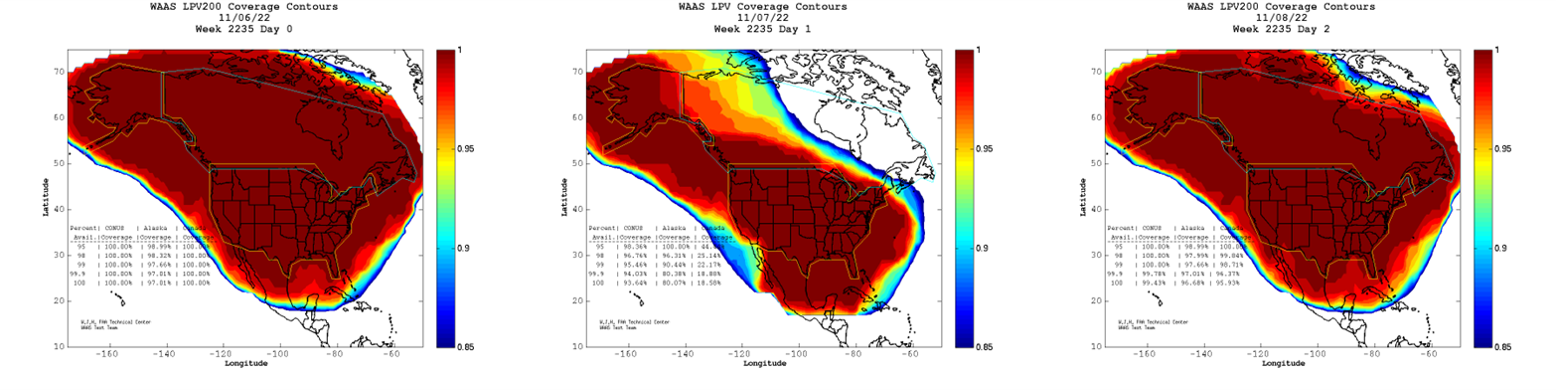
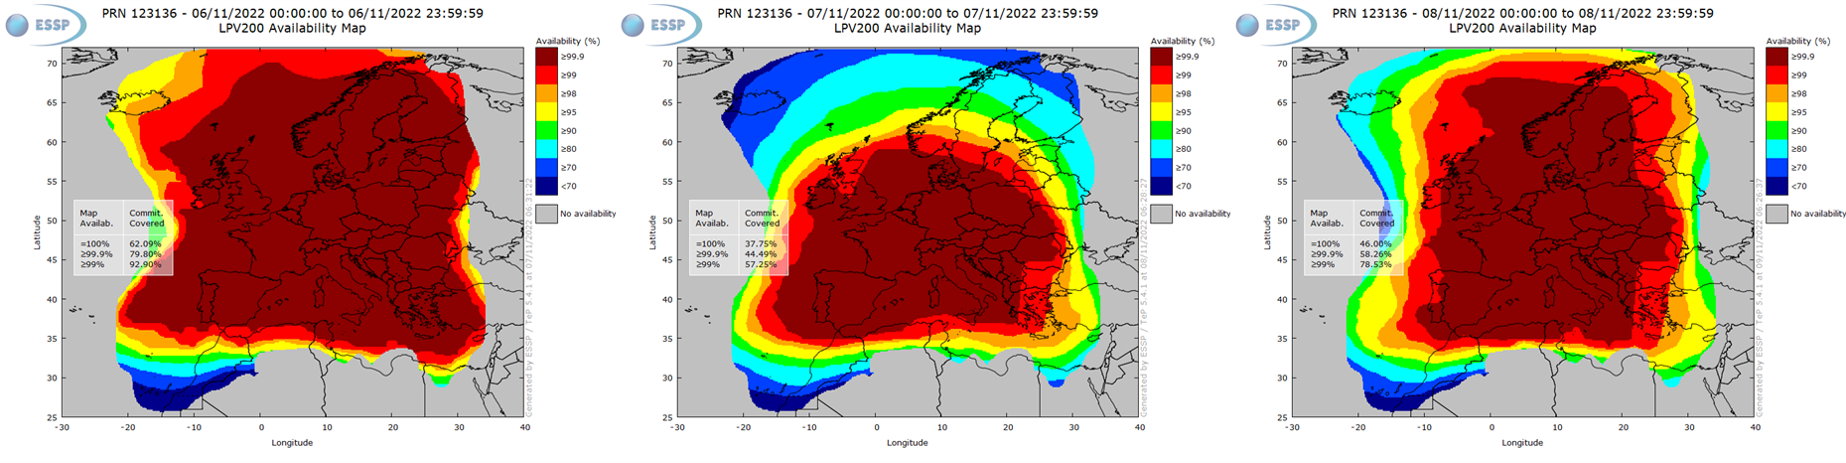
One of the WAAS services is called "LPV200", which is basically a vertically-guided landing approach aid for airplanes to as low as 200 feet (61 meters) above ground level. In the maps underneath, the availability of the LPV200 service for Canada, Alaska, and the "Contiguous US" (CONUS, aka "Lower 48") is shown on 6, 7 and 8 November. The redder, the better the LPV200 service coverage. It is evident that on 7 November, which corresponds to the day of the above-mentioned minor geomagnetic storm, the LPV200 service was significantly disturbed over large portions of Canada. No less than 82% of its area could not benefit from the full 100% of the LPV200 service, meaning that -if so required- they had to rely on back-up solutions to get the planes safely on the ground. These back-ups exist and can be used at all times, so no worries! The CONUS was significantly less affected, with only a few percent that could not rely on the full 100% LPV200 on 7 November. Similar conclusions can also be drawn for the EGNOS services over Europe, with a significant reduction in the LPV200 availability over large portions of Scandinavia on that day, and a better coverage over central and southern Europe.
For the considered period of 4 months, the LPV200 service has been severely degraded on a few other days too, notably on 17 August and 3 November when the area coverage for Canada by the LPV200 service was also below 50%. As a "quick-and-dirty" method, the 120 data points can be put together into a scatter plot, with Kp on the horizontal axis and Dst on the vertical axis. The color of each data point then indicates how much of the Canadian area was covered by a 100% LPV200 service: green is more than 99%, yellow is between 95 and 99% ("mild"), orange is between 85 and 95% ("medium"), red between 50 and 85% ("strong"), and dark brown is less than 50% ("severe"). The general trend is indeed that, over Canada, with increasing Kp and decreasing Dst, the availability of GNSS services decreases. The scatter plot also suggests that there are other contributors to deteriorated GNSS services than just geomagnetic storms, as can be gauged for example from a number of "medium" disturbances of the LPV200 during geomagnetic quiet days (Kp less than 2, and Dst higher than -20 nT). However, the space of this news item did not allow for a full-fledged case-by-case investigation of each of the data points and the possible contributors such as, for example, the effects of using local geomagnetic indices instead of the planetary Kp index, the timing and duration of the geomagnetic storm, the pre-existing conditions of the geomagnetic field, magnetosphere and ionosphere, the presence of strong solar flares or solar energetic particle events,... And that's just for the space weather portion!
Space Weather Introductory Courses in 2023
The STCE Space Weather Education Center announced a new series of Space Weather Introductory Courses (SWIC) in 2023.
During a SWIC, you learn to read and interpret the STCE space weather bulletins and warnings. We touch also the possible impact of space weather in different business sectors and technologies.
Check https://www.stce.be/SWEC

Review of solar activity
Flares
Seven active regions were observed on the visible side of the solar disc, as seen from Earth. Fourteen, 14, C-class flares were reported. with the strongest being a C7.0, which peaked at 07:27 UT on November 22.
Solar Wind Disturbances
A CME was associated CME with the C7.0 flare. It was about 100 degrees wide, and was therefore not expected to arrive to Earth.
Two small, positive polarity coronal holes were observed (reaching the central meridian late on November 21 and November 23). A patchy, but extended in latitude and longitude, also positive polarity coronal hole crossed central meridian on November 27.
Energetic Particles
The greater than 10 MeV proton flux was at background level during the whole week. The greater than 2 MeV electron flux was most of the week bellow the threshold value of 1000 pfu, and only one interval with the value crossing the threshold of 1000 pfu was observed on November 28. Similarly, the 24h electron fluence was most of the time at normal level and in the last day of the week at moderate level.
Review of geomagnetic activity
During the first half of the week, the earth was inside the slow solar wind. The fast solar wind associated with the two positive polarity coronal holes (reached central meridian on November 21 and 23), reached the earth in the afternoon of November 25 and the morning of November 27, respectively.
The geomagnetic conditions were during major part of the week mostly quiet to unsettled with the one interval of active geomagnetic conditions on November 28. The unsettled to active geomagnetic conditions in the last three days of the week were due to a fast solar wind.
PROBA2 Observations (21 Nov 2022 - 27 Nov 2022)
Solar Activity
Solar flare activity fluctuated from very low to low during the week.
In order to view the activity of this week in more detail, we suggest to go to the following website from which all the daily (normal and difference) movies can be accessed: https://proba2.oma.be/ssa
This page also lists the recorded flaring events.
A weekly overview movie (SWAP week 661) can be found here: https://proba2.sidc.be/swap/data/mpg/movies/weekly_movies/weekly_movie_2022_11_21.mp4.
Details about some of this week's events can be found further below.
If any of the linked movies are unavailable they can be found in the P2SC movie repository here: https://proba2.oma.be/swap/data/mpg/movies/.
Wednesday Nov 23
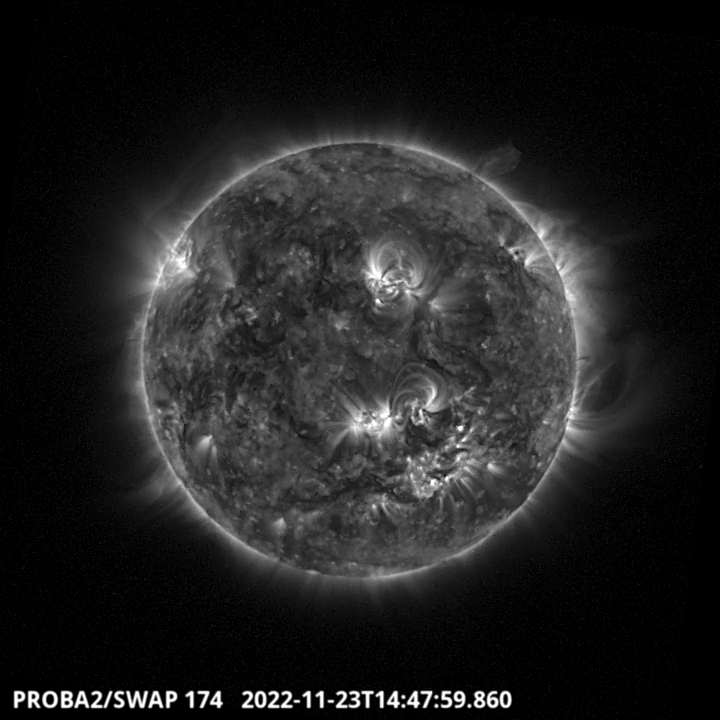

No major flares were recorded this week, so the solar activity was dominated by filament/prominence eruptions. The SWAP images above show observations just before (top panel) and during (bottom panel) one of the largest filament eruptions of this week, occurring on 2022-Nov-23 at the north-western limb of the Sun.
Find a SWAP movie of the event here: https://proba2.sidc.be/swap/movies/20221123_swap_movie.mp4.
The International Sunspot Number by SILSO
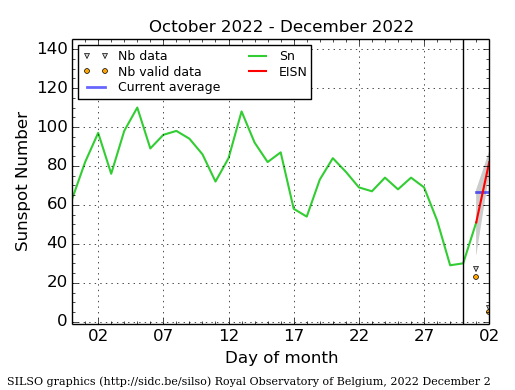
The daily Estimated International Sunspot Number (EISN, red curve with shaded error) derived by a simplified method from real-time data from the worldwide SILSO network. It extends the official Sunspot Number from the full processing of the preceding month (green line), a few days more than one solar rotation. The horizontal blue line shows the current monthly average. The yellow dots give the number of stations that provided valid data. Valid data are used to calculate the EISN. The triangle gives the number of stations providing data.
Geomagnetic Observations in Belgium (21 Nov 2022 - 27 Nov 2022)

Local K-type magnetic activity index for Belgium based on data from Dourbes (DOU) and Manhay (MAB). Comparing the data from both measurement stations allows to reliably remove outliers from the magnetic data. At the same time the operational service availability is improved: whenever data from one observatory is not available, the single-station index obtained from the other can be used as a fallback system.
Both the two-station index and the single station indices are available here: http://ionosphere.meteo.be/geomagnetism/K_BEL/
What to do and where to go
Check out our activity calendar: activities and encounters with the Sun-Space-Earth system and Space Weather as the main theme. We provide occasions to get submerged in our world through educational, informative and instructive activities.
If you want your event in our calendar, contact us: stce_coordination at stce.be
* November 21-23, Space Weather Introductory Course - onsite, by the STCE, Brussels, Belgium - fully booked
* November 27, Dag van de Wetenschap, Planetarium, Belgium
* December 1, Seminar: Total Ozone, UV and radiosonde measurements at Princess Elisabeth Station, Antarctica; onsite and online, RMI
* December 5, 6, 8, 9, Space Weather Introductory Course - online, by the STCE, zoom - fully booked
* December 8, Seminar: Citizen weather reports at RMIB and their use for radar-based hail detection verification, onsite and online, RMI
* December 16, Seminar: Tipping of the Atlantic Ocean Circulation, onsite and online, RMI
* December 16, Seminar: Opportunities of Wikipedia and related applications for science, BIRA-IASB
* December 19, school presentation ‘Noorderlicht, hemelse wetenschap en spannende verhalen’, Kortrijk-Dutsel, Belgium
* January 30, 31, February 2, 3, Space Weather Introductory Course - online, by the STCE, zoom
* March 27-29, Space Weather Introductory Course - onsite, by the STCE, Brussels, Belgium
* May 22-24, Space Weather Introductory Course - onsite, by the STCE, Brussels, Belgium
Check: https://www.stce.be/calendar