- Table of Content
- 1.A stunning fil...
- 2.PITHIA-NRF 4th...
- 3.Review of sola...
- 4.Review of geom...
- 5.Noticeable Sol...
- 6.PROBA2 Observa...
- 7.The Internatio...
- 8.Geomagnetic Ob...
- 9.The SIDC Space...
- 10.Review of iono...
- 11.Where to go an...
2. PITHIA-NRF 4th Trans-National Access Call
3. Review of solar activity
4. Review of geomagnetic activity
5. Noticeable Solar Events (16 Jan 2023 - 22 Jan 2023)
6. PROBA2 Observations (16 Jan 2023 - 22 Jan 2023)
7. The International Sunspot Number by SILSO
8. Geomagnetic Observations in Belgium (16 Jan 2023 - 22 Jan 2023)
9. The SIDC Space Weather Briefing
10. Review of ionospheric activity (16 Jan 2023 - 22 Jan 2023)
11. Where to go and what to do
A stunning filament eruption
Last week, solar observers simply had not enough eyes to watch all the sunspots, solar flares and associated coronal mass ejections that were visible. On top of that, also filaments and prominences joined the party. Solar filaments are clouds of charged particles ("plasma") above the solar surface squeezed between magnetic regions of opposite polarity. Being cooler and denser than the plasma underneath and their surroundings, they appear as dark lines when seen on the solar disk and as bright blobs when seen near the solar limb (then they are called "prominences"). Special filters are required to observe these features, and one such a filter is the Hydrogen-alpha (H-alpha) line in the red part of the solar spectrum.
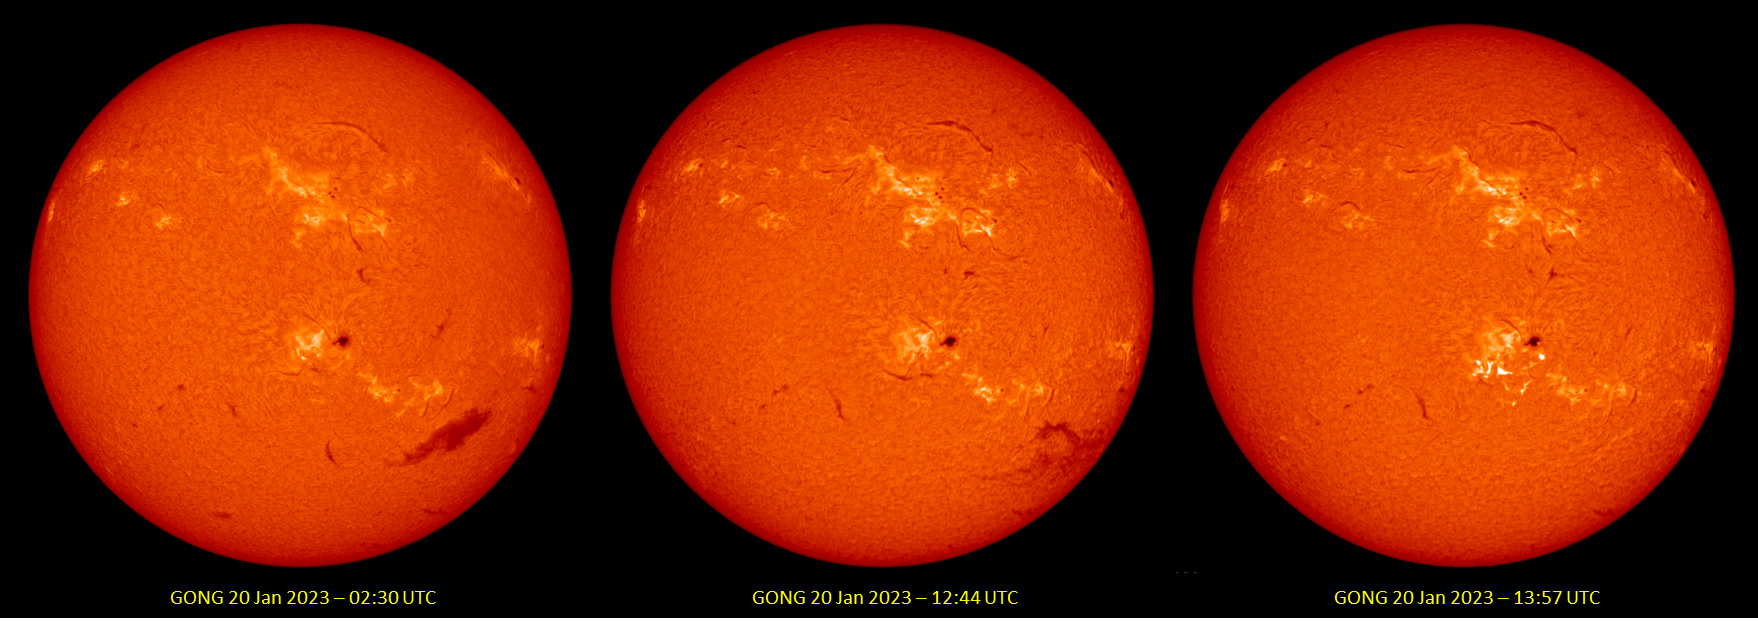
The above images show the Sun in H-alpha and were taken by the ground-based observatories of the GONG H-alpha network (Global Oscillation Network group ; https://gong.nso.edu/ ). The stills show the filament in the southwest quadrant ("lower right") early on 20 January, again shortly after noon during its eruption, and finally around 14:00 UTC when it had already been fully ejected. The filament had a length of about 30 degrees on the solar disk corresponding to around 340.000 km, a bit smaller than the average Earth-Moon distance. Clips are available in the online version of this article at https://www.stce.be/news/625/welcome.html
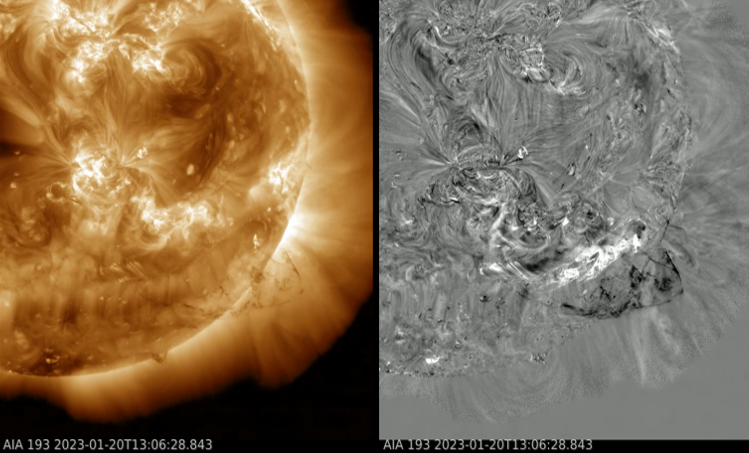
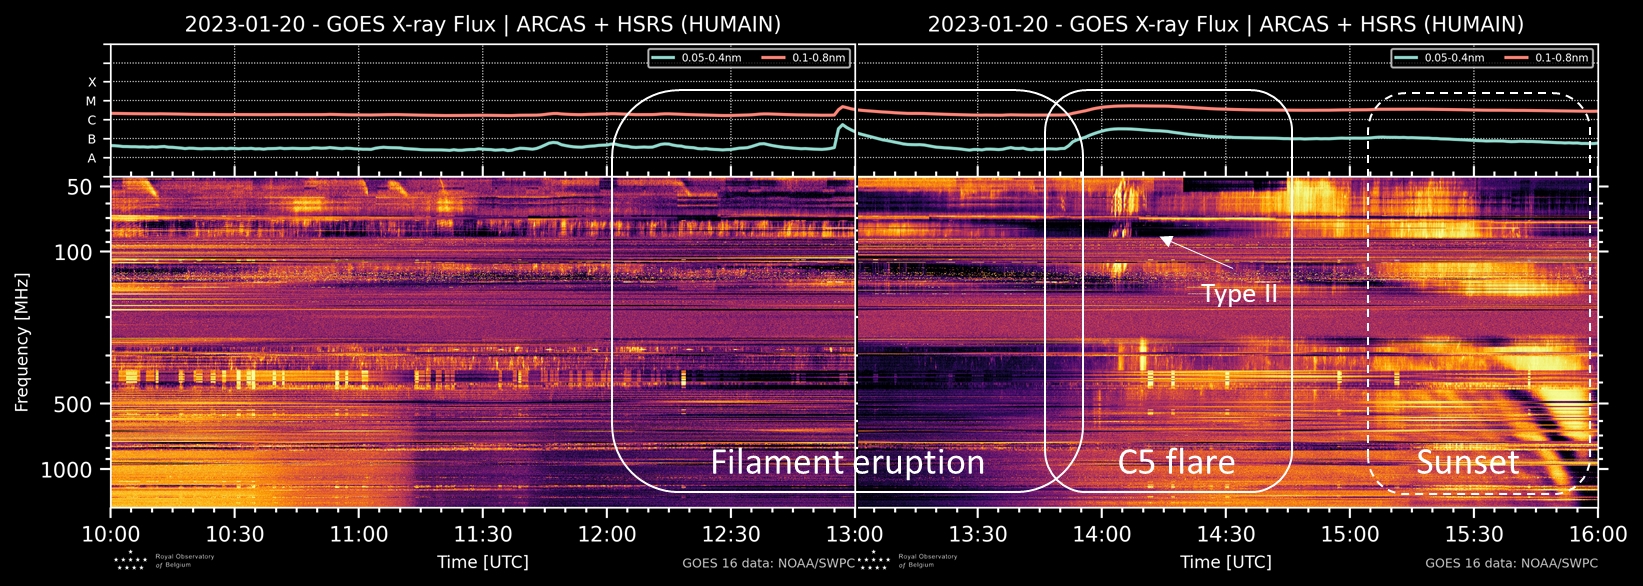
The eruption was not associated with an obvious flare in soft x-ray. GOES (https://www.swpc.noaa.gov/products/goes-x-ray-flux ) did observe 2 flares around the time of the filament eruption: a C4 flare peaking at 12:57 UTC, and a C5 flare peaking at 14:07 UTC. However, both flares were related to eruptive activity in NOAA 3190, the largest sunspot group visible on the Sun. As it happens, the C5 flare was associated with a filament eruption to the southeast of NOAA 3190's main spot. That eruption was accompanied by a strong coronal dimming, as is evident in the SDO/AIA 193 base difference clip (https://sdo.gsfc.nasa.gov/data/aiahmi/ ) in which the first image (10:36 UTC) is subtracted in the sequence from the current image (SWHV: http://swhv.oma.be/user_manual/ ). Coronal dimming is usually associated with the occurrence of a coronal mass ejection (CME), as was also confirmed by the radio telescopes in Humain (https://www.sidc.be/humain/ah_overview ) that showed a Type II radio burst at that time (https://www.stce.be/educational/classification#radio ). This is illustrated by the annotated radio-spectrogram underneath, with on its horizontal axis the time, and the vertical axis representing decreasing frequency. The boxes correspond loosely to the effects visible in the EUV images. The features in the right box (dashed) are not solar radio emissions, but result from interferences as the Sun sets. The GOES x-ray flux is shown on top.
The AIA 193 images shows that the eruption of the large filament was associated with some scattered coronal dimming (SDO/AIA 193 above right), but the radiospectrogram indicates there were no particular radio emissions recorded during the timeframe of the filament eruption, i.e. between approximately 12:00 and 14:00 UTC. This is not an uncommon situation (see e.g. Gopalswamy 2008 - https://doi.org/10.1063/1.2982445 ), and may simply indicate that the magnetic field strength and density of the ambient medium did not allow for a shock to form.
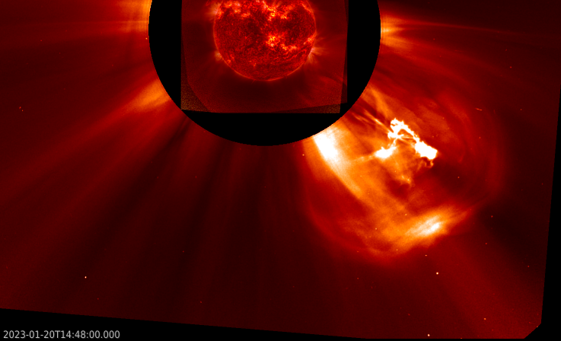
A CME was first observed in coronagraphic imagery by the SOHO/LASCO C2 instrument at 13:36 UTC (https://soho.nascom.nasa.gov/ ). It had a plane-of-the-sky speed of 512 km/s and a width of 96 degrees (CACTus - https://www.sidc.be/cactus/ ), and was directed towards the southwest. It was followed by a fainter and slower CME directed mostly towards the south, and which was associated with the C5 flare. The clip below shows GOES/SUVI (30.4 nm ; https://www.swpc.noaa.gov/products/goes-solar-ultraviolet-imager-suvi ) and PROBA2/SWAP (17.4 nm ; https://proba2.sidc.be/ssa) EUV imagery overlaid on LASCO/C2 coronagraphic imagery, running from 10:30 UTC till 17:00 UTC. A weak disturbance in the solar wind parameters (DSCOVR - https://www.swpc.noaa.gov/products/real-time-solar-wind ) was recorded from around 03:00UTC onwards on 23 January, which may be related to these CMEs delivering a glancing blow to the earth environment. Nonetheless, the jury is still out on this one, as it may as well be due to an earlier CME, or simply a transient in the solar wind.
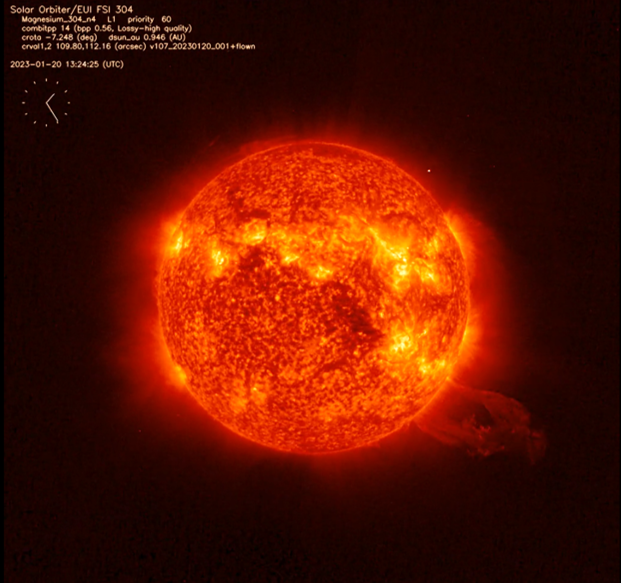
Finally, there was also extreme ultraviolet imagery (30.4 nm) of the filament eruption obtained by the Full Sun Imager (FSI) of Solar Orbiter's EUI instrument (https://www.sidc.be/EUI/intro ). On 20 January, SolO was at about the same distance from the Sun as the Earth (141.5 vs 147.2 million kilometer), trailing our planet by about 27 degrees. It thus provided a more oblique view of this specific filament eruption.
PITHIA-NRF 4th Trans-National Access Call
Plasmasphere Ionosphere Thermosphere Integrated Research Environment and Access services is a European Network of Research Facilities (PITHIA-NRF) that integrates observing facilities, data processing tools and prediction models dedicated to ionosphere, thermosphere and plasmasphere research.
PITHIA-NRF invites applications for access to a variety of research facilities for studies and modeling of physical processes acting in the Earth’s upper atmosphere, with support from experts within the field.
The call is running from 15 January 2023 until 15 June 2023. It is an Open Call and applications will be handled as they arrive to streamline the timelines of the projects.
More at https://pithia-nrf.eu/pithia-nrf-users/tna/tna-calls/fourth-tna-call.
Review of solar activity
Flares
The solar flaring activity was low to moderate with background C-class flaring and several M-class flares. There were fourteen numbered active regions on the visible disk, that produced 39 C-class flares and 7 M-class flares. The X-ray flux background was at the C level during the whole week. The largest flare over the week was a M4.9 flare, peaking at 14:31 UTC on Jan 15, associated with the active region NOAA 3190.
Solar Wind disturbances: Coronal Mass Ejections
A slow south-east coronal mass ejection (CME) related to the M-class flare from NOAA AR 3190 was detected in LASCO C2 imagery at 16:36 UT on Jan 15. The eruption was not expected to have an Earth-directed component.
A partial halo CME directed towards the south-west was seen in LASCO C2 imagery from 13:36 UTC on January 18. This was determined to be a back-sided event and no impact at Earth was expected.
A filament eruption in the southwestern quadrant was observed on Jan 20 around 12:30UTC. The associated CME was seen in SoHO/LASCO C2 coronagraph data from 12:24UTC. The ejection was directed south-west.
Another filament erupted shortly after at around 13:47UTC. It was related to a C5.3 flare from NOAA AR 3190. The associated faint CME, that appears in SoHO/LASCO C2 coronagraph data from 14:48UTC onwards, was directed to the south.
Solar Wind disturbances: Coronal Holes
An equatorial positive polarity coronal hole was transiting the central meridian at the start of the week. Furthermore, an equatorial coronal hole with positive polarity crossed the central meridian on Jan 21.
Energetic solar particles near the earth
The greater than 10 MeV proton flux was slightly elevated on Jan 20 following filament eruption and related CME activity but remained under radiation storm levels throughout the entire week. The greater than 2 MeV electron flux was below the 1000 pfu threshold throughout the entire the week. The corresponding electron fluence was at nominal levels.
Review of geomagnetic activity
Solar Wind at L1
The solar wind was slightly elevated. The magnetic field was predominantly directed away from the Sun. On Jan 17, an ICME was seen in the solar wind at L1. The total magnetic field carried by the ICME was maximum 15 nT and minimum -12 nT. The speed of the ICME was around 430 km/s.
The high speed stream from a positive coronal hole arrived in the L1 point on Jan 20. The solar wind speed followed an increasing trend, rising from 350 km/s to 540 km/s. The total interplanetary magnetic field was between 7 nT to 10 nT. The Bz ranged between -8 to 7 nT.
Geomagnetic response to the Solar Wind
On Jan 15, geomagnetic conditions were quiet to active over Belgium and reached minor storm level on the global scale.
From Jan 16 the geomagnetic conditions over Belgium were mostly quiet to unsettled.
On Jan 18, active conditions were measured in Belgium. Globally the geomagnetic conditions given by the NOAA Kp index reached active levels. This was in response to an ICME arrival.
On Jan 21, the global geomagnetic field became active, probably as response on the high speed stream.
Noticeable Solar Events (16 Jan 2023 - 22 Jan 2023)
| DAY | BEGIN | MAX | END | LOC | XRAY | OP | 10CM | TYPE | Cat | NOAA |
| 17 | 2316 | 2329 | 2344 | M1.8 | VI/2 | 48 | 3190 | |||
| 18 | 1021 | 1035 | 1052 | M1.8 | 48 | 3190 | ||||
| 19 | 0400 | 0403 | 0409 | N11E43 | M1.1 | SF | 52 | 3196 | ||
| 19 | 1006 | 1012 | 1019 | M1.7 | III/2 | 52 | 3196 | |||
| 19 | 1026 | 1027 | 1029 | N11E43 | M1.0 | SF | 52 | 3196 | ||
| 22 | 1212 | 1226 | 1234 | M1.1 | 48 | 3190 | ||||
| 22 | 1649 | 1702 | 1710 | S26W51 | M1.6 | 1B | 46 | 3194 |
| LOC: approximate heliographic location | TYPE: radio burst type |
| XRAY: X-ray flare class | Cat: Catania sunspot group number |
| OP: optical flare class | NOAA: NOAA active region number |
| 10CM: peak 10 cm radio flux |
PROBA2 Observations (16 Jan 2023 - 22 Jan 2023)
Solar Activity
Solar flare activity fluctuated from low to moderate during the week.
In order to view the activity of this week in more detail, we suggest to go to the following website from which all the daily (normal and difference) movies can be accessed: https://proba2.oma.be/ssa
This page also lists the recorded flaring events.
A weekly overview movie can be found here (SWAP week 669). https://proba2.sidc.be/swap/data/mpg/movies/weekly_movies/weekly_movie_2023_01_16.mp4
Details about some of this week's events can be found further below.
If any of the linked movies are unavailable they can be found in the P2SC movie repository here https://proba2.sidc.be/swap/data/mpg/movies/
Wednesday Jan 18
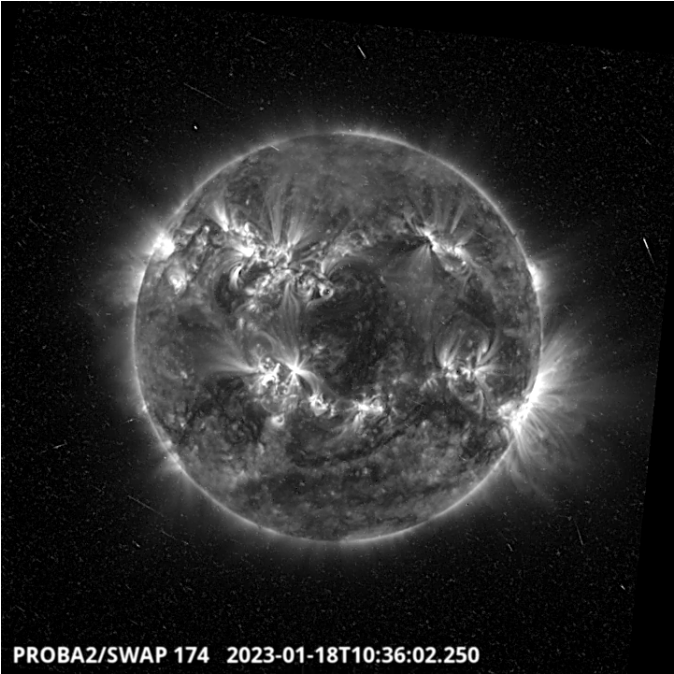
The largest flare of the week, a M1.8, has been produced around 10:36 UT by the active region
NOAA 3190 located on the South-East part of the solar disk - SWAP image
Find a movie of the events here (SWAP movie) https://proba2.sidc.be/swap/data/mpg/movies/20230118_swap_movie.mp4
Friday Jan 20
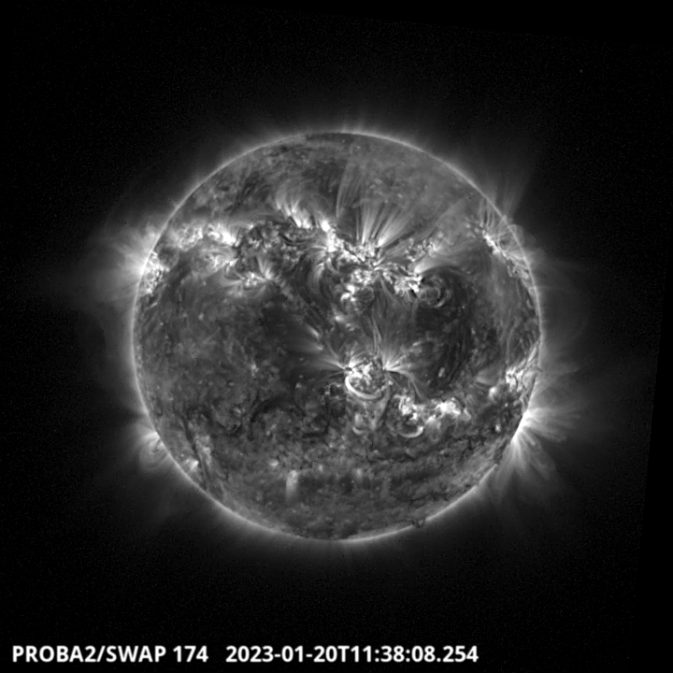
A long filament, located on the South-West part of the solar disk, erupted out into space around
11:38 UT. The eruption produced an impressive coronal mass ejection. - SWAP image
Find a movie of the events here (SWAP movie) https://proba2.sidc.be/swap/data/mpg/movies/20230120_swap_movie.mp4
The International Sunspot Number by SILSO
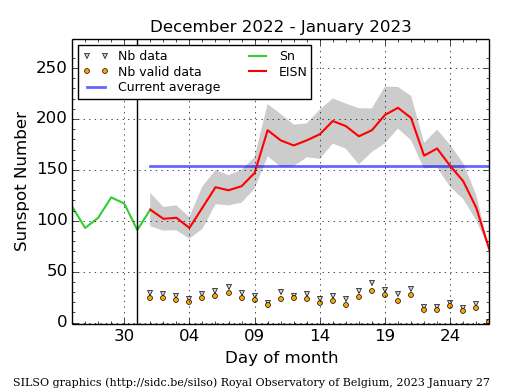
The daily Estimated International Sunspot Number (EISN, red curve with shaded error) derived by a simplified method from real-time data from the worldwide SILSO network. It extends the official Sunspot Number from the full processing of the preceding month (green line), a few days more than one solar rotation. The horizontal blue line shows the current monthly average. The yellow dots give the number of stations that provided valid data. Valid data are used to calculate the EISN. The triangle gives the number of stations providing data. When a triangle and a yellow dot coincide, it means that all the data is used to calculate the EISN of that day.
Geomagnetic Observations in Belgium (16 Jan 2023 - 22 Jan 2023)
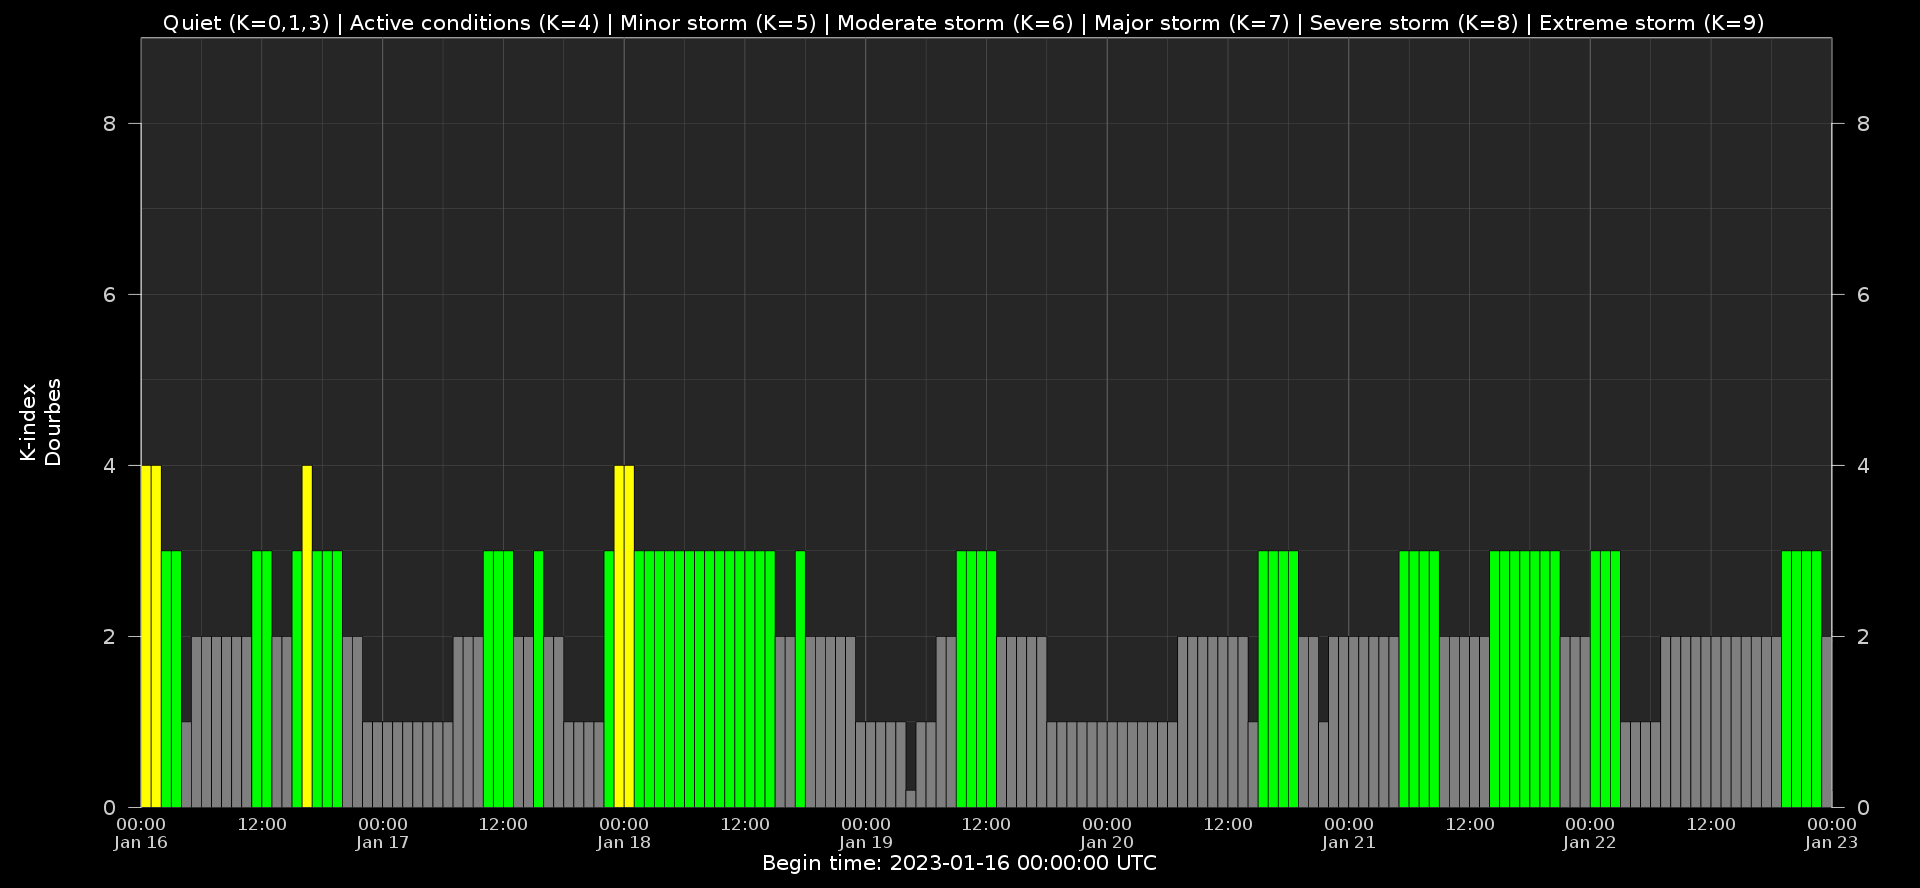
Local K-type magnetic activity index for Belgium based on data from Dourbes (DOU) and Manhay (MAB). Comparing the data from both measurement stations allows to reliably remove outliers from the magnetic data. At the same time the operational service availability is improved: whenever data from one observatory is not available, the single-station index obtained from the other can be used as a fallback system.
Both the two-station index and the single station indices are available here: http://ionosphere.meteo.be/geomagnetism/K_BEL/
The SIDC Space Weather Briefing
The Space Weather Briefing presented by the forecaster on duty from Jan 15 to 22. It reflects in images and graphs what is written in the Solar and Geomagnetic Activity report: https://www.stce.be/briefings/20230123_SWbriefing.pdf
If you need to access the movies, contact us: stce_coordination at stce.be
Review of ionospheric activity (16 Jan 2023 - 22 Jan 2023)
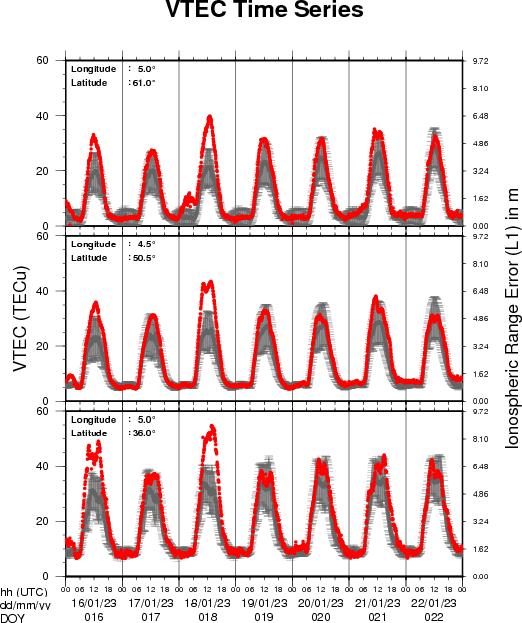
The figure shows the time evolution of the Vertical Total Electron Content (VTEC) (in red) during the last week at three locations:
a) in the northern part of Europe(N 61deg E 5deg)
b) above Brussels(N 50.5deg, E 4.5 deg)
c) in the southern part of Europe(N 36 deg, E 5deg)
This figure also shows (in grey) the normal ionospheric behaviour expected based on the median VTEC from the 15 previous days.
The VTEC is expressed in TECu (with TECu=10^16 electrons per square meter) and is directly related to the signal propagation delay due to the ionosphere (in figure: delay on GPS L1 frequency).
The Sun's radiation ionizes the Earth's upper atmosphere, the ionosphere, located from about 60km to 1000km above the Earth's surface.The ionization process in the ionosphere produces ions and free electrons. These electrons perturb the propagation of the GNSS (Global Navigation Satellite System) signals by inducing a so-called ionospheric delay.
See http://stce.be/newsletter/GNSS_final.pdf for some more explanations ; for detailed information, see http://gnss.be/ionosphere_tutorial.php
Where to go and what to do
Check out our activity calendar: activities and encounters with the Sun-Space-Earth system and Space Weather as the main theme. We provide occasions to get submerged in our world through educational, informative and instructive activities.
If you want your event in our calendar, contact us: stce_coordination at stce.be
* January 27, Seminar: Opportunities of Wikipedia and related applications for science, BIRA-IASB
* January 30, 31, February 2, 3, Space Weather Introductory Course - online, by the STCE, zoom
* January 31, CmPA Seminar: Torsional Alfvén waves can trigger turbulence in nonuniform coronal loops, Leuven, Belgium
* February 2, STCE seminar: Bursts and bombs in the solar atmosphere, Brussels, Belgium
* February 17, STCE seminar: Point spread function corrections in solar physics, Brussels, Belgium
* March 14, PITHIA-NRF High Profile Meeting, Brussels, Belgium
* March 15, PITHIA-NRF Innovation Day, Brussels, Belgium
* March 16, PITHIA-NRF Training for Partners, Brussels, Belgium
* March 17, PITHIA-NRF Workshop for Optimization of Observational Strategies, Brussels, Belgium
* March 27-29, Space Weather Introductory Course - onsite, by the STCE, Brussels, Belgium - FULL
* May 22-24, Space Weather Introductory Course - onsite, by the STCE, Brussels, Belgium - FULL
* May 29 - June 1, PITHIA-NRF Training School, Rome, Italy
Check: https://www.stce.be/calendar