- Table of Content
- 1.Nerdland
- 2.Deflection
- 3.Review of sola...
- 4.Review of geom...
- 5.Noticeable Sol...
- 6.PROBA2 Observa...
- 7.Geomagnetic Ob...
- 8.The SIDC Space...
- 9.Review of iono...
- 10.Check the cale...
2. Deflection
3. Review of solar activity
4. Review of geomagnetic activity
5. Noticeable Solar Events (6 Feb 2023 - 12 Feb 2023)
6. PROBA2 Observations (6 Feb 2023 - 12 Feb 2023)
7. Geomagnetic Observations in Belgium (6 Feb 2023 - 12 Feb 2023)
8. The SIDC Space Weather Briefing
9. Review of ionospheric activity (6 Feb 2023 - 12 Feb 2023)
10. Check the calendar
Nerdland
Nerdland has published a book: RUIMTEVAART.
To frame it: Nerdland is an organisation that brings geeks together around the theme science. They have a 3-days festival and now they published a book about space travel. Besides dinosaurs, also space sparks peoples imagination.

The book invites you to discover together with Blip facts and 'nice to know' things about astronauts, rockets and traveling to the moon and Mars.
Guess what, weather in space is also a chapter. A picture of the STCE space weather room is shown. The space weather person on duty watches the sun and sends out a space weather bulletin. Blip was able to understand parts of the space weather bulletin. Blip figured out that ‘No earth directed coronal mass ejection was seen in the available corona graphic images’ is saying ‘It’s OK, no bad things will happen’. Blip concludes that scientists says things in a complicated way.
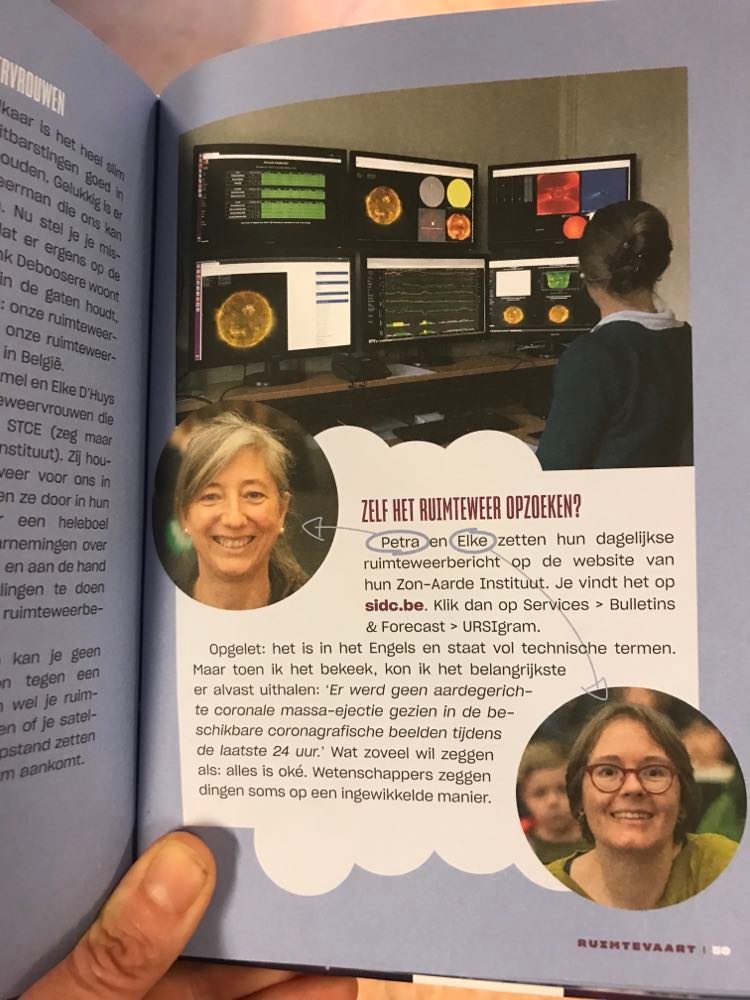
Nevertheless, it shows that more people are becoming aware of space weather. The chapter also states that, depending on your job, e.g. satellite launcher, you might want to check the weather in space.
Deflection
Images in extreme ultraviolet (EUV) taken shortly after noon on 7 February showed a spectacular eruption near the solar east limb. GOES soft x-ray flux (https://www.swpc.noaa.gov/products/goes-x-ray-flux ) started to slowly increase from 13:33 UTC onwards reaching a peak of M1.0 at 13:53 UTC and ending near 14:25 UTC. Note that the C5.5 flare peaking at 13:23 UTC is unrelated and originated from a sunspot region near the Sun's central meridian.

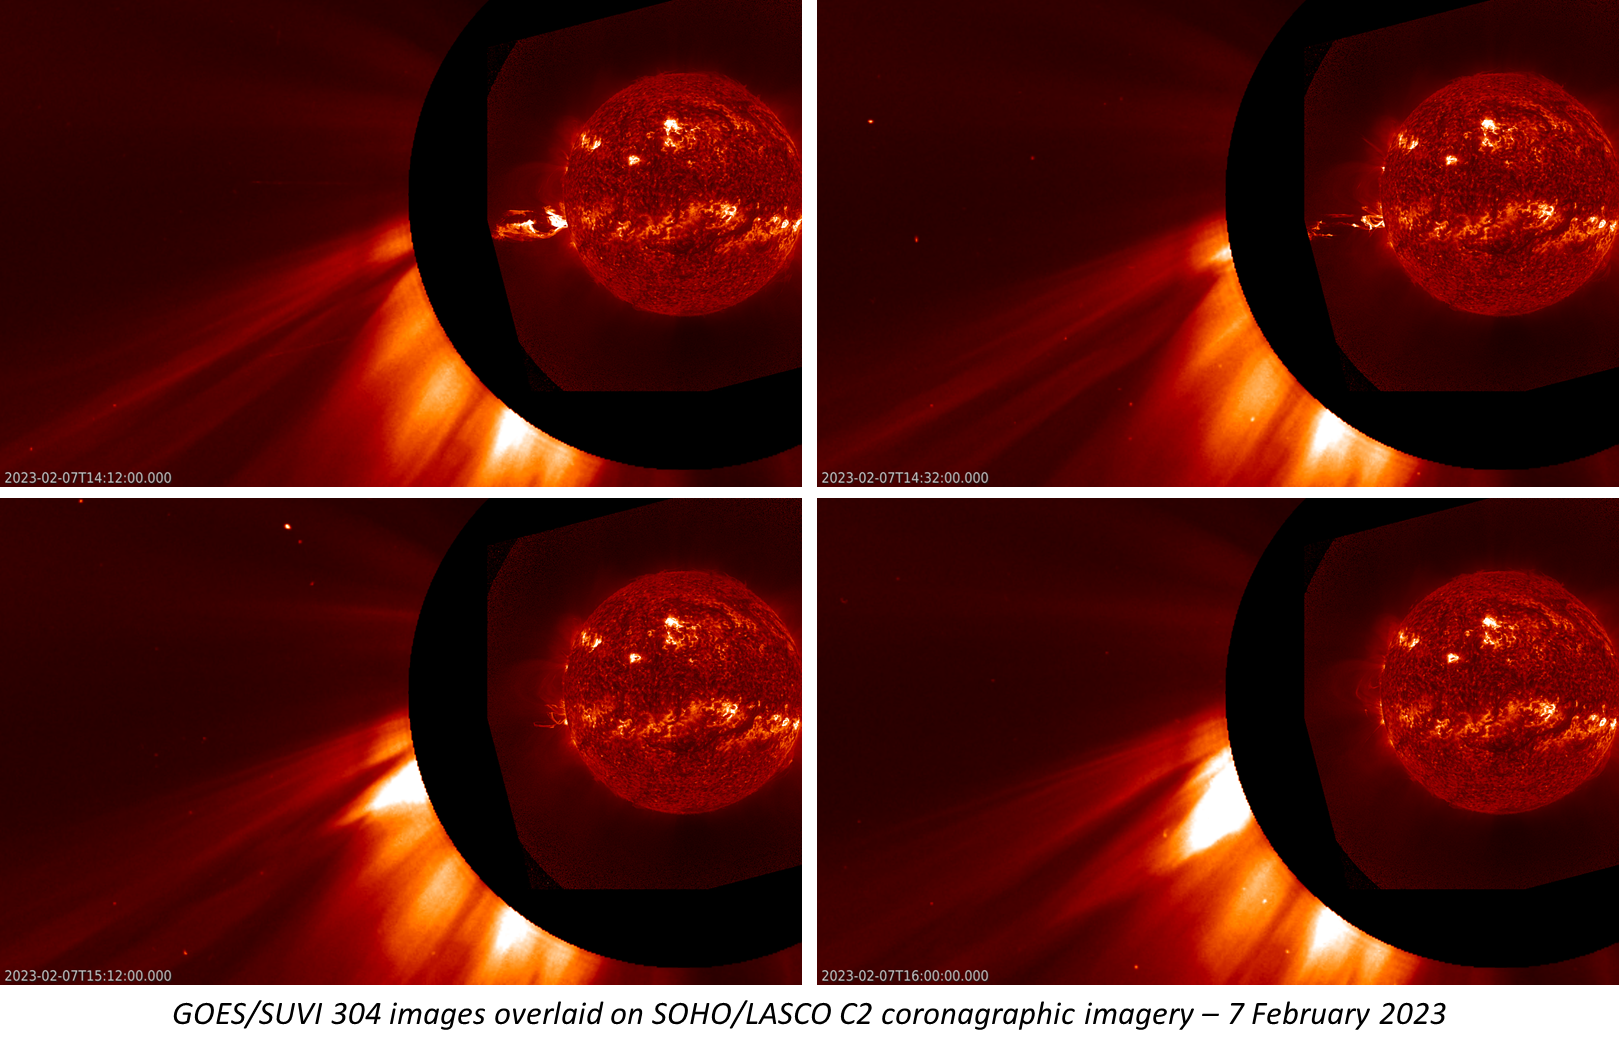
The annotated wide-field GOES/SUVI 304 image underneath (https://www.swpc.noaa.gov/products/goes-solar-ultraviolet-imager-suvi ) shows a complex eruption stretching even beyond SUVI's field-of-view to the eastern direction. A part of the ejected material is permanently expelled into space towards the east (to the left), but a portion can also be seen returning to the solar surface. Clips of the event can be found in the online version of this newsitem at https://www.stce.be/news/628/welcome.html

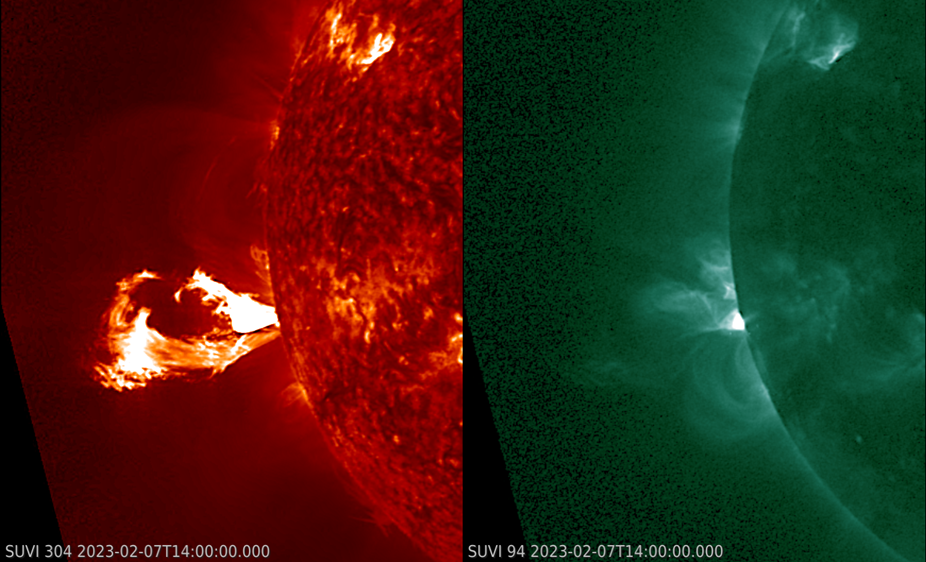
The imagery underneath show a side-by-side comparison of the event as observed by SUVI at 30.4 nm (about 80.000 degrees; left) and 9.4 nm (multi-million degrees; right), shortly after the peak in soft x-ray showing the eruption still ongoing. The source is clearly still behind the solar limb, implicating that the true intensity of the flaring event was most likely significantly higher than M1. It is thought that the source region of the event is NOAA 13217, which was also responsible for the X1.1 flare on 11 February (see this STCE newsflash at https://www.stce.be/news/627/welcome.html ).
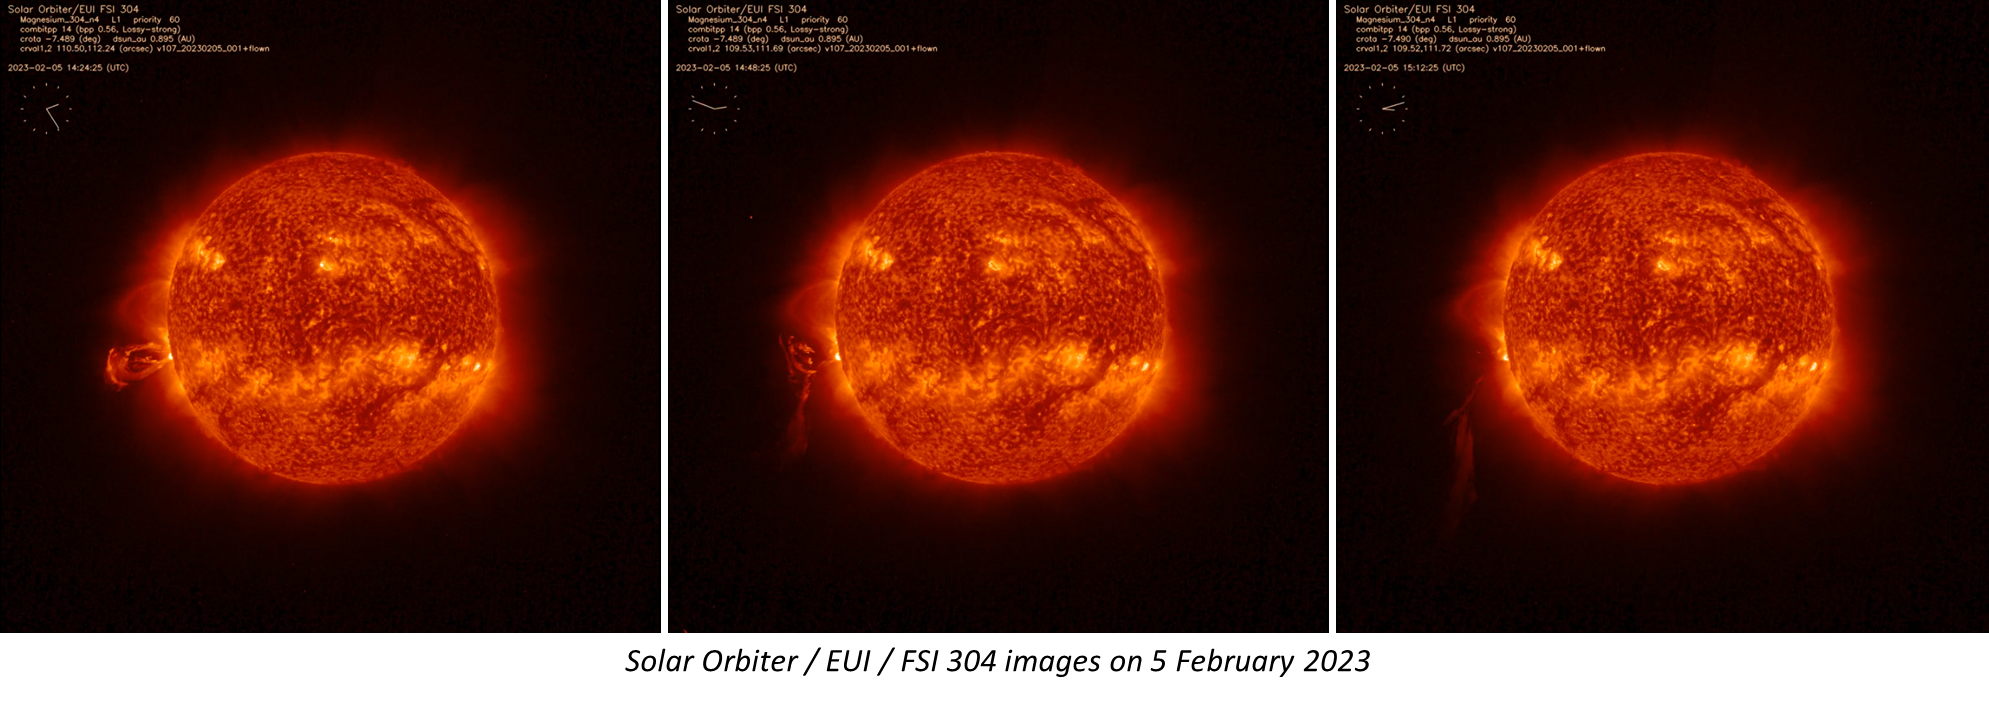
The most amazing observation pertaining to this event was that of the associated coronal mass ejection (CME), first visible in SOHO/LASCO C2 coronagraphic images at 14:32 UTC (https://soho.nascom.nasa.gov/home.html ). Remarkably, the CME was not heading to the east as the ejected material, but rather to the southeast as can be seen in the compilation underneath. A more extreme deflection of a CME produced by what was most likely the same active region, was observed just 2 days earlier on 5 February by EUI (Extreme Ultraviolet Imager - https://www.sidc.be/EUI/intro ) on board of Solar Orbiter (https://www.esa.int/Science_Exploration/Space_Science/Solar_Orbiter ). The CME started out again in the eastern direction, but then -as if hitting a (magnetic) wall- turned due south. This kind of CME deflections are not so uncommon, with for example another eyebrow-raising event reported in this STCE newsitem (https://www.stce.be/news/484/welcome.html ). CME deflections are the worst nightmare of space weather forecasters, as described e.g. in this paper (Möstl et al. 2015 https://www.nature.com/articles/ncomms8135 ). Their post-event analysis revealed that a fast "earth-directed" CME associated with an X1 flare near the solar disk centre on 7 January 2014 got deflected and eventually delivered only a glancing blow to the earth environment. Instead of the expected moderate to severe geomagnetic storm, only unsettled geomagnetic conditions were recorded.
Review of solar activity
Flares
Eighteen (18) active regions were observed on the sun as seen from the earth. NOAA AR 3213 and NOAA AR 3217 which were the sources of the majority of the flaring activity both had a beta-gamma-delta magnetic field configuration. Solar flaring activity was at moderate to high levels, with numerous C-class flares, 28 M-class flares and one X-class flare. The GOES X1.1-class flare (peaked at 15:48UT on February 11) originated from NOAA AR3217. The other active regions had simple magnetic configuration and they sourced mostly C-class flares and a few low M-class flares.
Coronal Mass Ejections
Although the majority of the reported flares had associated CMEs, none of them were Earth-directed.
Energic particles near Earth
The greater than 10 MeV proton flux was at background levels. The greater than 2 MeV electron flux stayed below the 1000 pfu threshold for most of the week. It crossed the threshold between 14:20 UT and 18:35UT on February 9 and from 00:00UT to 00:50UT
on February 10. The 24h electron fluence was at nominal levels.
Review of geomagnetic activity
Solar Wind at L1
From the late evening of February 5, the solar wind speed measured in the L1 point gradually increased. The high speed stream was linked with the negative polarity coronal hole in the northern solar hemisphere, which crossed the central meridian on February 3rd. The solar wind speed reached values of up to 600 km/s. Towards the end of the week, the solar wind speed gradually declined to 470 km/s. The magnitude of the interplanetary magnetic field (IMF) had maximum value of about 12 nT, and the Bz component of the IMF was as low as -10 nT.
Geomagnetic conditions
Active conditions were reported on multiple occasions during the week for short time intervals. Both, the K index measured by the local station at Dourbes and the NOAA Kp index, reached minor storm conditions on February 9th from 21:00UT to midnight in response to the high speed stream arrival.
Noticeable Solar Events (6 Feb 2023 - 12 Feb 2023)
| DAY | BEGIN | MAX | END | LOC | XRAY | OP | 10CM | TYPE | Cat | NOAA |
| 07 | 1333 | 1353 | 1415 | M1.0 | III/1 | |||||
| 07 | 2001 | 2007 | 2014 | N30E5 | M1.5 | 1N | 57 | 3213 | ||
| 07 | 2246 | 2258 | 2305 | M3.8 | III/1 | |||||
| 07 | 2305 | 2307 | 2309 | M6.3 | VI/2III/1 | 3213 | ||||
| 08 | 0245 | 0253 | 0257 | M2.0 | 3213 | |||||
| 08 | 1528 | 1603 | 1626 | N31W5 | M1.6 | 2N | III/2 | 3213 | ||
| 08 | 1956 | 2012 | 2046 | S9E72 | M1.5 | 1N | 3217 | |||
| 08 | 2103 | 2113 | 2121 | N30W10 | M1.7 | 1F | III/1VI/1 | 3213 | ||
| 09 | 0245 | 0310 | 0328 | S2E70 | M3.0 | 1F | 3217 | |||
| 09 | 0711 | 0717 | 0721 | S2E70 | M1.1 | SF | III/2 | 3217 | ||
| 09 | 0849 | 0907 | 0924 | M2.8 | IV/1II/1III/1 | 3217 | ||||
| 09 | 1444 | 1456 | 1505 | N30W18 | M1.5 | 1N | III/2 | 3213 | ||
| 09 | 1514 | 1525 | 1534 | S9E69 | M1.4 | SN | 3217 | |||
| 09 | 1818 | 1842 | 1902 | M1.8 | 3213 | |||||
| 10 | 0245 | 0303 | 0320 | N29W25 | M3.7 | 2N | 110 | III/3II/2IV/1 | 3213 | |
| 10 | 0802 | 0805 | 0809 | N31W27 | M1.4 | SN | 3213 | |||
| 10 | 1435 | 1455 | 1512 | N34W29 | M1.1 | 1F | III/2 | 3213 | ||
| 10 | 1529 | 1600 | 1613 | N14W62 | M1.6 | SF | 3213 | |||
| 10 | 2234 | 2241 | 2248 | S18E63 | M1.2 | 1N | 3220 | |||
| 11 | 0759 | 0808 | 0815 | N6W68 | M2.2 | 1N | 3208 | |||
| 11 | 1042 | 1058 | 1129 | S18E57 | M1.0 | 1N | 3220 | |||
| 11 | 1129 | 1134 | 1141 | M1.4 | 3222 | |||||
| 11 | 1205 | 1209 | 1215 | S11E42 | M1.5 | SF | 3217 | |||
| 11 | 1218 | 1223 | 1228 | M1.1 | 3217 | |||||
| 11 | 1228 | 1240 | 1249 | N6W71 | M1.5 | SF | 3208 | |||
| 11 | 1540 | 1548 | 1554 | S8E39 | X1.1 | 2B | III/1 | 3217 | ||
| 11 | 1711 | 1723 | 1731 | N30W76 | M1.4 | SF | 3208 | |||
| 12 | 0835 | 0848 | 0852 | S9E30 | M3.1 | 1B | 200 | 3217 | ||
| 12 | 0911 | 0927 | 0937 | M1.4 | VI/1III/1 | 3217 | ||||
| 12 | 1323 | 1334 | 1344 | M1.2 | 3222 | |||||
| 12 | 1533 | 1538 | 1601 | S9E26 | M1.0 | SN | III/2 | 3217 |
| LOC: approximate heliographic location | TYPE: radio burst type |
| XRAY: X-ray flare class | Cat: Catania sunspot group number |
| OP: optical flare class | NOAA: NOAA active region number |
| 10CM: peak 10 cm radio flux |
PROBA2 Observations (6 Feb 2023 - 12 Feb 2023)
Solar Activity
Solar flare activity fluctuated from low to high during the week.
In order to view the activity of this week in more detail, we suggest to go to the following website from which all the daily (normal and difference) movies can be accessed: https://proba2.oma.be/ssa
This page also lists the recorded flaring events.
A weekly overview movie (SWAP week 672) can be found here: https://proba2.sidc.be/swap/data/mpg/movies/weekly_movies/weekly_movie_2023_02_06.mp4.
Details about some of this week's events can be found further below.
If any of the linked movies are unavailable they can be found in the P2SC movie repository here: https://proba2.oma.be/swap/data/mpg/movies/.
Saturday February 11
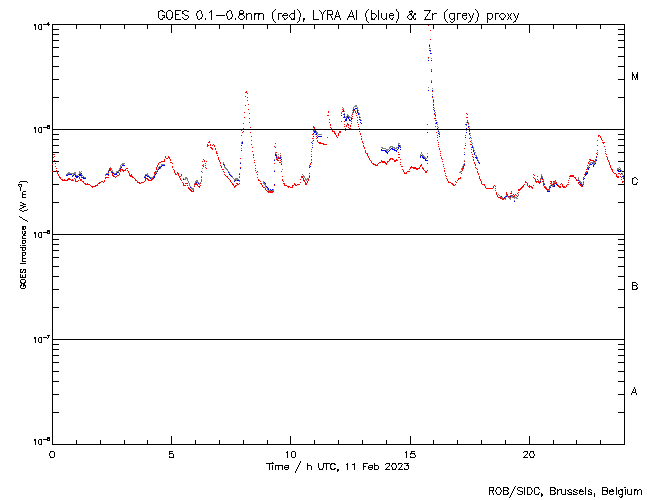

The largest flare of the week, an X1.1 flare, was observed by LYRA (top panel) and SWAP (bottom panel). The flare occurred on 2023-Feb-11 (peak at 15:48 UT) on the eastern hemisphere close to the equator, and it was associated with NOAA AR3217.
Find a SWAP movie of the event here: https://proba2.sidc.be/swap/movies/20230211_swap_movie.mp4.
Geomagnetic Observations in Belgium (6 Feb 2023 - 12 Feb 2023)
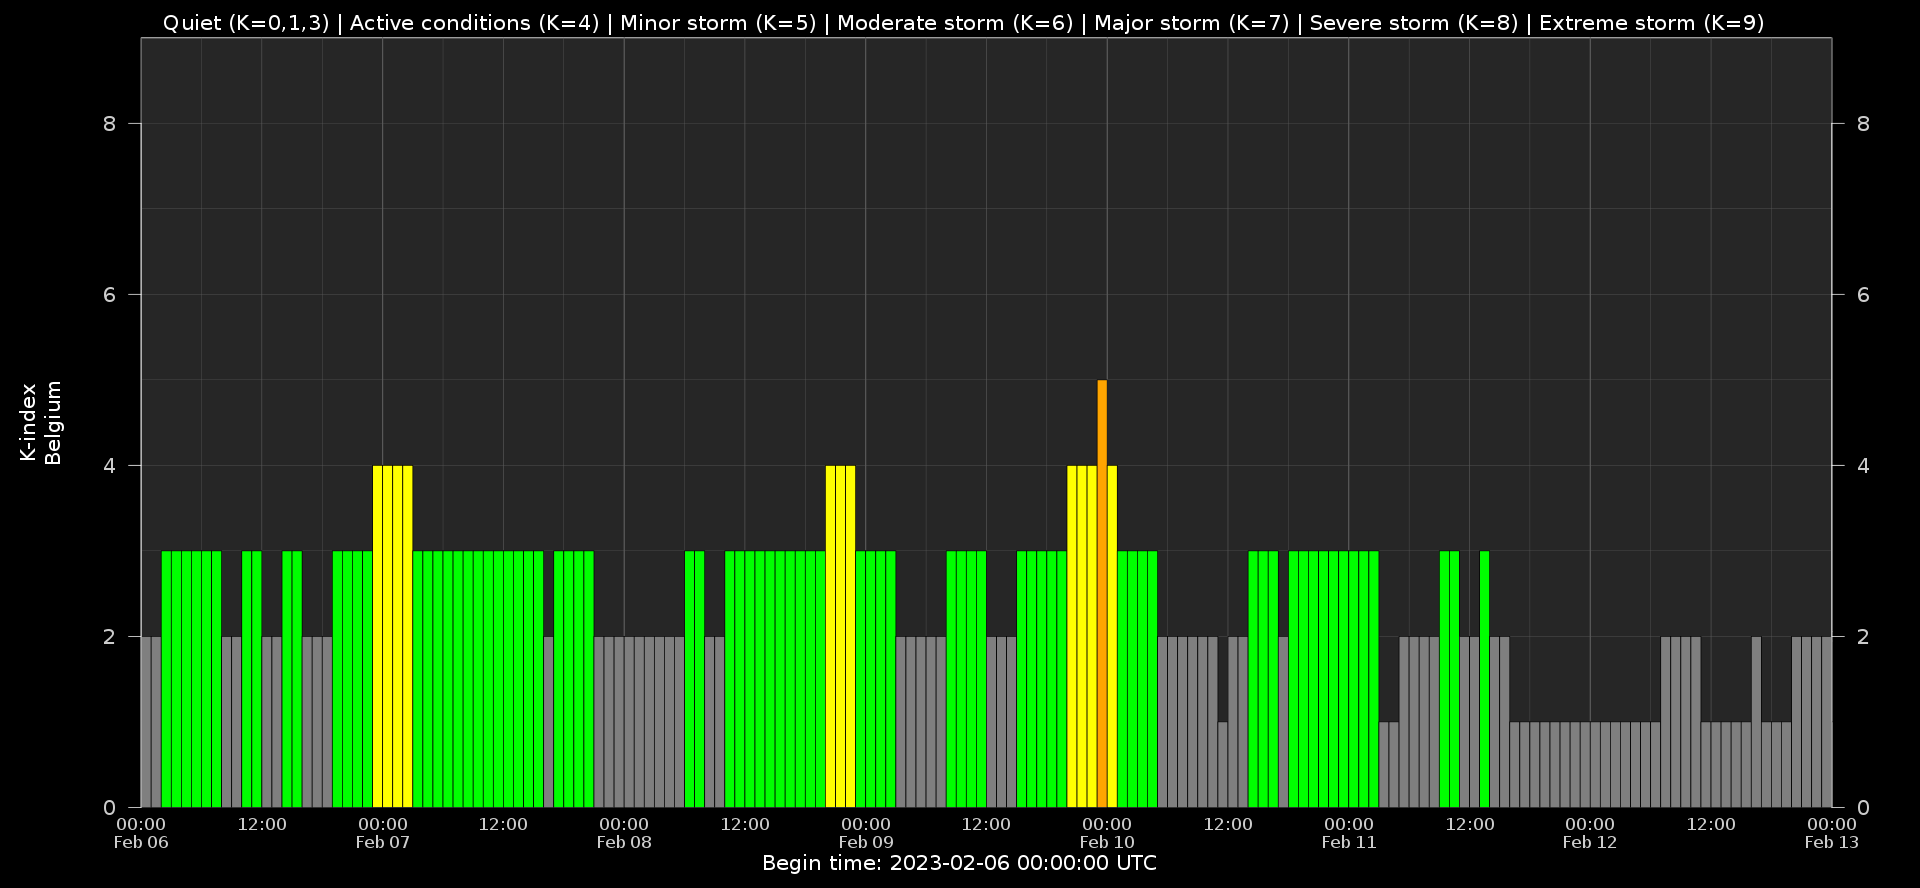
Local K-type magnetic activity index for Belgium based on data from Dourbes (DOU) and Manhay (MAB). Comparing the data from both measurement stations allows to reliably remove outliers from the magnetic data. At the same time the operational service availability is improved: whenever data from one observatory is not available, the single-station index obtained from the other can be used as a fallback system.
Both the two-station index and the single station indices are available here: http://ionosphere.meteo.be/geomagnetism/K_BEL/
The SIDC Space Weather Briefing
The Space Weather Briefing presented by the forecaster on duty from Feb 06 to 12. It reflects in images and graphs what is written in the Solar and Geomagnetic Activity report: https://www.stce.be/briefings/20230213_SWbriefing.pdf
If you need to access the movies, contact us: stce_coordination at stce.be
Review of ionospheric activity (6 Feb 2023 - 12 Feb 2023)
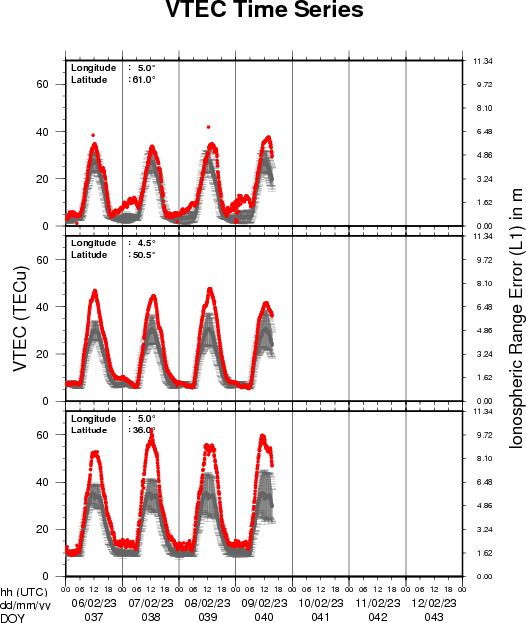
The figure shows the time evolution of the Vertical Total Electron Content (VTEC) (in red) during the last week at three locations:
a) in the northern part of Europe(N 61deg E 5deg)
b) above Brussels(N 50.5deg, E 4.5 deg)
c) in the southern part of Europe(N 36 deg, E 5deg)
This figure also shows (in grey) the normal ionospheric behaviour expected based on the median VTEC from the 15 previous days.
The VTEC is expressed in TECu (with TECu=10^16 electrons per square meter) and is directly related to the signal propagation delay due to the ionosphere (in figure: delay on GPS L1 frequency).
The Sun's radiation ionizes the Earth's upper atmosphere, the ionosphere, located from about 60km to 1000km above the Earth's surface.The ionization process in the ionosphere produces ions and free electrons. These electrons perturb the propagation of the GNSS (Global Navigation Satellite System) signals by inducing a so-called ionospheric delay.
See http://stce.be/newsletter/GNSS_final.pdf for some more explanations ; for detailed information, see http://gnss.be/ionosphere_tutorial.php
Check the calendar
Check out our activity calendar: activities and encounters with the Sun-Space-Earth system and Space Weather as the main theme. We provide occasions to get submerged in our world through educational, informative and instructive activities.
If you want your event in our calendar, contact us: stce_coordination at stce.be
* February 17, STCE seminar: Point spread function corrections in solar physics, Brussels, Belgium
* March 14, PITHIA-NRF High Profile Meeting, Brussels, Belgium
* March 15, PITHIA-NRF Innovation Day, Brussels, Belgium
* March 16, PITHIA-NRF Training for Partners, Brussels, Belgium
* March 17, PITHIA-NRF Workshop for Optimization of Observational Strategies, Brussels, Belgium
* March 27-29, Space Weather Introductory Course - onsite, by the STCE, Brussels, Belgium - FULL
* May 22-24, Space Weather Introductory Course - onsite, by the STCE, Brussels, Belgium - FULL
* May 29 - June 1, PITHIA-NRF Training School, Rome, Italy
Check: https://www.stce.be/calendar