- Table of Content
- 1.Rush to the Po...
- 2.Review of sola...
- 3.Review of geom...
- 4.PROBA2 Observa...
- 5.International ...
- 6.Noticeable Sol...
- 7.Geomagnetic Ob...
- 8.Review of iono...
- 9.The weekly spa...
- 10.Calendar
2. Review of solar activity
3. Review of geomagnetic activity
4. PROBA2 Observations (13 Mar 2023 - 19 Mar 2023)
5. International Sunspot Number by SILSO (13 Mar 2023 - 19 Mar 2023)
6. Noticeable Solar Events (13 Mar 2023 - 19 Mar 2023)
7. Geomagnetic Observations in Belgium (13 Mar 2023 - 19 Mar 2023)
8. Review of ionospheric activity (13 Mar 2023 - 19 Mar 2023)
9. The weekly space weather briefing
10. Calendar
Rush to the Poles
Each solar cycle, during the period of maximum activity, the magnetic field at the solar poles disappears and gets replaced by a magnetic field of opposite polarity. These reversals are a key feature of the solar dynamo: the physical process that generates the Sun's magnetic field necessary for the creation of sunspots and other magnetic phenomena. This switch of the polar magnetic fields does not take place overnight. Indeed, it may take even several months before they are permanently established. The old polar field is replaced by opposite polarity field from the magnetic remnants of active regions, being transported towards the poles by the Sun's magnetic conveyor belt, as tree leaves floating on a rippling creek. This is a slow process as can be seen in the figure underneath from the SolarCycleScience page (http://solarcyclescience.com/solarcycle.html ), annotated by green arrows indicating the movement from the active region belt towards the solar poles (yellow is positive polarity, blue negative). This reversal can take place at different times for the poles, and may also be of different duration. For example, during the previous solar cycle, the polar field reversal at the southern pole was completed in just a few months around mid-2013, whereas for the northern pole the reversal started around mid-2012 and was only completed late 2014 (Mierla et al. 2020 - https://link.springer.com/article/10.1007/s11207-020-01635-x ).

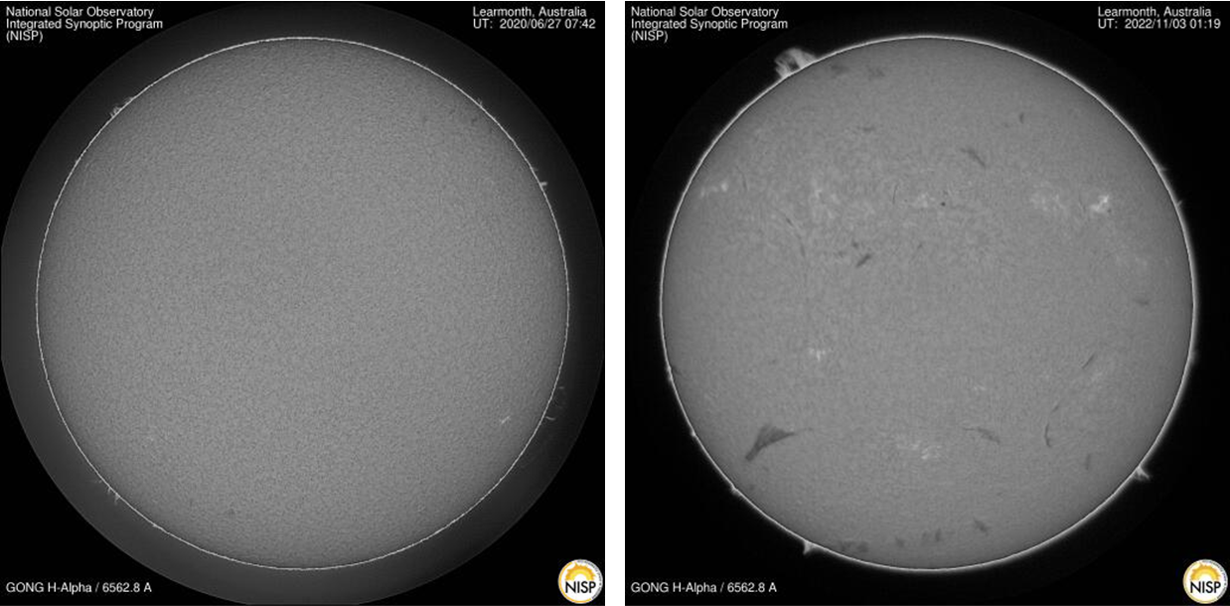
Solar filaments are clouds of charged particles ("plasma") above the solar surface squeezed between magnetic regions of opposite polarity. Being cooler and denser than the plasma underneath and their surroundings, they appear as dark lines when seen on the solar disk and as bright blobs when seen near the solar limb (then they are called "prominences"). Special filters are required to observe these features, and one such a filter is the Hydrogen-alpha line in the red part of the solar spectrum (H-alpha; 656,3 nm). Contrary to the sunspot groups which are mostly visible between solar latitudes +30 and -30 degrees, filaments and prominences can basically occur all over the surface, as long as there are opposite polarity magnetic fields which are strong enough to allow for these features. The H-alpha images underneath show filaments and prominences observed in mid-2020 (left) and late 2022 (right), as observed by the GONG network (https://gong.nso.edu/ ).
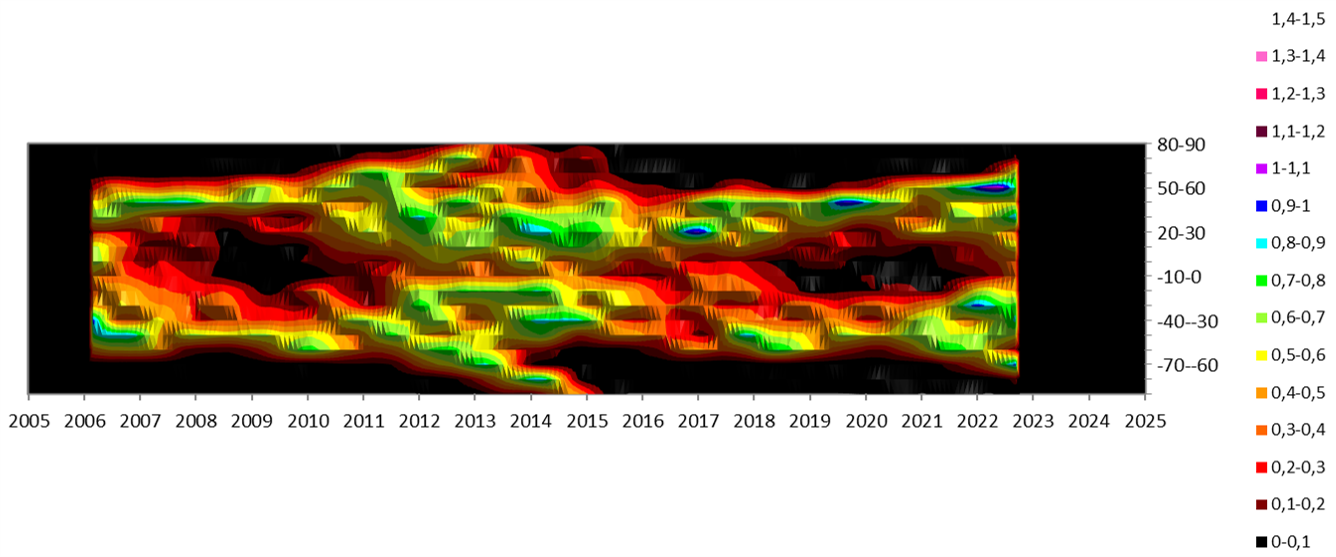
So, it is not a surprize that, aside the filaments present in the main zone between latitudes of about +50 and -50 degrees, one can also observe a movement in the filaments towards the poles during the ascending phase of the solar cycle, when the dispersed magnetic remnants of decayed active regions move poleward and interact with the existing, opposite polarity magnetic fields near the Sun's poles. This "rush-to-the-poles" is well known and also observed in e.g. coronal emissions at a wavelength of 530,3 nm (e.g. Altrock 2011 - https://ui.adsabs.harvard.edu/abs/2011SoPh..274..251A/abstract ). It can also be observed with modest H-alpha telescopes. The graph underneath was compiled from observations made with a small 4-cm H-alpha telescope starting mid-2005. It shows per latitude bin of 10 degrees (vertical axis) the smoothed monthly number of prominences (colored). The rush-to-the-poles during the previous solar cycle can easily be distinguished, and one can deduce from the most recent observations that this poleward movement is currently in progress, with prominence numbers that are a little bit higher than during the previous solar cycle (resp. blue-pink vs green-blue).
Polar crown filaments are located at the highest latitudes, thus separating the predominant polar field of the previous cycle and the dispersed field of the current cycle, drifting poleward from the trailing polarities of sunspot groups in lower latitudes. The poleward migration is an important property of polar crown filaments and a good indicator of the polarity reversal of the solar magnetic field and the occurrence of the solar maximum (Xu et al. 2021 - https://iopscience.iop.org/article/10.3847/1538-4357/abdc1e ). Currently, these polar crown filaments are still a bit chunky and not well formed. They can however become very pronounced and long, up to at least 200.000 km. Because of their length, they can -just as any other long filament- become unstable and erupt, such as e.g. in June 1999 (see the Yohkoh Science nugget at https://www.mssl.ucl.ac.uk/surf/ydac/sxt_co/990618.html ). Dynamic magnetic interactions between these filament chunks can occur at all time, as reported in this STCE newsitem https://www.stce.be/news/156/welcome.html and the related YouTube movie at https://www.youtube.com/watch?v=0mmecJ9NCfo .
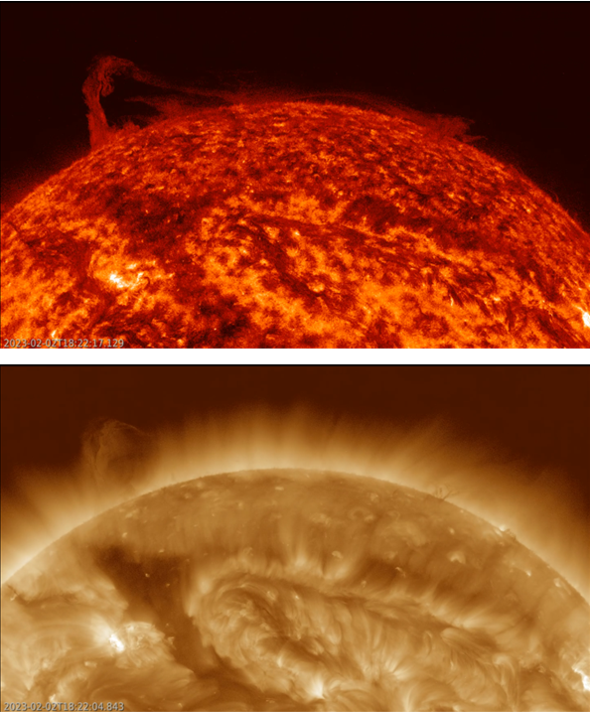
So it was a bit surprizing that media (Tamitha Skov - https://www.youtube.com/c/TamithaSkov, Space.com - https://www.space.com/vortex-sun-poles , Yahoo!News - https://ca.news.yahoo.com/massive-filament-swirls-polar-vortex-190838981.html , and many more) reported about a "solar polar vortex" that had been observed on the Sun's north pole on 2 and 3 February. The claims were based on SDO/AIA 304 imagery (http://sdo.gsfc.nasa.gov/data/aiahmi/ ; image above top), showing what apparently looked like a whirlwind flowing over the polar crown filament all around the north pole itself at astounding speeds of nearly 100 km/s. However, some caution is certainly warranted when drawing this conclusion, in particular when one examines the area at higher temperatures (SDO/AIA 193 ; image above bottom), where the "cold" plasma is now visible as dark strands against the bright and hot solar upper atmosphere. Indeed the SDO/AIA 193 movie in the online version of this newsitem (https://www.stce.be/news/636/welcome.html ) shows that the reported vortex just seems to concern interactions between the various, both nearby and faraway, portions of the polar crown filament, very much to what has been reported in the 2012 STCE newsitem above. Material seems to move from east to west as well as from west to east, the apparent "vortex" movement fortified by the waving of the rotating filament chuncks, as trees bending during a violent storm. A further critical examination was given by Dr Keith Strong from the University of Maryland, available in his YouTube video at https://www.youtube.com/watch?v=SCOyxW5vF94 Whatever may be the right interpretation, this kind of discussions will soon come to an end as Solar Orbiter (https://www.sidc.be/EUI/intro ) is gradually changing its ecliptic orbit (in the Sun-Earth plane) around the Sun to a more inclined one, thus giving solar physicists a much better view on the Sun's poles and hopefully contributing in solving the mystery of the solar dynamo and the rise and fall of the solar cycle.

Review of solar activity
Flares
Over the past week the solar flaring activity was at low levels. There were fifteen numbered active regions on the visible disk. They all had relatively simple alpha or beta magnetic field configuration and produced 23 C-class flares and 1 M-class flare. The largest flare over a week was a M1.1 flare, peaking at 15:07 UTC on March 17, associated with NOAA AR3254. The second largest flare was an impulsive C9.4 flare at 07:10 UTC on March 18, produced by NOAA active region 3256. This event was also associated with Type IV radio emission.
Solar Wind Disturbances: coronal holes
Two small equatorial coronal holes of positive polarity were visible in the week. The first one transited the central meridian on March 11 and the second one on March 16.
Solar Wind Disturbances: Coronal Mass Ejection
A filament eruption in the southeastern quadrant was observed on March 12 around 17:45UTC. The associated CME appeared in SoHO/LASCO C2 coronagraph data from 19:00UTC onwards. The CME was directed to the south and the bulk of the CME was not expected to be Earth directed. However, a glancing blow of the shock was predicted to impact Earth on March 15. Indeed, a shock in the solar wind early on March 15 could be associated to the CME.
A full halo CME was seen in LASCO C2 imagery from 03:36 UTC on March 13. This was determined to be a back-sided event and therefore not expected to arrive to Earth. However, the greater than 10 MeV proton flux levels have been elevated related to this event, reaching minor radiation storm levels.
A filament eruption occurred in the northern hemisphere near disc center at around 09:50UTC on March 13. The associated CME, that appears in SoHO/LASCO C2 coronagraph data from 10:48UTC onwards, was directed to the north-west. The bulk of this eruptions was estimated to miss Earth, but there was a chance for a glancing blow early on March 16. However, this was not observed in the in-situ solar wind data. Another filament eruption in the southwestern quadrant was observed on March 17 from around 09:20UTC. The associated CME appeared in SoHO/LASCO C2 coronagraph data from 10:23UTC onwards. The CME was directed to the south-west and the bulk of the CME was not expected to be Earth directed, but there was a chance for a glancing blow on Earth.
Energetic particles near Earth
This about proton and electron fluxes measured by GOES at geostationary orbit.
The greater than 10 MeV proton flux was at nominal levels at the start of the week and got elevated on March 13 following backsided full halo CME, crossing the 10pfu event threshold around 07:45UTC on March 13. The greater than 10 MeV proton flux has reached the maximum value of 22pfu at around 04:25UTC on March 15 and returned to near the nominal levels from around 16:00UTC on March 15.
The greater than 2 MeV electron flux was below the 1000 pfu threshold throughout the week. The 24h electron fluence was at normal levels throughout the week.
Review of geomagnetic activity
Solar wind at L1
The solar wind parameters have been indicative of slow solar wind conditions at the start of the week. The solar wind speed showed a gradually decreasing trend, from 380 km/s to values around 320 km/s. The interplanetary magnetic field was predominantly directed towards the Sun with a variable north-south component Bz ranging between 0 to 6 nT.
A high-speed stream from a positive polarity equatorial coronal hole influenced the Earth from March 14. The solar wind conditions became slightly disturbed with the total interplanetary magnetic field rising to 15 nT around 04:30UTC on March 14. The north-south component of the magnetic field was variable, ranging between -11 nT and 13 nT. The solar wind velocity followed an increasing trend, rising from 320 km/s to 410 km/s. The orientation of the magnetic field showed a switch from the negative (field towards the Sun) to the positive sector (field away from the Sun). On March 15, around 03:39UTC a shock was observed with the solar wind speed jumping from 410 km/s to 550 km/s and the total interplanetary magnetic field jumping from 8 nT to 24 nT. The shock might have been associated to the CME that left the Sun on 19:00UTC, March 12. Towards the end of the week, the solar wind speed gradually decreased to values near 420 km/s.
Geomagnetic conditions
The geomagnetic conditions were at quiet to unsettled levels at the start of the week, increasing to active on March 14 and March 16 due to the ICME and high speed steam influences with an isolated moderate storm on the planetary level (NOAA- Kp = 6-) and minor storm in Belgium (K Bel = 5) around 03:00 UTC and 21:00 UTC on March 15. Conditions then returned to quiet and unsettled for the rest of the week.
PROBA2 Observations (13 Mar 2023 - 19 Mar 2023)
Solar Activity
Solar flare activity fluctuated from very low to moderate during the week.
In order to view the activity of this week in more detail, we suggest to go to the following website from which all the daily (normal and difference) movies can be accessed: https://proba2.oma.be/ssa
This page also lists the recorded flaring events.
A weekly overview movie can be found here (SWAP week 677) http://proba2.oma.be/swap/data/mpg/movies/weekly_movies/weekly_movie_2023_03_13.mp4.
Details about some of this week’s events can be found further below.
If any of the linked movies are unavailable they can be found in the P2SC movie repository here https://proba2.oma.be/swap/data/mpg/movies/
Monday Mar 13
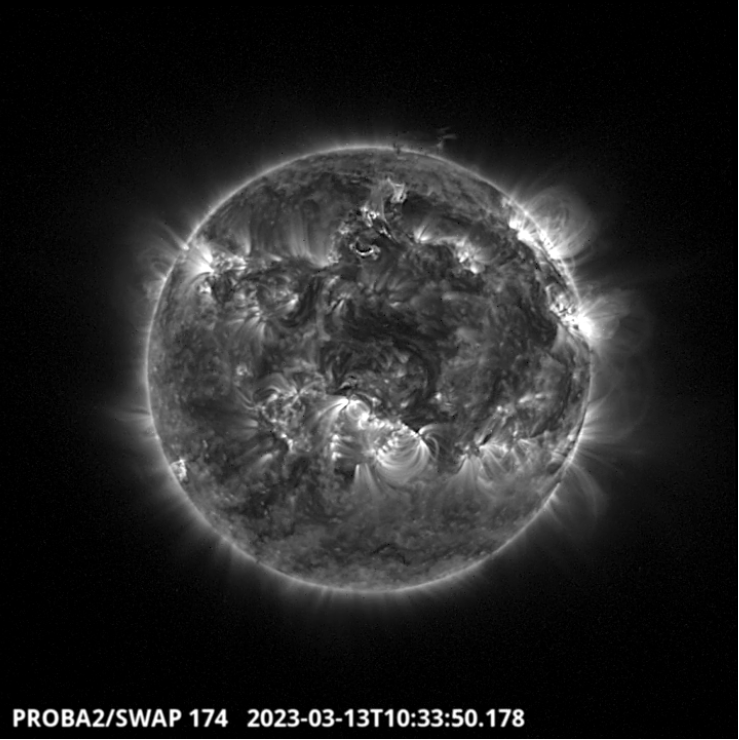
A filament eruption occurred in the northern hemisphere near disc center at around
10:33 UTC on March 13. Find a SWAP movie of the event here. https://proba2.sidc.be/swap/movies/20230313_swap_movie.mp4
Monday Mar 17
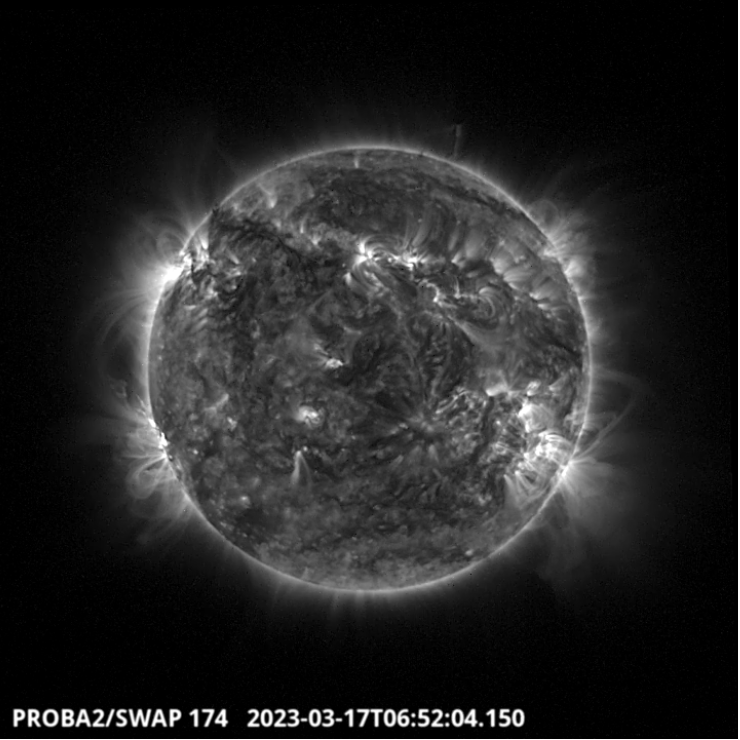
A filament eruption occurred in the southern east hemisphere around
06:52 UTC on March 17. Find a SWAP movie of the event here. https://proba2.sidc.be/swap/movies/20230317_swap_movie.mp4
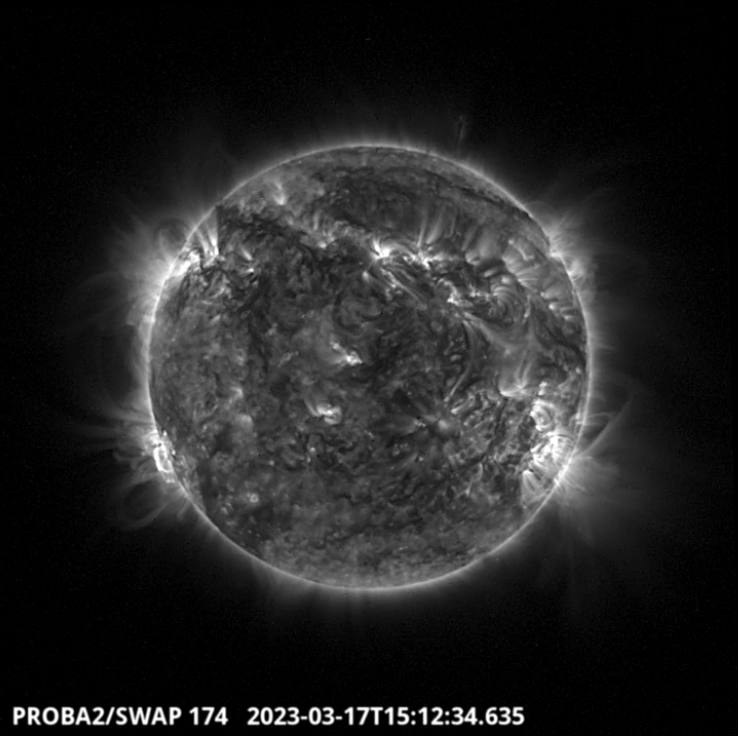
A filament eruption occurred in the southern east hemisphere around
15;12 UTC on March 17. It has been followed by a M1.0 flare erupted from the Active Region NOAA 3247. Find a SWAP movie of the event here. https://proba2.sidc.be/swap/movies/20230317_swap_movie.mp4
Monday Mar 18
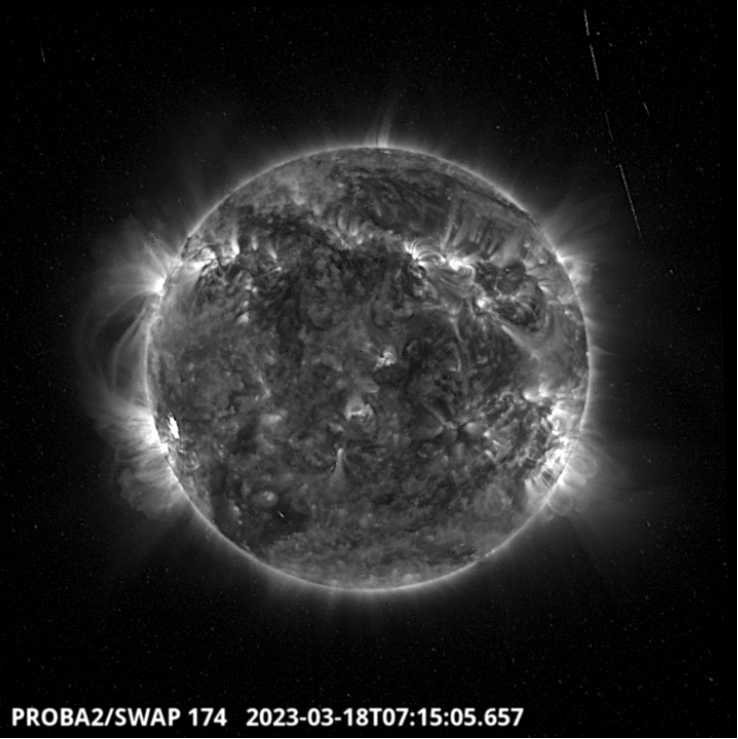
A filament eruption occurred in the southern east limb, It has been followed by a C9.4 flare erupted around 7:15 UT from the Active Region NOAA 3256. Find a SWAP movie of the event here. https://proba2.sidc.be/swap/movies/20230318_swap_movie.mp4
International Sunspot Number by SILSO (13 Mar 2023 - 19 Mar 2023)

The daily Estimated International Sunspot Number (EISN, red curve with shaded error) derived by a simplified method from real-time data from the worldwide SILSO network. It extends the official Sunspot Number from the full processing of the preceding month (green line), a few days more than one solar rotation. The horizontal blue line shows the current monthly average. The yellow dots give the number of stations that provided valid data. Valid data are used to calculate the EISN. The triangle gives the number of stations providing data. When a triangle and a yellow dot coincide, it means that all the data is used to calculate the EISN of that day.
Noticeable Solar Events (13 Mar 2023 - 19 Mar 2023)
| DAY | BEGIN | MAX | END | LOC | XRAY | OP | 10CM | TYPE | Cat | NOAA |
| 17 | 1504 | 1507 | 1511 | S22W65 | M1.0 | SN | 12 | 3247 |
| LOC: approximate heliographic location | TYPE: radio burst type |
| XRAY: X-ray flare class | Cat: Catania sunspot group number |
| OP: optical flare class | NOAA: NOAA active region number |
| 10CM: peak 10 cm radio flux |
Geomagnetic Observations in Belgium (13 Mar 2023 - 19 Mar 2023)

Local K-type magnetic activity index for Belgium based on data from Dourbes (DOU) and Manhay (MAB). Comparing the data from both measurement stations allows to reliably remove outliers from the magnetic data. At the same time the operational service availability is improved: whenever data from one observatory is not available, the single-station index obtained from the other can be used as a fallback system.
Both the two-station index and the single station indices are available here: http://ionosphere.meteo.be/geomagnetism/K_BEL/
Review of ionospheric activity (13 Mar 2023 - 19 Mar 2023)
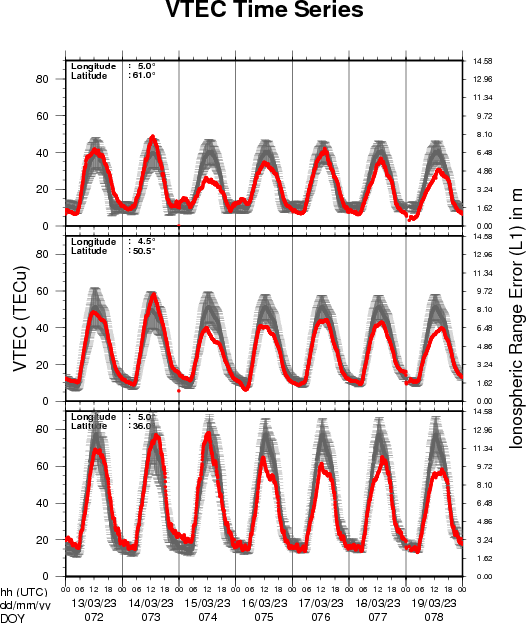
The figure shows the time evolution of the Vertical Total Electron Content (VTEC) (in red) during the last week at three locations:
a) in the northern part of Europe(N 61deg E 5deg)
b) above Brussels(N 50.5deg, E 4.5 deg)
c) in the southern part of Europe(N 36 deg, E 5deg)
This figure also shows (in grey) the normal ionospheric behaviour expected based on the median VTEC from the 15 previous days.
The VTEC is expressed in TECu (with TECu=10^16 electrons per square meter) and is directly related to the signal propagation delay due to the ionosphere (in figure: delay on GPS L1 frequency).
The Sun's radiation ionizes the Earth's upper atmosphere, the ionosphere, located from about 60km to 1000km above the Earth's surface.The ionization process in the ionosphere produces ions and free electrons. These electrons perturb the propagation of the GNSS (Global Navigation Satellite System) signals by inducing a so-called ionospheric delay.
See http://stce.be/newsletter/GNSS_final.pdf for some more explanations ; for detailed information, see http://gnss.be/ionosphere_tutorial.php
The weekly space weather briefing
The Space Weather Briefing presented by the forecaster on duty from March 12 to 19. It reflects in images and graphs what is written in the Solar and Geomagnetic Activity report: https://www.stce.be/briefings/20230320_SWbriefing.pdf
If you need to access the movies, contact us: stce_coordination at stce.be
Calendar
Check out our activity calendar: activities and encounters with the Sun-Space-Earth system and Space Weather as the main theme. We provide occasions to get submerged in our world through educational, informative and instructive activities.
If you want your event in our calendar, contact us: stce_coordination at stce.be
* March 27-29, STCE Space Weather Introductory Course, Brussels, Belgium - FULL
* March 30, RMI Seminar: Space-based lightning observations and their utility for nowcasting severe weather, conference room of the RMI, Brussels, Belgium
* April 21, BIRA-IASB seminar: High resolution modelling of atmospheric composition over Antwerp, Belgium, Nicolet@spacepole and Teams, Brussels, Belgium
* April 28, STCE seminar: Space Weather Tools in Support of Space Radiation Operations, Nicolet@spacepole and Teams, Brussels, Belgium
* May 22-24, STCE Space Weather Introductory Course, Brussels, Belgium - FULL
* May 25, STCE seminar: Comparative study of a constant-alpha force-free field and its approximations in an ideal toroid, Meridian room@spacepole and zoom, Brussels, Belgium
* May 25, RMI Seminar: Towards a new hydrometeors identification tool at the RMI, conference room of the RMI, Brussels, Belgium
* May 29 - June 1, PITHIA-NRF Training School, Rome, Italy
Check: https://www.stce.be/calendar