- Table of Content
- 1.New type of os...
- 2.Trouble near t...
- 3.PITHIA-NRF new...
- 4.Review of sola...
- 5.Review of geom...
- 6.International ...
- 7.Noticeable Sol...
- 8.Geomagnetic Ob...
- 9.The SIDC space...
- 10.Review of iono...
- 11.Interesting th...
2. Trouble near the southwest limb
3. PITHIA-NRF newsletter - the ionosphere is calling you
4. Review of solar activity
5. Review of geomagnetic activity
6. International Sunspot Number by SILSO (27 Mar 2023 - 2 Apr 2023)
7. Noticeable Solar Events
8. Geomagnetic Observations in Belgium
9. The SIDC space Weather Briefing
10. Review of ionospheric activity
11. Interesting things to attend
New type of oscillations discovered on the sun
The Extreme Ultraviolet Imager (EUI) telescope aboard the satellite Solar Orbiter was able to observe magnetic loops that shake back and forth very quickly. These vibrations are very small, but are ubiquitous and ever-present. Scientists suspect that it is these movements that heat the environment around the sun to millions of degrees Celsius. By comparison, the solar surface is only a few thousand degrees in temperature.
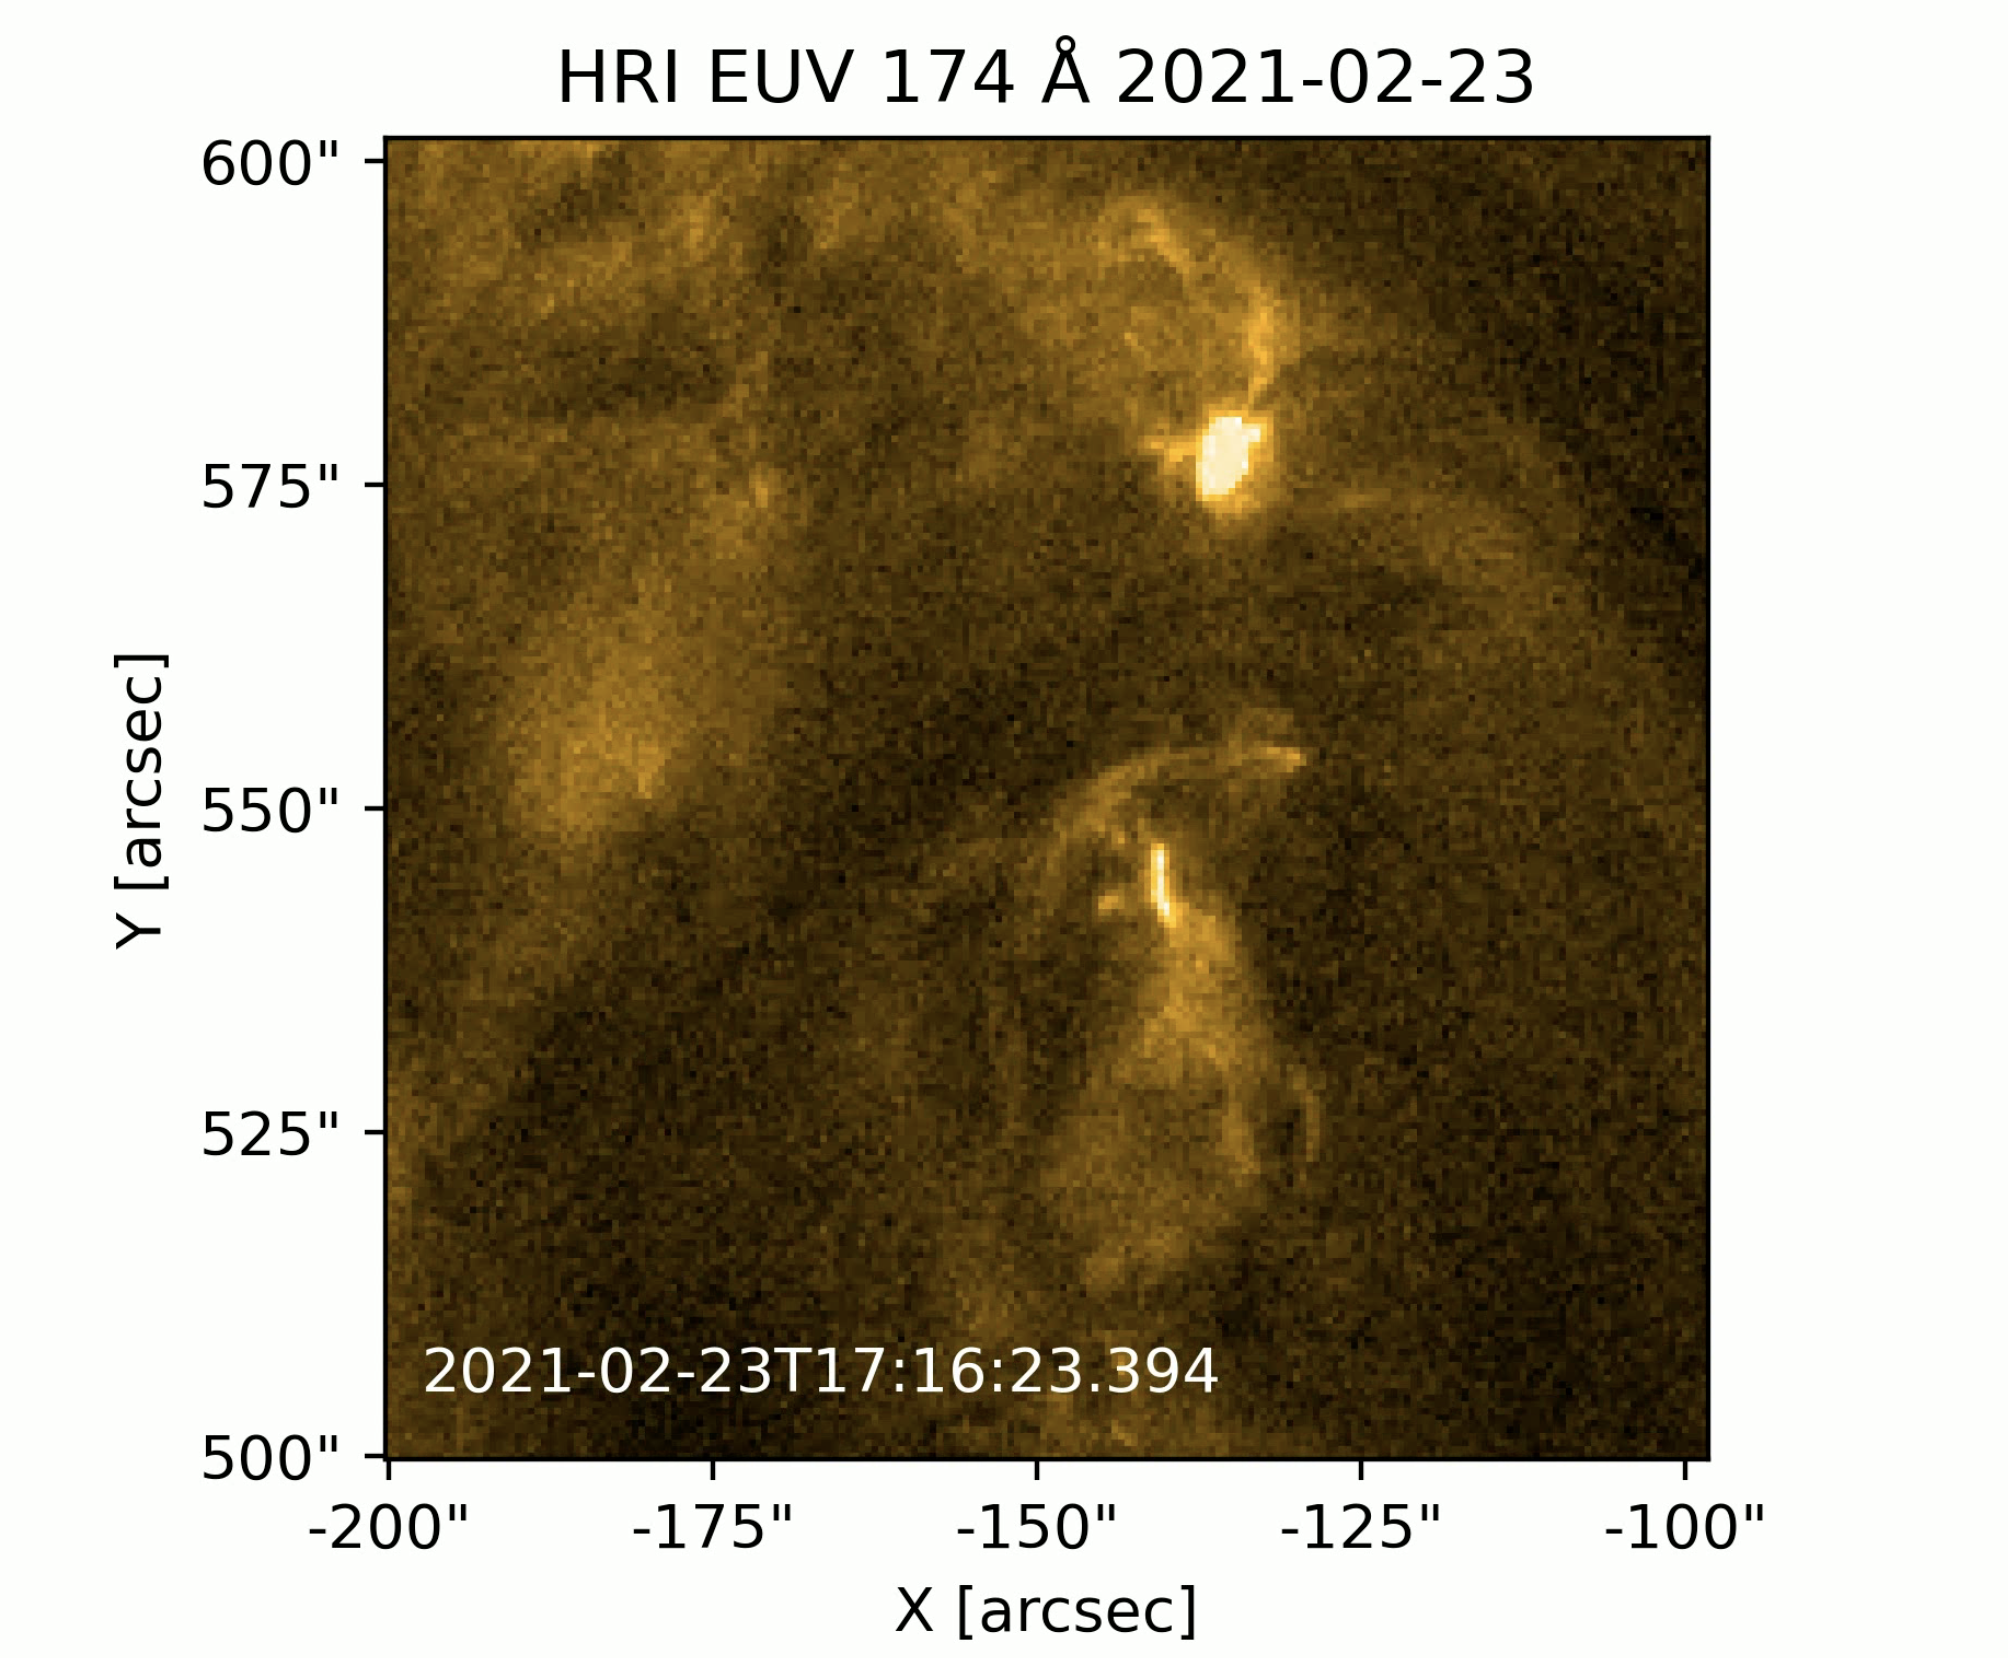
Loop oscillations observed by the EUI telescope on 23 February 2023. View the movie here: https://www.sidc.be/article/eui-detects-high-frequency-sideways-waves
The sun is dotted with magnetic loops. Now it was discovered that these loops oscillate back and forth continuously and very quickly. Some of the energy from the oscillations dissipates into the solar atmosphere, heating it. This may well explain the mystery of the solar atmosphere being much hotter than the solar surface. You would expect these vibrations to stop after a while, but as it turns out, the loops are driven continuously. Scientists suspect that the swirling solar material, from which the loops emerge, causes them to vibrate. This needs further investigation.
This discovery was only possible thanks to the EUI telescope which can take extremely sharp images in rapid succession. Other comparable solar telescopes cannot: either they are slower or the images are less sharp.
The scientific paper in which researchers from the Solar-Terrestrial Centre of Excellence and the Katholieke Universiteit Leuven describe this new discovery is published in the Astrophysical Journal: https://iopscience.iop.org/article/10.3847/1538-4357/acb26a
Get the full story: https://www.sidc.be/article/eui-detects-high-frequency-sideways-waves
Trouble near the southwest limb
While decaying, the trailing portion of active region NOAA 3256 regained some flaring potential eventually producing an X1 flare near the southwest solar limb on 29 March. The eruption was extensively discussed in this STCE newsflash at https://www.stce.be/news/637/welcome.html Flaring activity by NOAA 3256 continued with two additional M1 flares on the same day, and an M5.4 flare on 30 March. The latter flare peaked at 07:37 UTC (GOES - https://www.swpc.noaa.gov/products/goes-x-ray-flux ) and was accompanied by a brief and small enhancement of the greater than 10 MeV proton flux, reaching a modest peak of 0.6 pfu at 10:15 UTC from its typical background value near 0.25 pfu, thus remaining well below the alert threshold of 10 pfu (GOES - https://www.swpc.noaa.gov/products/goes-proton-flux ). The trailing portion of NOAA 3256 was spotless late on 31 March just before rounding the solar limb.
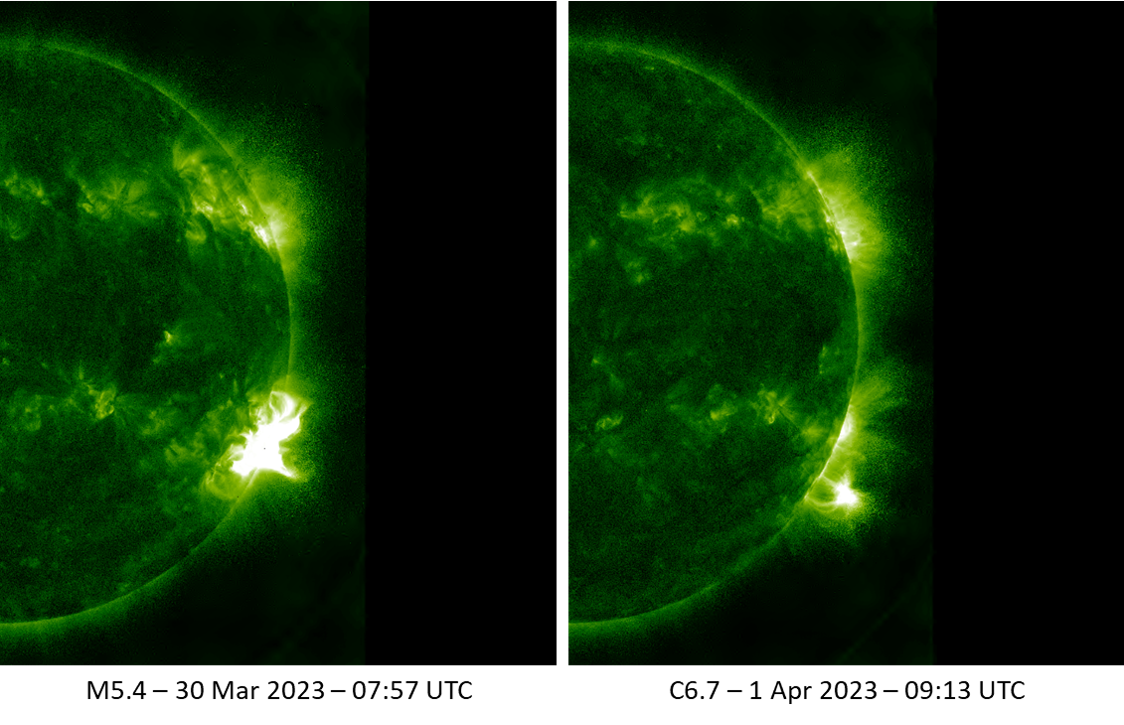
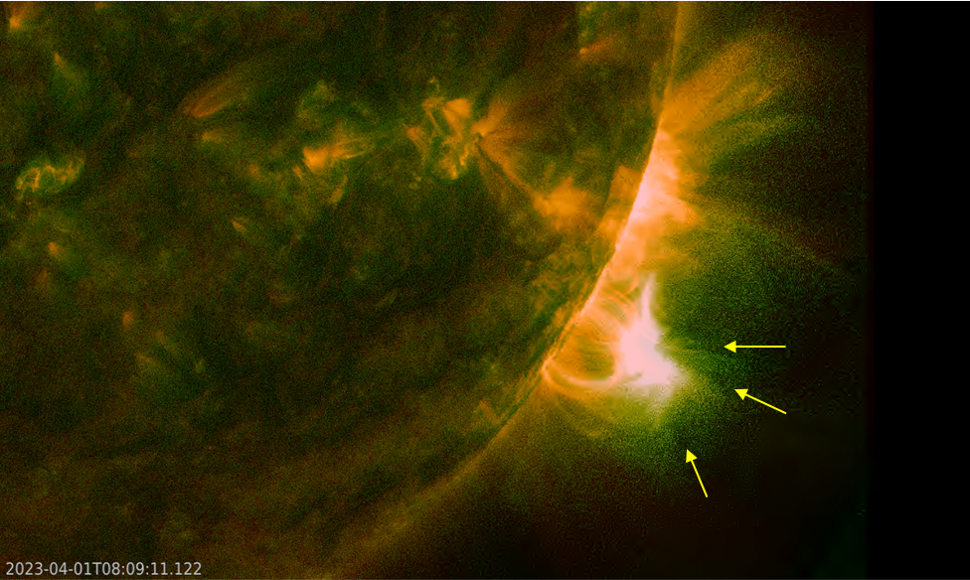
The extreme ultraviolet (EUV) imagery above (left) was made by SDO/AIA 094 (http://sdo.gsfc.nasa.gov/data/aiahmi/ ) and shows the M5 flare at 07:57 UTC, shortly after its peak in soft x-ray. The top right image is not related to this flare or active region NOAA 3256. It was taken at 09:13 UTC on 1 April, a few hours after the associated C6.7 flare peaked at 03:28 UTC. A clip of this event can be found in the online version of this newsitem at https://www.stce.be/news/639/welcome.html This was a long duration event (LDE) starting at 02:49 UTC and ending at 04:31 UTC.
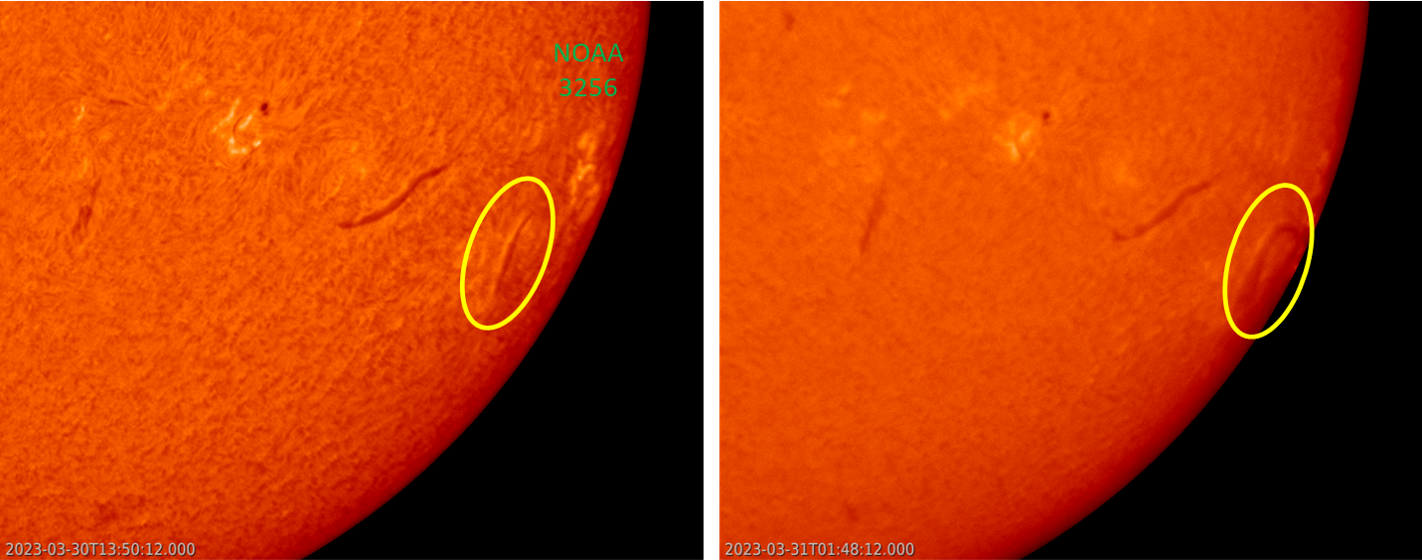
The source of this flare was the eruption of a small filament trailing NOAA 3256. This can be seen in the annotated H-alpha imagery underneath (GONG - https://gong.nso.edu/ ). Solar filaments are clouds of charged particles ("plasma") above the solar surface squeezed between magnetic regions of opposite polarity. Being cooler and denser than the plasma underneath and their surroundings, they appear as dark lines when seen on the solar disk and as bright blobs when seen near the solar limb (then they are called "prominences"). Special filters are required to observe these features, and one such a filter is the Hydrogen-alpha line in the red part of the solar spectrum (H-alpha; 656,3 nm).
Apparently, this filament became unstable early on 1 April and violently erupted. This can be seen in the imagery underneath, combining AIA171 (yellowish) with AIA131 imagery, the latter allowing a better contrast between the cold (dark purple) and hot (sky blue) areas of the eruption. It shows very well the ejection of the "dark" filament, followed by the development of a series of post-eruption coronal loops ("arcade"). Because of the location (almost at the solar limb) and the height of the filament, the event was visible in H-alpha as a prominence eruption.
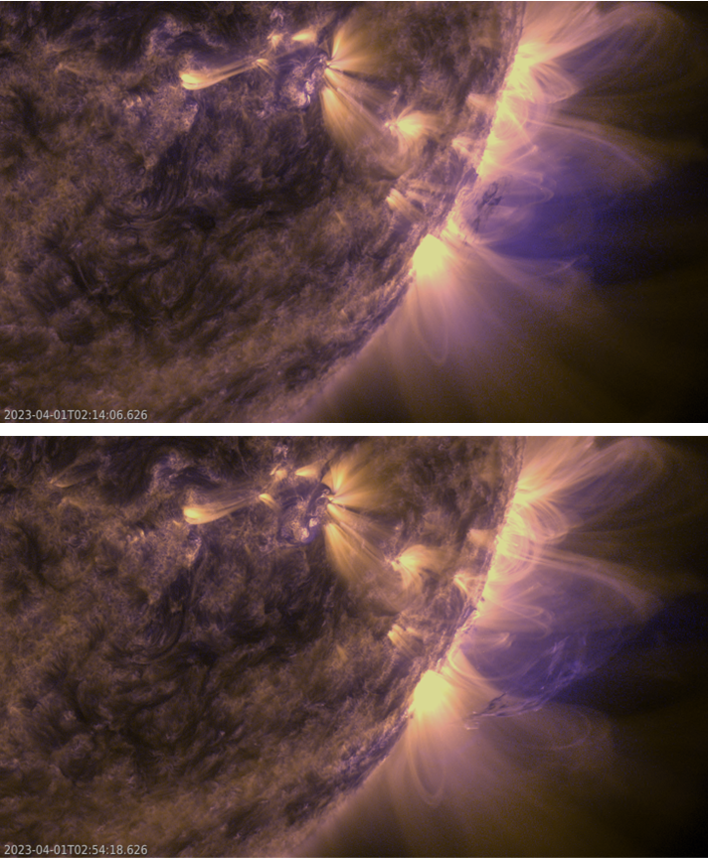
Interestingly, AIA 094 images showing the hottest parts of the flare suggest the presence of supra-arcade downflows (SAD). These features have been discussed in detail in this STCE newsitem (https://www.stce.be/news/630/welcome.html ). The annotated image underneath shows some dark downflows (AIA 094 - green) towards the top of the coronal loops (AIA 171 - red).
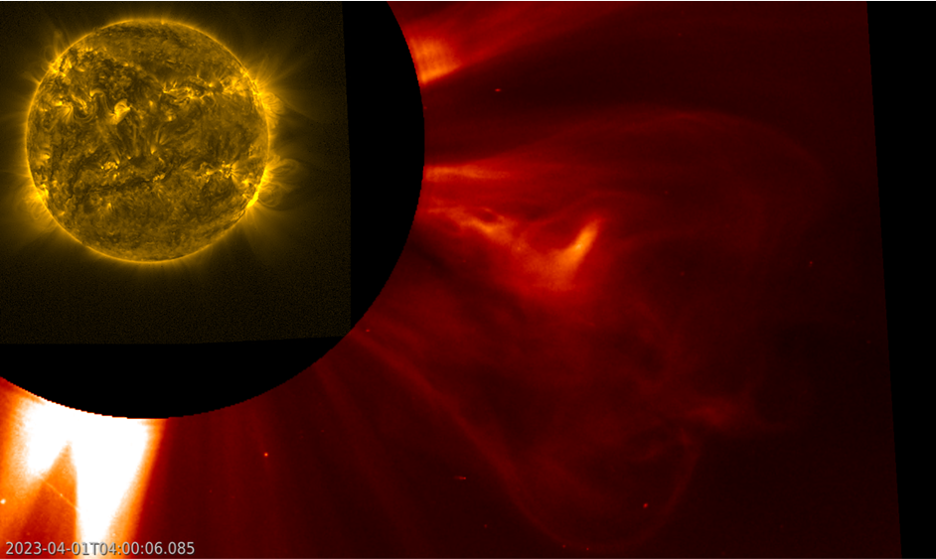
No surprize that a coronal mass ejection (CME) was associated with this eruption. The imagery underneath combines the wide-field PROBA2/SWAP EUV images (temperature near 1 million degrees ; https://proba2.sidc.be/ssa ) with the white light coronagraphic images from SOHO/LASCO C2 (https://soho.nascom.nasa.gov/ ). This CME had a plane-of-the-sky speed of around 1000 km/s but no earth-directed component.
PITHIA-NRF newsletter - the ionosphere is calling you
This is a newsletter within a newsletter, for the one for whom ionosphere, thermosphere and plasmasphere rings a bell.
We are pleased to share the advances of the PITHIA-NRF project in this third newsletter.
about the First project review meeting - A week of PITHIA-NRF project meetings - Trans-National Access: 2 years and user meeting - Outreach activities with Médecins Sans Frontières (MSF) - First release of the E-Science Centre - EGU 2023 - First PITHIA-NRF Training School ....
The Newsletter: https://www.stce.be/briefings/pithia-nrf-newsletter-issue-3.pdf
Review of solar activity
Solar flares
Thirteen (13) active regions were observed on the side of the sun facing the earth. Solar flaring activity was overall at low levels except for one X-class flare. 13 C-class flares and 3 M-class flares were reported. The GOES X1.2 flare (peaked at 02:33 UT on March 29) originated from Catania group 24 (NOAA AR 3256). This active region had a beta-gamma configuration of the photospheric magnetic field and was also the source of all observed M-class flares.
Solar wind disturbances: coronal mass ejections
The majority of the flares were associated with a Coronal Mass Ejections but none was Earth-directed. One halo CME has observed by SOHO/LASCO C2 and C3 coronagraphs. It was seen at 12:36UT on April 1 by SOHO/LASCO C2. This CME was back-sided and thus will not impact the earth.
Energetic particles
The greater than 10MeV proton flux measured by GOES in geostationary orbit was at background levels.
The greater than 2MeV electron flux measured by GOES in geostationary orbit was above and around the 1000pfu threshold from March 27 to March 30 and on April 1. On March 31 and on April 2 it stayed below the threshold. The 24-hour electron fluence was at moderate levels for most of the week.
Review of geomagnetic activity
Solar Wind at L1
From March 26 to March 29 the solar wind speed decreased from 650km/s to 450km/s. From March 30, 12:00UT, the speed increased gradually due to an equatorial, negative polarity coronal hole, which crossed the central meridian on March 29. The solar wind speed was this high until the end of the week, with a small dip around midnight, March 31-April 1. The fast solar wind ranged between 500 and 600 km/s. The total interplanetary magnetic field was between 2 and 9 nT and its North-South component (Bz) fluctuated between -6 and 5 nT. The interplanetary magnetic was dominantly negative due to the influence of the negative polarity coronal hole mentioned earlier.
Geomagnetic conditions
The geomagnetic conditions over Belgium throughout the week were mostly quiet to unsettled. Active conditions were measured locally in Belgium late on March 30 and March 31. The geomagnetic conditions given by the global NOAA Kp index reached minor storm levels from late March 30 to early March 31, in response to the high speed stream arrival.
International Sunspot Number by SILSO (27 Mar 2023 - 2 Apr 2023)
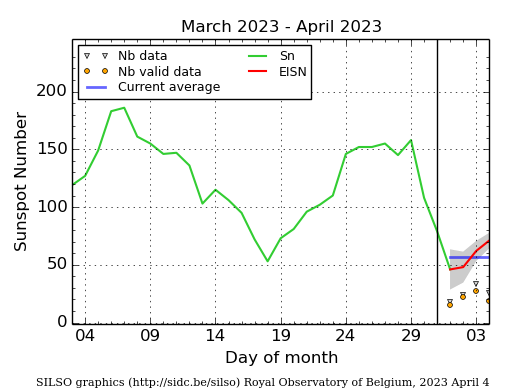
The daily Estimated International Sunspot Number (EISN, red curve with shaded error) derived by a simplified method from real-time data from the worldwide SILSO network. It extends the official Sunspot Number from the full processing of the preceding month (green line), a few days more than one solar rotation. The horizontal blue line shows the current monthly average. The yellow dots give the number of stations that provided valid data. Valid data are used to calculate the EISN. The triangle gives the number of stations providing data. When a triangle and a yellow dot coincide, it means that all the data is used to calculate the EISN of that day.
Noticeable Solar Events
| DAY | BEGIN | MAX | END | LOC | XRAY | OP | 10CM | TYPE | Cat | NOAA |
| 29 | 0218 | 0233 | 0240 | X1.2 | 140 | 24 | 3256 | |||
| 29 | 1347 | 1407 | 1415 | S25W64 | M1.2 | 1F | III/1 | 24 | 3256 | |
| 29 | 2335 | 2347 | 2358 | S23W73 | M1.1 | 1N | 24 | 3256 | ||
| 30 | 0724 | 0737 | 0743 | S22W81 | M5.4 | 1F | 120 | V/1III/2II/2IV/2 | 24 | 3256 |
| LOC: approximate heliographic location | TYPE: radio burst type |
| XRAY: X-ray flare class | Cat: Catania sunspot group number |
| OP: optical flare class | NOAA: NOAA active region number |
| 10CM: peak 10 cm radio flux |
Geomagnetic Observations in Belgium
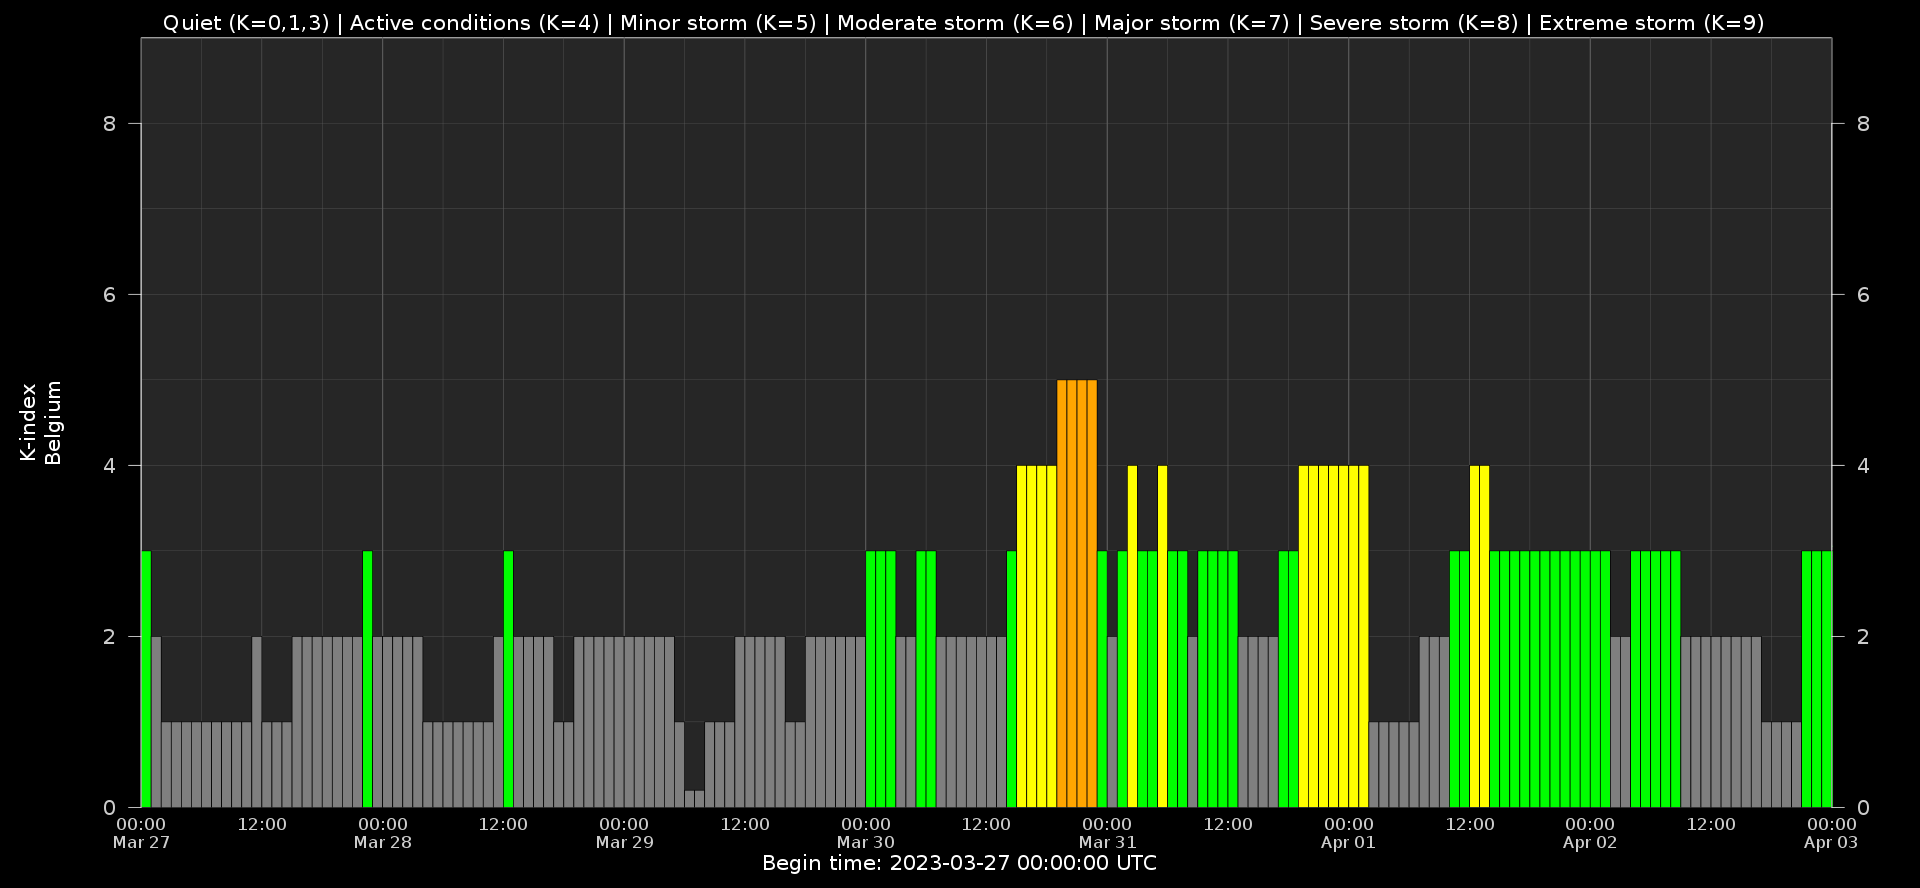
Local K-type magnetic activity index for Belgium based on data from Dourbes (DOU) and Manhay (MAB). Comparing the data from both measurement stations allows to reliably remove outliers from the magnetic data. At the same time the operational service availability is improved: whenever data from one observatory is not available, the single-station index obtained from the other can be used as a fallback system.
Both the two-station index and the single station indices are available here: http://ionosphere.meteo.be/geomagnetism/K_BEL/
The SIDC space Weather Briefing
The Space Weather Briefing presented by the forecaster on duty from March 27 to April 2. It reflects in images and graphs what is written in the Solar and Geomagnetic Activity report: https://www.stce.be/briefings/20230403_SWbriefing.pdf
If you need to access the movies, contact us: stce_coordination at stce.be
Review of ionospheric activity
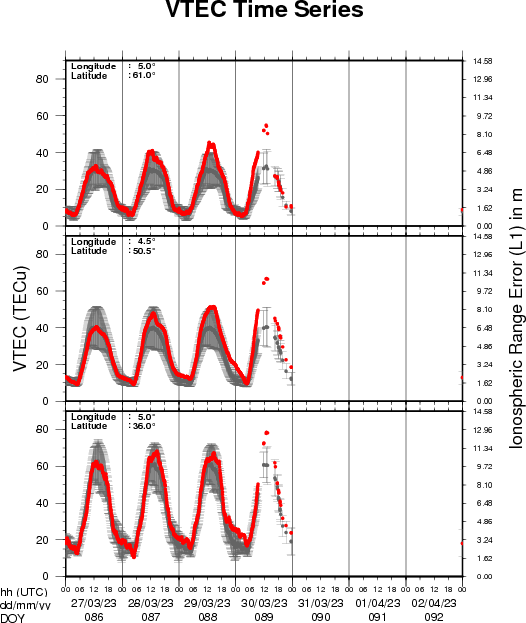
The figure shows the time evolution of the Vertical Total Electron Content (VTEC) (in red) during the last week at three locations:
a) in the northern part of Europe(N 61deg E 5deg)
b) above Brussels(N 50.5deg, E 4.5 deg)
c) in the southern part of Europe(N 36 deg, E 5deg)
This figure also shows (in grey) the normal ionospheric behaviour expected based on the median VTEC from the 15 previous days.
The VTEC is expressed in TECu (with TECu=10^16 electrons per square meter) and is directly related to the signal propagation delay due to the ionosphere (in figure: delay on GPS L1 frequency).
The Sun's radiation ionizes the Earth's upper atmosphere, the ionosphere, located from about 60km to 1000km above the Earth's surface.The ionization process in the ionosphere produces ions and free electrons. These electrons perturb the propagation of the GNSS (Global Navigation Satellite System) signals by inducing a so-called ionospheric delay.
See http://stce.be/newsletter/GNSS_final.pdf for some more explanations ; for detailed information, see http://gnss.be/ionosphere_tutorial.php
Interesting things to attend
Check out our activity calendar: activities and encounters with the Sun-Space-Earth system and Space Weather as the main theme. We provide occasions to get submerged in our world through educational, informative and instructive activities.
If you want your event in our calendar, contact us: stce_coordination at stce.be
* April 21, BIRA-IASB seminar: High resolution modelling of atmospheric composition over Antwerp, Belgium, Nicolet@spacepole and Teams, Brussels, Belgium
* April 28, STCE seminar: Space Weather Tools in Support of Space Radiation Operations, Nicolet@spacepole and Teams, Brussels, Belgium
* May 22-24, STCE Space Weather Introductory Course, Brussels, Belgium - FULL
* May 25, STCE seminar: Comparative study of a constant-alpha force-free field and its approximations in an ideal toroid, Meridian room@spacepole and zoom, Brussels, Belgium
* May 25, RMI Seminar: Towards a new hydrometeors identification tool at the RMI, conference room of the RMI, Brussels, Belgium
* May 29 - June 1, PITHIA-NRF Training School, Rome, Italy
Check: https://www.stce.be/calendar