- Table of Content
- 1.JUICE en route...
- 2.Review of sola...
- 3.Review of geom...
- 4.International ...
- 5.PROBA2 Observa...
- 6.Noticeable Sol...
- 7.Geomagnetic Ob...
- 8.Review of iono...
- 9.The SIDC Space...
- 10.Upcoming activ...
2. Review of solar activity
3. Review of geomagnetic activity
4. International Sunspot Number by SILSO
5. PROBA2 Observations
6. Noticeable Solar Events
7. Geomagnetic Observations in Belgium
8. Review of ionospheric activity
9. The SIDC Space Weather Briefing
10. Upcoming activities
JUICE en route to Jupiter!
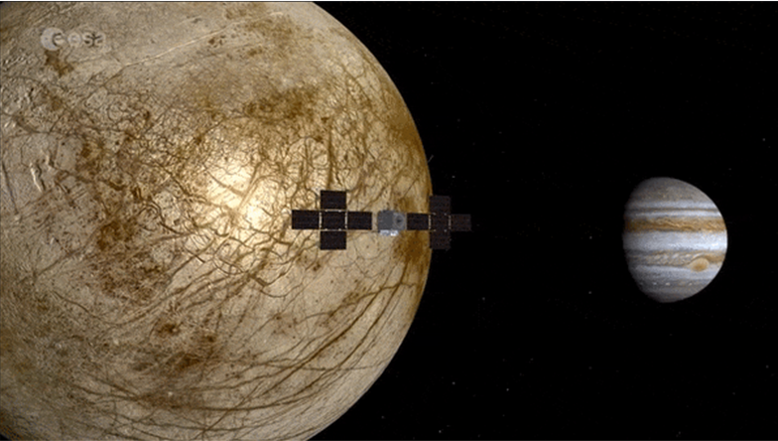
On 14 April at 12:14 UTC, ESA's Jupiter Icy Moons Explorer (JUICE - https://www.esa.int/Science_Exploration/Space_Science/Juice) was launched on an 8 years journey to Jupiter. Upon arrival in July 2031, it will study the giant gas planet and its three large ocean-bearing moons Ganymede, Callisto and Europa. Its main objectives are to explore in detail the Jovian system and to examine if habitable worlds around gas giants such a Jupiter are possible. To answer these key-questions, JUICE will carry 10 state-of-the-art instruments which will do remote sensing (from ultraviolet to sub-millimeter), geophysical (altitude, radar, and radio science) and in situ measurements (particle detector, magnetometer, and plasma waves). The Royal Observatory of Belgium (ROB - https://www.astro.oma.be/en/juice-exploring-the-icy-moons-of-jupiter/ ) and the Royal Belgian Institute for Space Aeronomy (BIRA-IASB - https://www.aeronomie.be/en/news/2023/juice-exploring-icy-moons-jupiter ) are involved in several of these instruments.
The spacecraft will perform a total of 35 fly-bys of the 3 moons in just 3 years: 12 of Ganymede, 21 of Callisto and 2 of Europa (only 2 due to the high radiation exposure). It will then be manoeuvred into an orbit around Ganymede, the largest moon of our solar system (even larger than the planet Mercury!), and the only moon to have a magnetic field of its own (Plainaki et al. 2016 - https://www.swsc-journal.org/articles/swsc/abs/2016/01/swsc150078/swsc150078.html ). This mini "magnetic bubble" sitting within Jupiter's larger one, interacting with each other in highly complex ways, will then be the focus of study for the remainder of its 4 years mission. When the spacecraft has consumed its remaining propellant, JUICE is planned to be deorbited and impact Ganymede by the end of 2035. In the artist's impression underneath (not to scale), Ganymede is shown in the foreground, Callisto to the far right, and Europa centre-right. Volcanically active moon Io is also shown, at left. The moons were imaged by NASA's Galileo spacecraft; Jupiter is seen here with a vivid aurora, captured by the NASA/ESA Hubble Space Telescope.
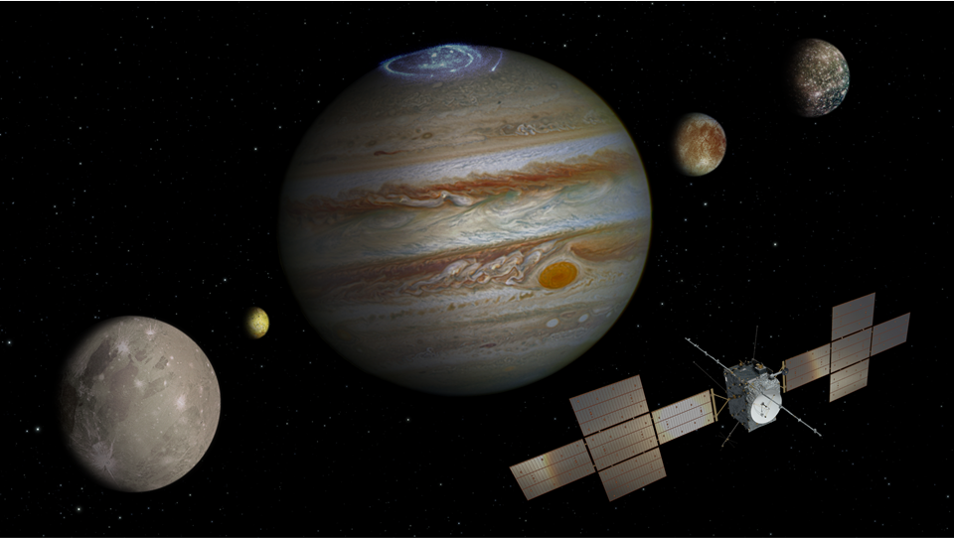
Credits: ESA / ATG medialab / NASA / J. Nichols (University of Leicester) / JPL / University of Arizona / DLR
During the 8 years voyage to the Jovian system, most of JUICE instruments will be dormant. There's however one other instrument and that will be very much awake: RADEM, developed by the Paul Scherrer Institute (Swiss Federal Council - https://www.admin.ch/gov/en/start/documentation/media-releases.msg-id-94147.html ). The RADiation–hard Electron Monitor (RADEM) is an instrument specifically designed for the ESA's JUICE mission. It will serve as an onboard radiation monitor providing information on particle fluxes and their energy spectra. That's also one of the reasons why JUICE is cruising to Jupiter during the most active phases of the ongoing solar cycle 25 (SC25), i.e. to measure the radiation within the solar system and determine how it relates to solar activity. Between Venus and Jupiter, RADEM will determine the particle spectra and their doses in space and thus map an important parameter for the so-called space weather in this vast region. RADEM should help in our understanding of the related effects from the varying solar activity, and how it influences our planet and future missions, such as a potential manned mission to Mars.
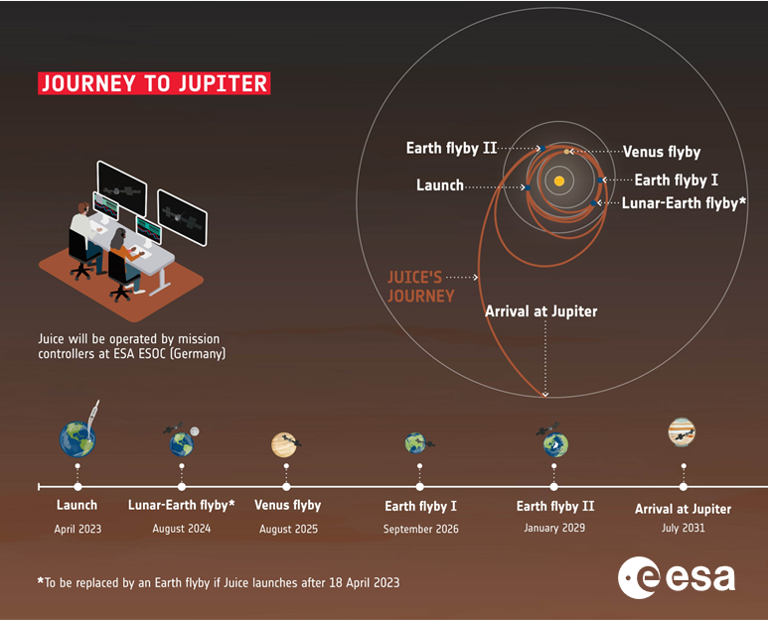
Credits: ESA / JUICE launch kit
Jupiter's magnetosphere is one of the largest structures in our solar system. It is so large that, if it could be somehow visible with the naked eye, it would appear 2 to 3 times as wide as the full moon seen from Earth. Jupiter's equatorial magnetic field is about 18 times stronger than Earth's (417.000 nT vs 25.000 nT). Its magnetopause is located on the average about 3 to 5 million km upstream of Jupiter (Earth: about 60.000 km), whereas -under favorable conditions- its magnetotail can stretch all the way to Saturn's orbit (Weigt et al. 2021 - https://doi.org/10.1093/mnras/stab1680 )! While Earth's magnetosphere is roughly teardrop-shaped, Jupiter's is flatter, more closely resembling a disk. The main reasons for this disk-like configuration are various forces exerted by the plasma inside the magnetosphere which tend to stretch Jupiter's magnetic field lines, thus forming a flattened pancake-like structure. Another nice feature is that Jupiter's magnetic field is oriented opposite to that of Earth's, with the magnetic field lines exiting the north pole and returning at the south pole. It means that for a solar-wind-induced magnetic storm to occur on Jupiter, the interplanetary magnetic field has to be oriented northward (positive Bz - https://www.stce.be/educational/acronym#B ).
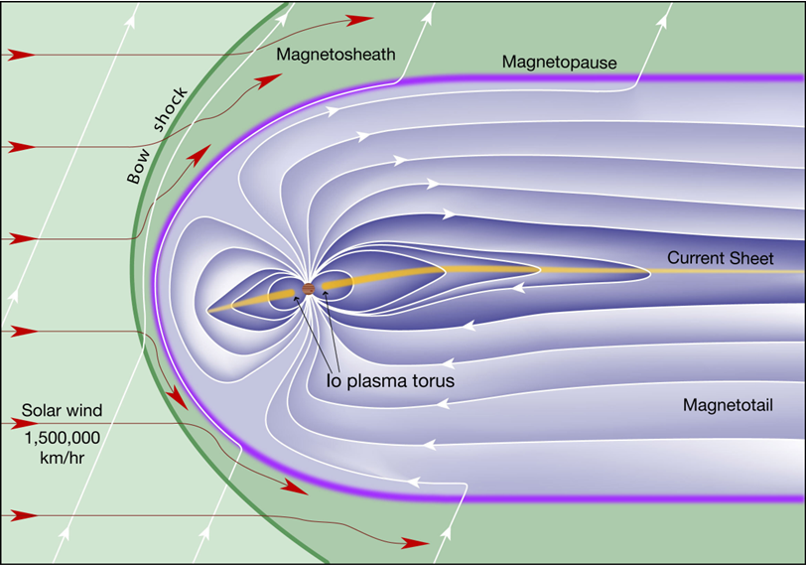
Credits: Fran Bagenal and Steve Bartlett
Jupiter's mammoth magnetosphere also acts as a trap for charged particles. Those particles originate from the solar wind (like on Earth) or are emitted from volcanically active Io and the other Galilean moons. Jupiter's intense magnetic fields, in combination with its very fast rotation (just below 10 hours!) then combine to speed up these particles to extremely high energies, with the highest fluxes of energetic particles found in doughnut-shaped belts around Jupiter's equator (e.g. the "Io torus" - see the ESA imagery (model) underneath). Jupiter's magnetic field is so strong that even ultrarelativistic, 100 GeV protons can be trapped near the planet, over 50 times higher in energy than at Earth (Roussos et al. 2022 - https://link.springer.com/article/10.1007/s10686-021-09801-0 ). Jupiter's inner radiation belts contain electrons with energies in excess of 70 MeV, maybe even up to 100 MeV or about 10 times the energies found in the Earth's outer radiation belt (Khurana et al. 2004 - https://www.researchgate.net/publication/41624624_The_configuration_of_Jupiter%27s_magnetosphere ). The generated currents such as e.g. the ring current, tail current, field-aligned currents,... typically reach values between 60 and 100 million ampères, whereas the same currents in the Earth's magnetosphere barely reach 1 to 10 million ampères (Keiling et al. 2018 - https://www.wiley.com/en-us/Electric+Currents+in+Geospace+and+Beyond-p-9781119324492 ). In short: for a satellite this means "Hell"!
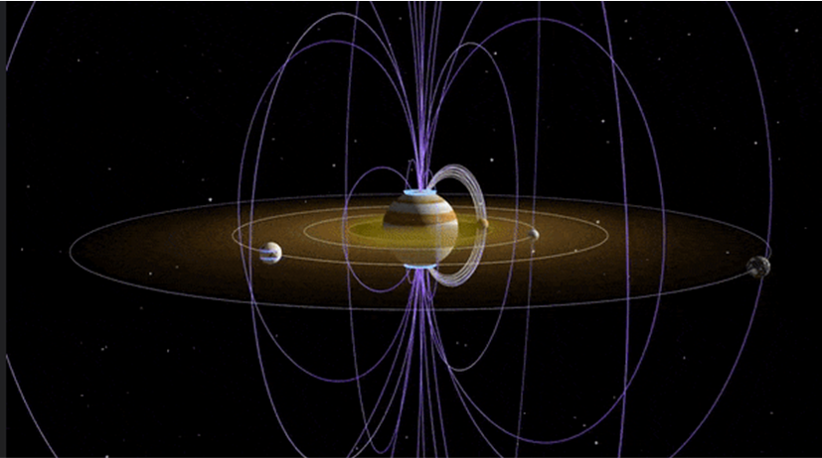
Credits: ESA - Jupiter's radiation belts, and how to survive them...
https://www.esa.int/Enabling_Support/Space_Engineering_Technology/Jupiter_s_radiation_belts_and_how_to_survive_them
All those energetic particles constitute a clear and present danger to the satellite and its electronic components. When a charged particle impacts a component, the immediate effect is a "Single Event Upset" (SEU), a brief electrical discharge that might lead to random glitches, memory flips or localised short circuits. Even more significant is the "Total Ionising Dose", which is a gradual degradation of functionality as radiation exposure builds up internal defects within a part. Based on the data from previous Jupiter missions such as Voyager, the Cassini fly-by, and especially Galileo, it has been calculated that JUICE would accumulate in those four years at Jupiter a radiation exposure about the equivalent of a telecommunications satellite in a geostationary Earth orbit for 20 years.
The good news is that satellite engineers do have plenty of experience in managing this kind of hazard. JUICE's most sensitive electronics have been placed inside twin "vaults" within the body of the spacecraft, whose carbon-fibre walls are reinforced with lead. Some parts of the electronics have been developed explicitly for this mission and are highly resistant to radiation. Also, the prolonged stay in this highly charged environment will most likely result in a gradual build up of electrostatic charges across JUICE's surfaces. Though some charging buildup is inevitable, one really wants to avoid differential charging across the spacecraft: as well as disturbing instrument readings these might even in the worst case trigger damaging "electrostatic discharge", resembling space lightning. Accordingly, all the surface layers of the JUICE spacecraft have been designed to be as conductive as possible, to prevent any buildup of charge. Further protection comes from the aforementioned RADEM, which is directly connected to the probe's onboard computer. If the radiation dose exceeds certain limits, the detector triggers an alarm signal. As it is difficult to carry out evasive manoeuvres, particularly sensitive equipment can instead be switched off in such cases, protecting it until the radiation levels are back within the permissible limits.
Good luck valiant JUICE! Night gathers, and now your watch begins.
Credits: ESA / ATG medialab
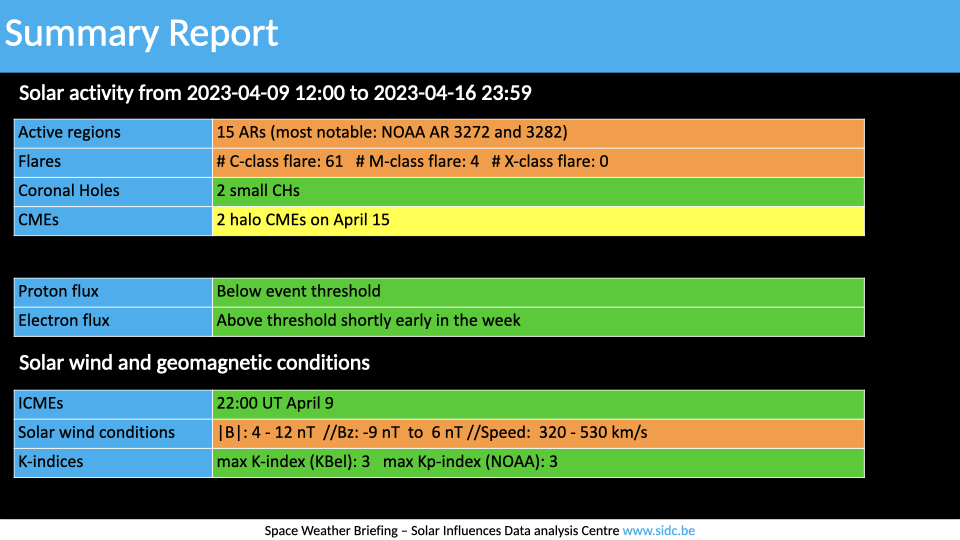
Review of solar activity
Flares
During the past week, there were, in total, 15 active regions observed on the visible side of the solar disk.
NOAA AR 3272, which was the source of the majority of the flares early in the week, and NOAA AR 3282, which was the source of the strongest flares later in the week, both had a beta-gamma configuration of the photospheric magnetic field. Also NOAA AR 3276 produced flaring early in the week, but had a simple configuration of the photospheric magnetic field.
Solar flaring activity was at low levels. A total of 61 C-class flares and 4 M-class flares were also reported. The strongest flare reported was a GOES M-class (M2.8) flare with peak time at 05:20 UT on April 10, and originated from NOAA AR 3276.
Other active regions observed on the visible side of the Sun had simple configurations of the photospheric magnetic field and they sourced some of the low level C-class flares.
Solar wind disturbances: coronal mass ejections (CMEs)
Two partial halo CMEs have been detected in the available coronagraph data on April 15 and 16 respectively.
The first CME originated from a filament eruption in the northern hemisphere close to the central meridian around 11:00 UT on April 15 and was seen for the first time around 12:48 UT on April 15 in the SOHO/LASCO C2 field of view.
The second CME originated from another eruption close to the previous one, more towards the West, near NOAA AR 3277 around 23:00 UT on April 15. The CME was seen for the first time at 01:25UT on April 16 in SOHO/LASCO C2 field of view.
We expect both CMEs to arrive at Earth, most likely as a glancing blow, during the coming week.
Energetic particles at GEO
The greater than 10MeV proton flux was below the threshold.
The greater than 2MeV electron flux was above the 1000pfu threshold at the start of the week until 19:50 UT on April 9 but eventually decreased below the threshold to background levels.
The 24-hour electron fluence was at normal levels during the week.
Review of geomagnetic activity
Solar wind at L1
Early in the week, a glancing blow from a CME that erupted the previous week, was detected, although the source of this CME remains unclear. Around 22:00UT on April 9 a forward shock wave has been observed in the in situ data with interplanetary magnetic field (IMF) values up to 13 nT. The shock wave was followed by the arrival of the interplanetary coronal mass ejection.
The solar wind speed was furthermore mixed in with a high speed stream arrival resulting from a coronal hole and reached values above 500 km/s.
On April 11, the solar wind slowly returned to slow solar wind conditions with values of 300-350 km/s. It remained in slow solar wind conditions for the rest of the week.
Geomagnetic conditions
A short interval of active conditions was reported by local station at Dourbes from 08:00 UT until 10:00 UT on April 10.
The Kp-index as reported by NOAA remained at values between 3 and 4- during that time.
The remainder of the week, the geomagnetic conditions were quiet to unsettled.
International Sunspot Number by SILSO
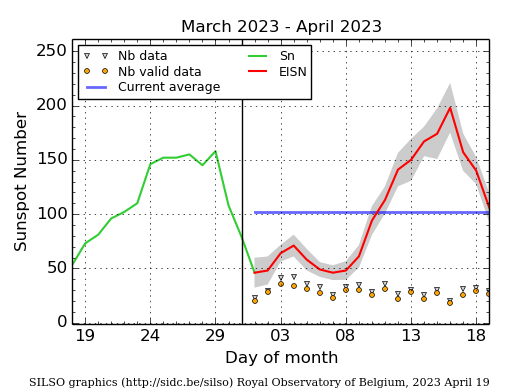
The daily Estimated International Sunspot Number (EISN, red curve with shaded error) derived by a simplified method from real-time data from the worldwide SILSO network. It extends the official Sunspot Number from the full processing of the preceding month (green line), a few days more than one solar rotation. The horizontal blue line shows the current monthly average. The yellow dots give the number of stations that provided valid data. Valid data are used to calculate the EISN. The triangle gives the number of stations providing data. When a triangle and a yellow dot coincide, it means that all the data is used to calculate the EISN of that day.
PROBA2 Observations
Solar Activity
Solar flare activity fluctuated from low to moderate during the week.
In order to view the activity of this week in more detail, we suggest to go to the following website from which all the daily (normal and difference) movies can be accessed: https://proba2.oma.be/ssa
This page also lists the recorded flaring events.
A weekly overview movie can be found here (SWAP week 681). https://proba2.oma.be/swap/data/mpg/movies/weekly_movies/weekly_movie_2023_04_10.mp4
Details about some of this week's events can be found further below.
If any of the linked movies are unavailable they can be found in the P2SC movie repository here https://proba2.oma.be/swap/data/mpg/movies/
Monday Apr 10
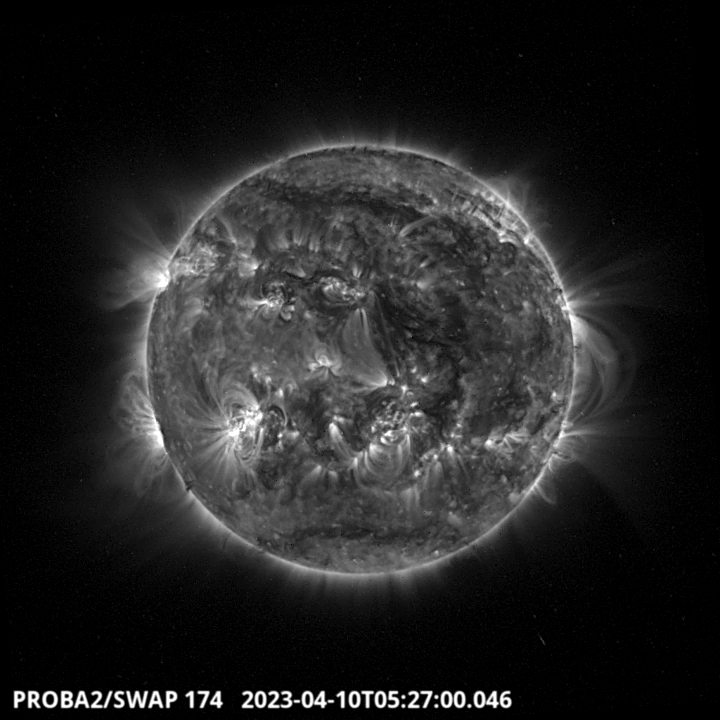
A Flow erupted from the South Eastern Hemisphere around 5:27 UT. It has been classified as a M2.8 erupted from the active region NOAA 3276. It is the largest flare of the week. Find a SWAP movie of the event here. https://proba2.oma.be/swap/data/mpg/movies/20230410_swap_movie.mp4
Saturday Apr 15
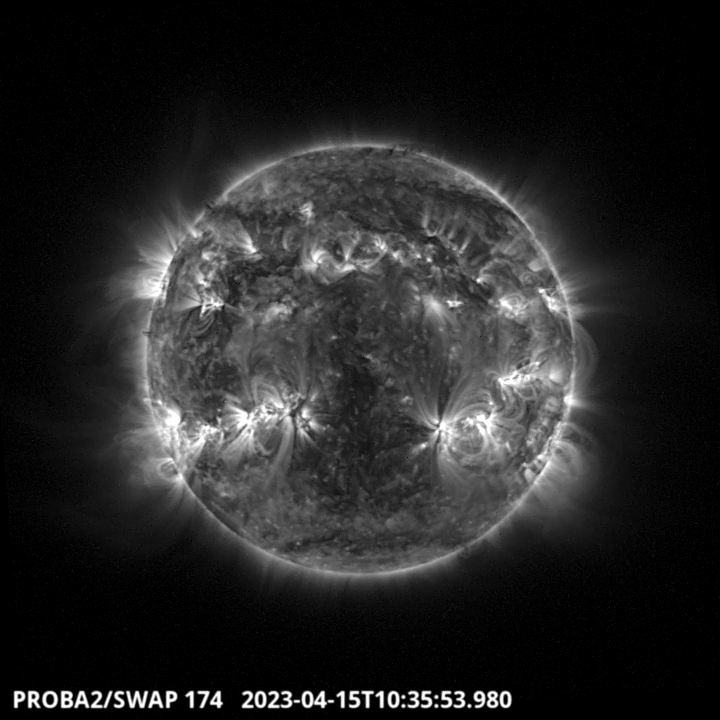
A filament erupted around 10:35 UT in the North West part of the solar disk. Find a SWAP movie of the event here. https://proba2.oma.be/swap/data/mpg/movies/20230415_swap_movie.mp4
Noticeable Solar Events
| DAY | BEGIN | MAX | END | LOC | XRAY | OP | 10CM | TYPE | Cat | NOAA |
| 10 | 0510 | 0520 | 0528 | M2.8 | 3276 | |||||
| 11 | 0951 | 1016 | 1023 | S20E17 | M1.3 | 1N | III/2 | 50 | 3272 | |
| 14 | 1610 | 1618 | 1625 | M1.1 | III/1VI/1 | 3282 | ||||
| 14 | 2318 | 2327 | 2331 | M1.5 | 3282 |
| LOC: approximate heliographic location | TYPE: radio burst type |
| XRAY: X-ray flare class | Cat: Catania sunspot group number |
| OP: optical flare class | NOAA: NOAA active region number |
| 10CM: peak 10 cm radio flux |
Geomagnetic Observations in Belgium
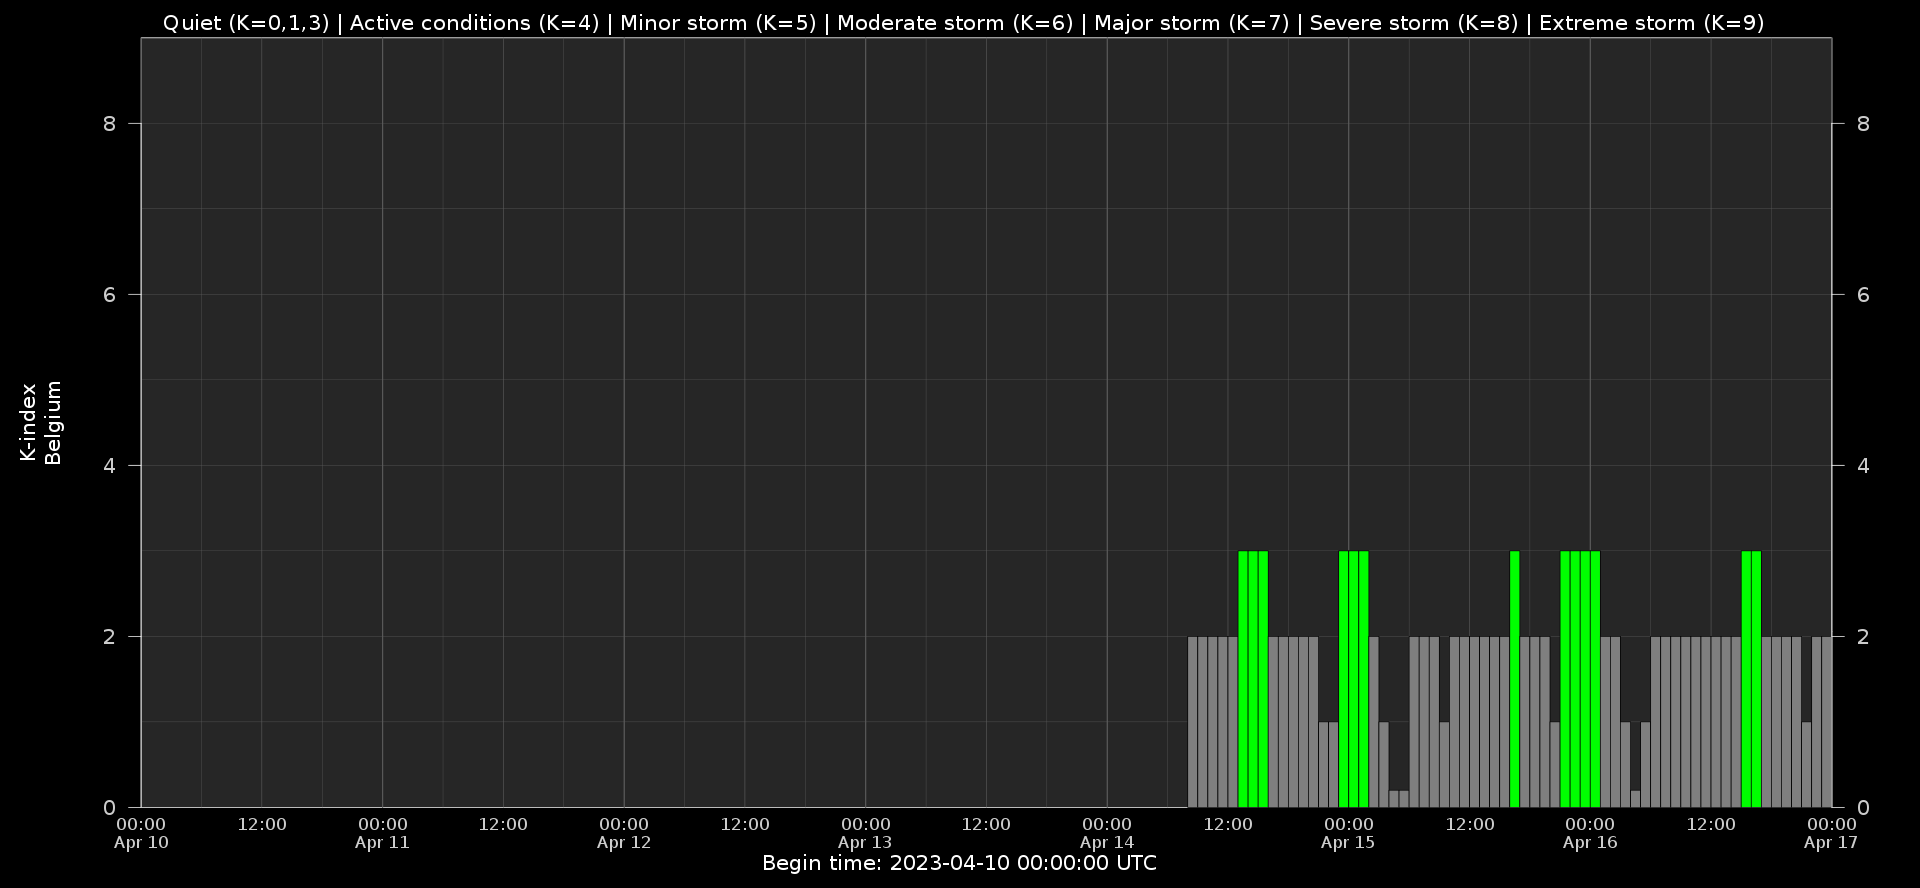
Local K-type magnetic activity index for Belgium based on data from Dourbes (DOU) and Manhay (MAB). Comparing the data from both measurement stations allows to reliably remove outliers from the magnetic data. At the same time the operational service availability is improved: whenever data from one observatory is not available, the single-station index obtained from the other can be used as a fallback system.
Both the two-station index and the single station indices are available here: http://ionosphere.meteo.be/geomagnetism/K_BEL/
Review of ionospheric activity
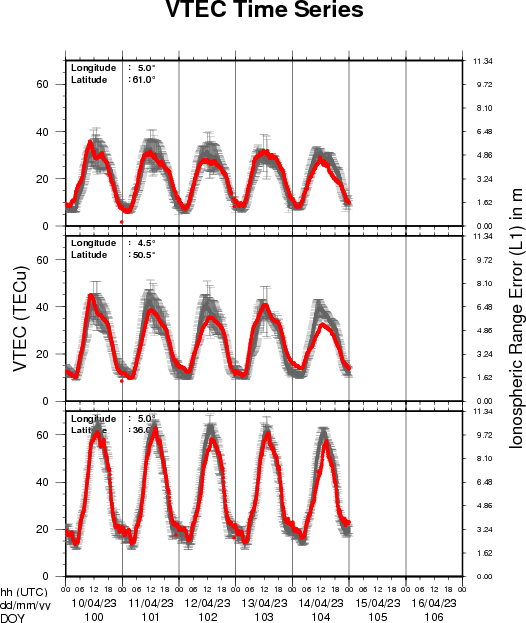
The figure shows the time evolution of the Vertical Total Electron Content (VTEC) (in red) during the last week at three locations:
a) in the northern part of Europe(N 61deg E 5deg)
b) above Brussels(N 50.5deg, E 4.5 deg)
c) in the southern part of Europe(N 36 deg, E 5deg)
This figure also shows (in grey) the normal ionospheric behaviour expected based on the median VTEC from the 15 previous days.
The VTEC is expressed in TECu (with TECu=10^16 electrons per square meter) and is directly related to the signal propagation delay due to the ionosphere (in figure: delay on GPS L1 frequency).
The Sun's radiation ionizes the Earth's upper atmosphere, the ionosphere, located from about 60km to 1000km above the Earth's surface.The ionization process in the ionosphere produces ions and free electrons. These electrons perturb the propagation of the GNSS (Global Navigation Satellite System) signals by inducing a so-called ionospheric delay.
See http://stce.be/newsletter/GNSS_final.pdf for some more explanations ; for detailed information, see http://gnss.be/ionosphere_tutorial.php
The SIDC Space Weather Briefing
The Space Weather Briefing presented by the forecaster on duty from April 9 to April 16. It reflects in images and graphs what is written in the Solar and Geomagnetic Activity report: https://www.stce.be/briefings/20230417_SWbriefing.pdf
If you need to access the movies, contact us: stce_coordination at stce.be
Upcoming activities
Check out our activity calendar: activities and encounters with the Sun-Space-Earth system and Space Weather as the main theme. We provide occasions to get submerged in our world through educational, informative and instructive activities.
If you want your event in our calendar, contact us: stce_coordination at stce.be
* April 27, KUL/CmPA seminar: Why do we even care? Space weather effects 101, 200B 02.16 and online, Leuven, Belgium
* April 28, STCE seminar: Space Weather Tools in Support of Space Radiation Operations, Nicolet@spacepole and Teams, Brussels, Belgium
* May 4, STCE seminar: The impact of Multiple Eruptions from Active Region 10930 on the Broad Geospace System, Nicolet@spacepole and Teams, Brussels, Belgium
* May 16, KUL/CmPA seminar: Magnetohydrodynamic modelling of Alfvén waves in the solar corona, 200B 02.16 and online, Leuven, Belgium
* May 22-24, STCE Space Weather Introductory Course, Brussels, Belgium - FULL
* May 25, STCE seminar: Comparative study of a constant-alpha force-free field and its approximations in an ideal toroid, Meridian room@spacepole and zoom, Brussels, Belgium
* May 25, RMI Seminar: Towards a new hydrometeors identification tool at the RMI, conference room of the RMI, Brussels, Belgium
* May 29 - June 1, PITHIA-NRF Training School, Rome, Italy
Check: https://www.stce.be/calendar