- Table of Content
- 1.It's raining.....
- 2.ESA Academy vi...
- 3.Review of sola...
- 4.International ...
- 5.PROBA2 Observa...
- 6.Noticeable Sol...
- 7.Review of geom...
- 8.Geomagnetic Ob...
- 9.Review of Iono...
- 10.STCE Activitie...
2. ESA Academy visits the STCE
3. Review of solar activity
4. International Sunspot Number by SILSO
5. PROBA2 Observations
6. Noticeable Solar Events
7. Review of geomagnetic activity
8. Geomagnetic Observations in Belgium
9. Review of Ionospheric Activity
10. STCE Activities
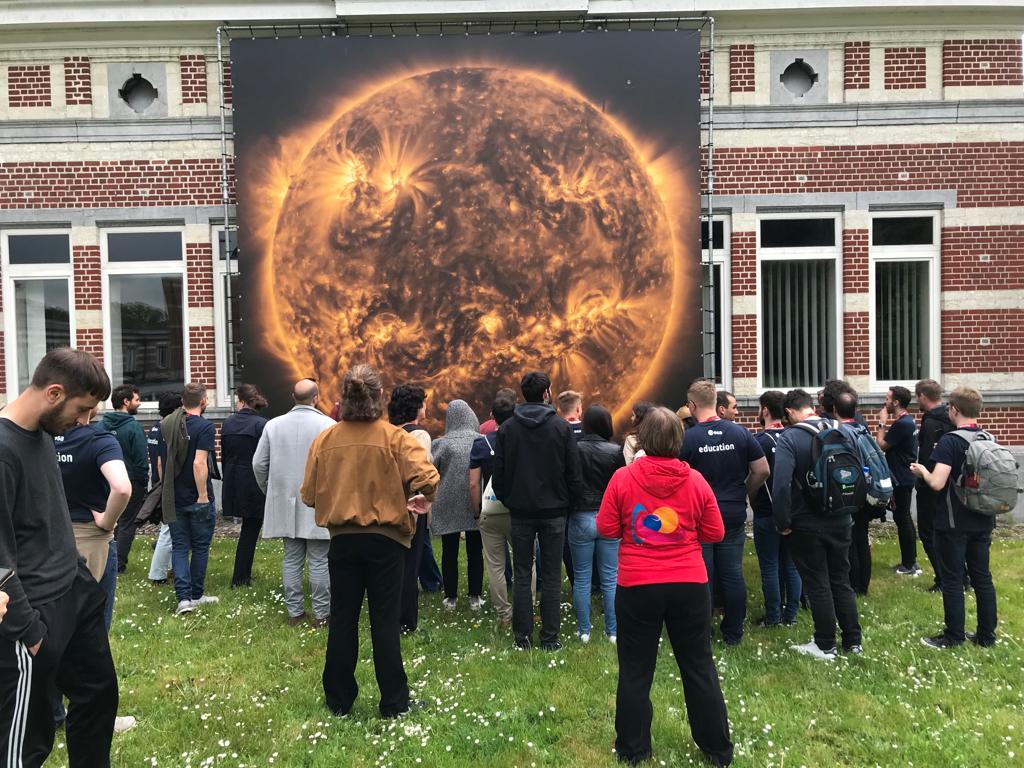
It's raining... CMEs!
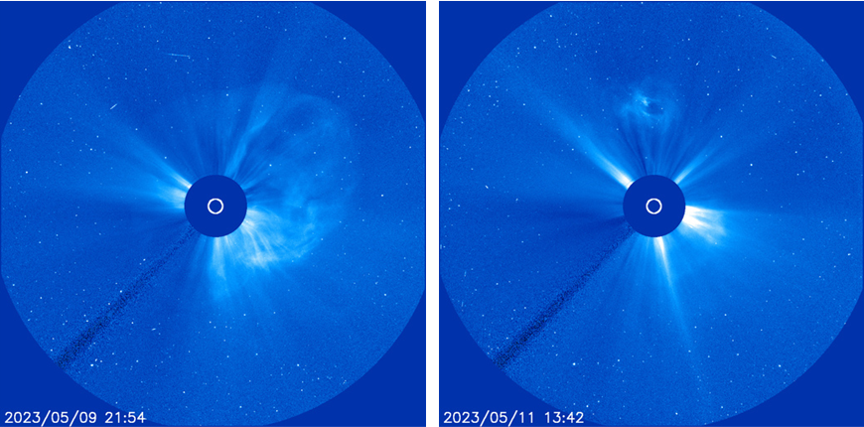
With several flare-active sunspot regions transiting the solar disk, solar activity has been high over the last few weeks. In particular NOAA 3296, as discussed in last week's newsitem (https://www.stce.be/news/644/welcome.html ), produced numerous moderately strong flares (M-class flares). Many of these flares were associated with a coronal mass ejection (CME), a few of which even had an earth-directed component. In the coronagraphic images underneath (SOHO/LASCO C3 - https://soho.nascom.nasa.gov/ ), the halo CME of 9-10 May as well as a number of CMEs on 11 May are shown. A clip covering the period from 8 till 12 May can be found in the online version of this newsitem at https://www.stce.be/news/646/welcome.html
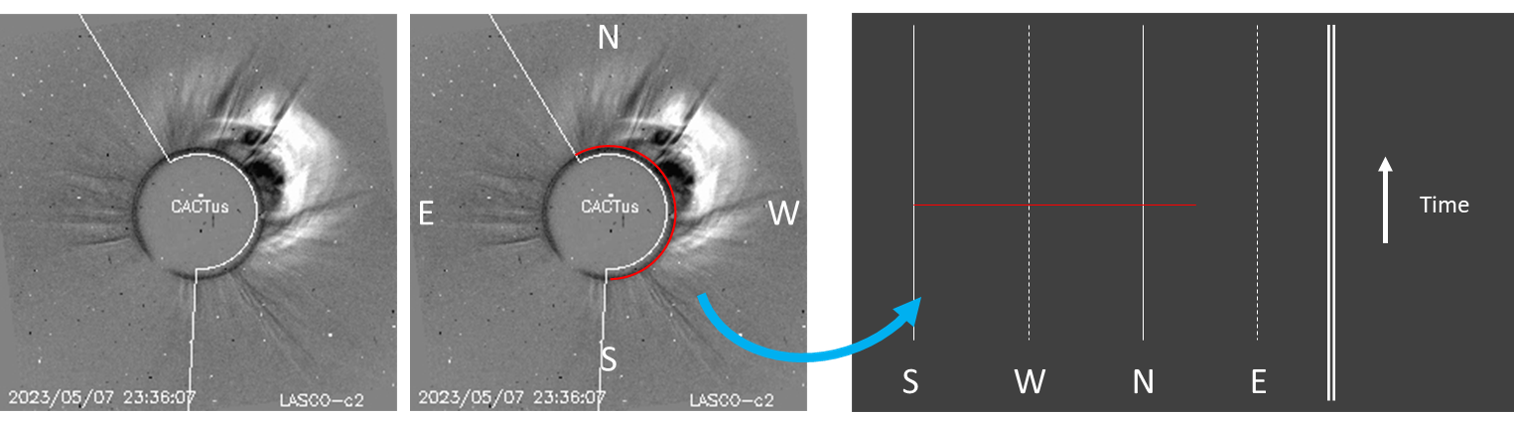
CACTUS stands for "Computer Aided CME Tracking", with the "us" added for convenience (https://www.sidc.be/cactus/ ). It is a software package that has been developed by the SIDC about 2 decades ago (Robbrecht and Berghmans, 2004 - https://www.aanda.org/articles/aa/abs/2004/39/aa1302/aa1302.html ) and autonomously detects CMEs in image sequences from SOHO/LASCO (https://soho.nascom.nasa.gov/ ). Based on difference images (i.e. one image subtracted from the next), and using some clever algoritms, it detects brightenings in the images that are radially moving outward (away from the Sun) through the field of view of the coronagraph. The detected patterns can then be put on a map, with the location laid out horizontally (South-West-North-East, so counter-clockwise) and time vertically - See the simplified sketch underneath. The colours are arbitrarily chosen and used to distinguish the different CMEs from each other. The "thickness of each "blob" indicates how long the outflow of the CME takes.
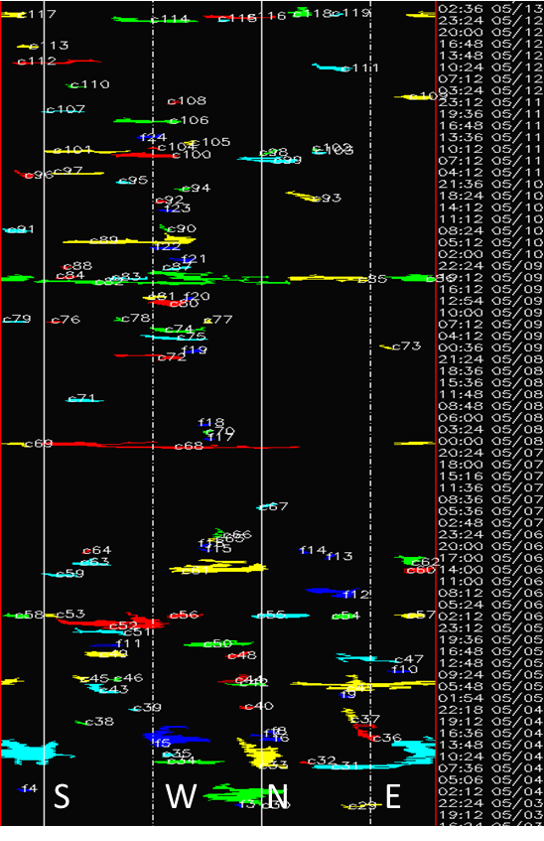
The output of the software is a list of events, similar to the classic catalogs, with principal angle of propagation, angular width and velocity estimation for each CME. These data can be accessed by clicking on the coloured CME on the map (near real-time, i.e. almost as soon as the SOHO imagery is received - https://www.sidc.be/cactus/out/latestCMEs.html). The CME list is automatically generated by CACTus, meaning no human intervention or supervision is required. Nonetheless, detections have to be examined carefully, as sometimes, it is not easy to distinguish multiple CMEs close to each other, which the system may then erroneously combine or split up. Therefore, the use of the CACTus data are to be used with some caution when used for statistical purposes. The map underneath shows the results for the period from 3 till early 13 May. According to CACTus, there were on the average about 9 CMEs daily during the first 13 days of May. This is quite a bit higher than the average CME-rate for the first 4 months of 2023, where it was around 6 per day. Of course the month of May still has over 2 weeks to go, which may reduce the current average. An example of a comparison between a period of maximum activity and one of minimum activity during the previous solar cycle can be found at https://www.stce.be/news/421/welcome.html
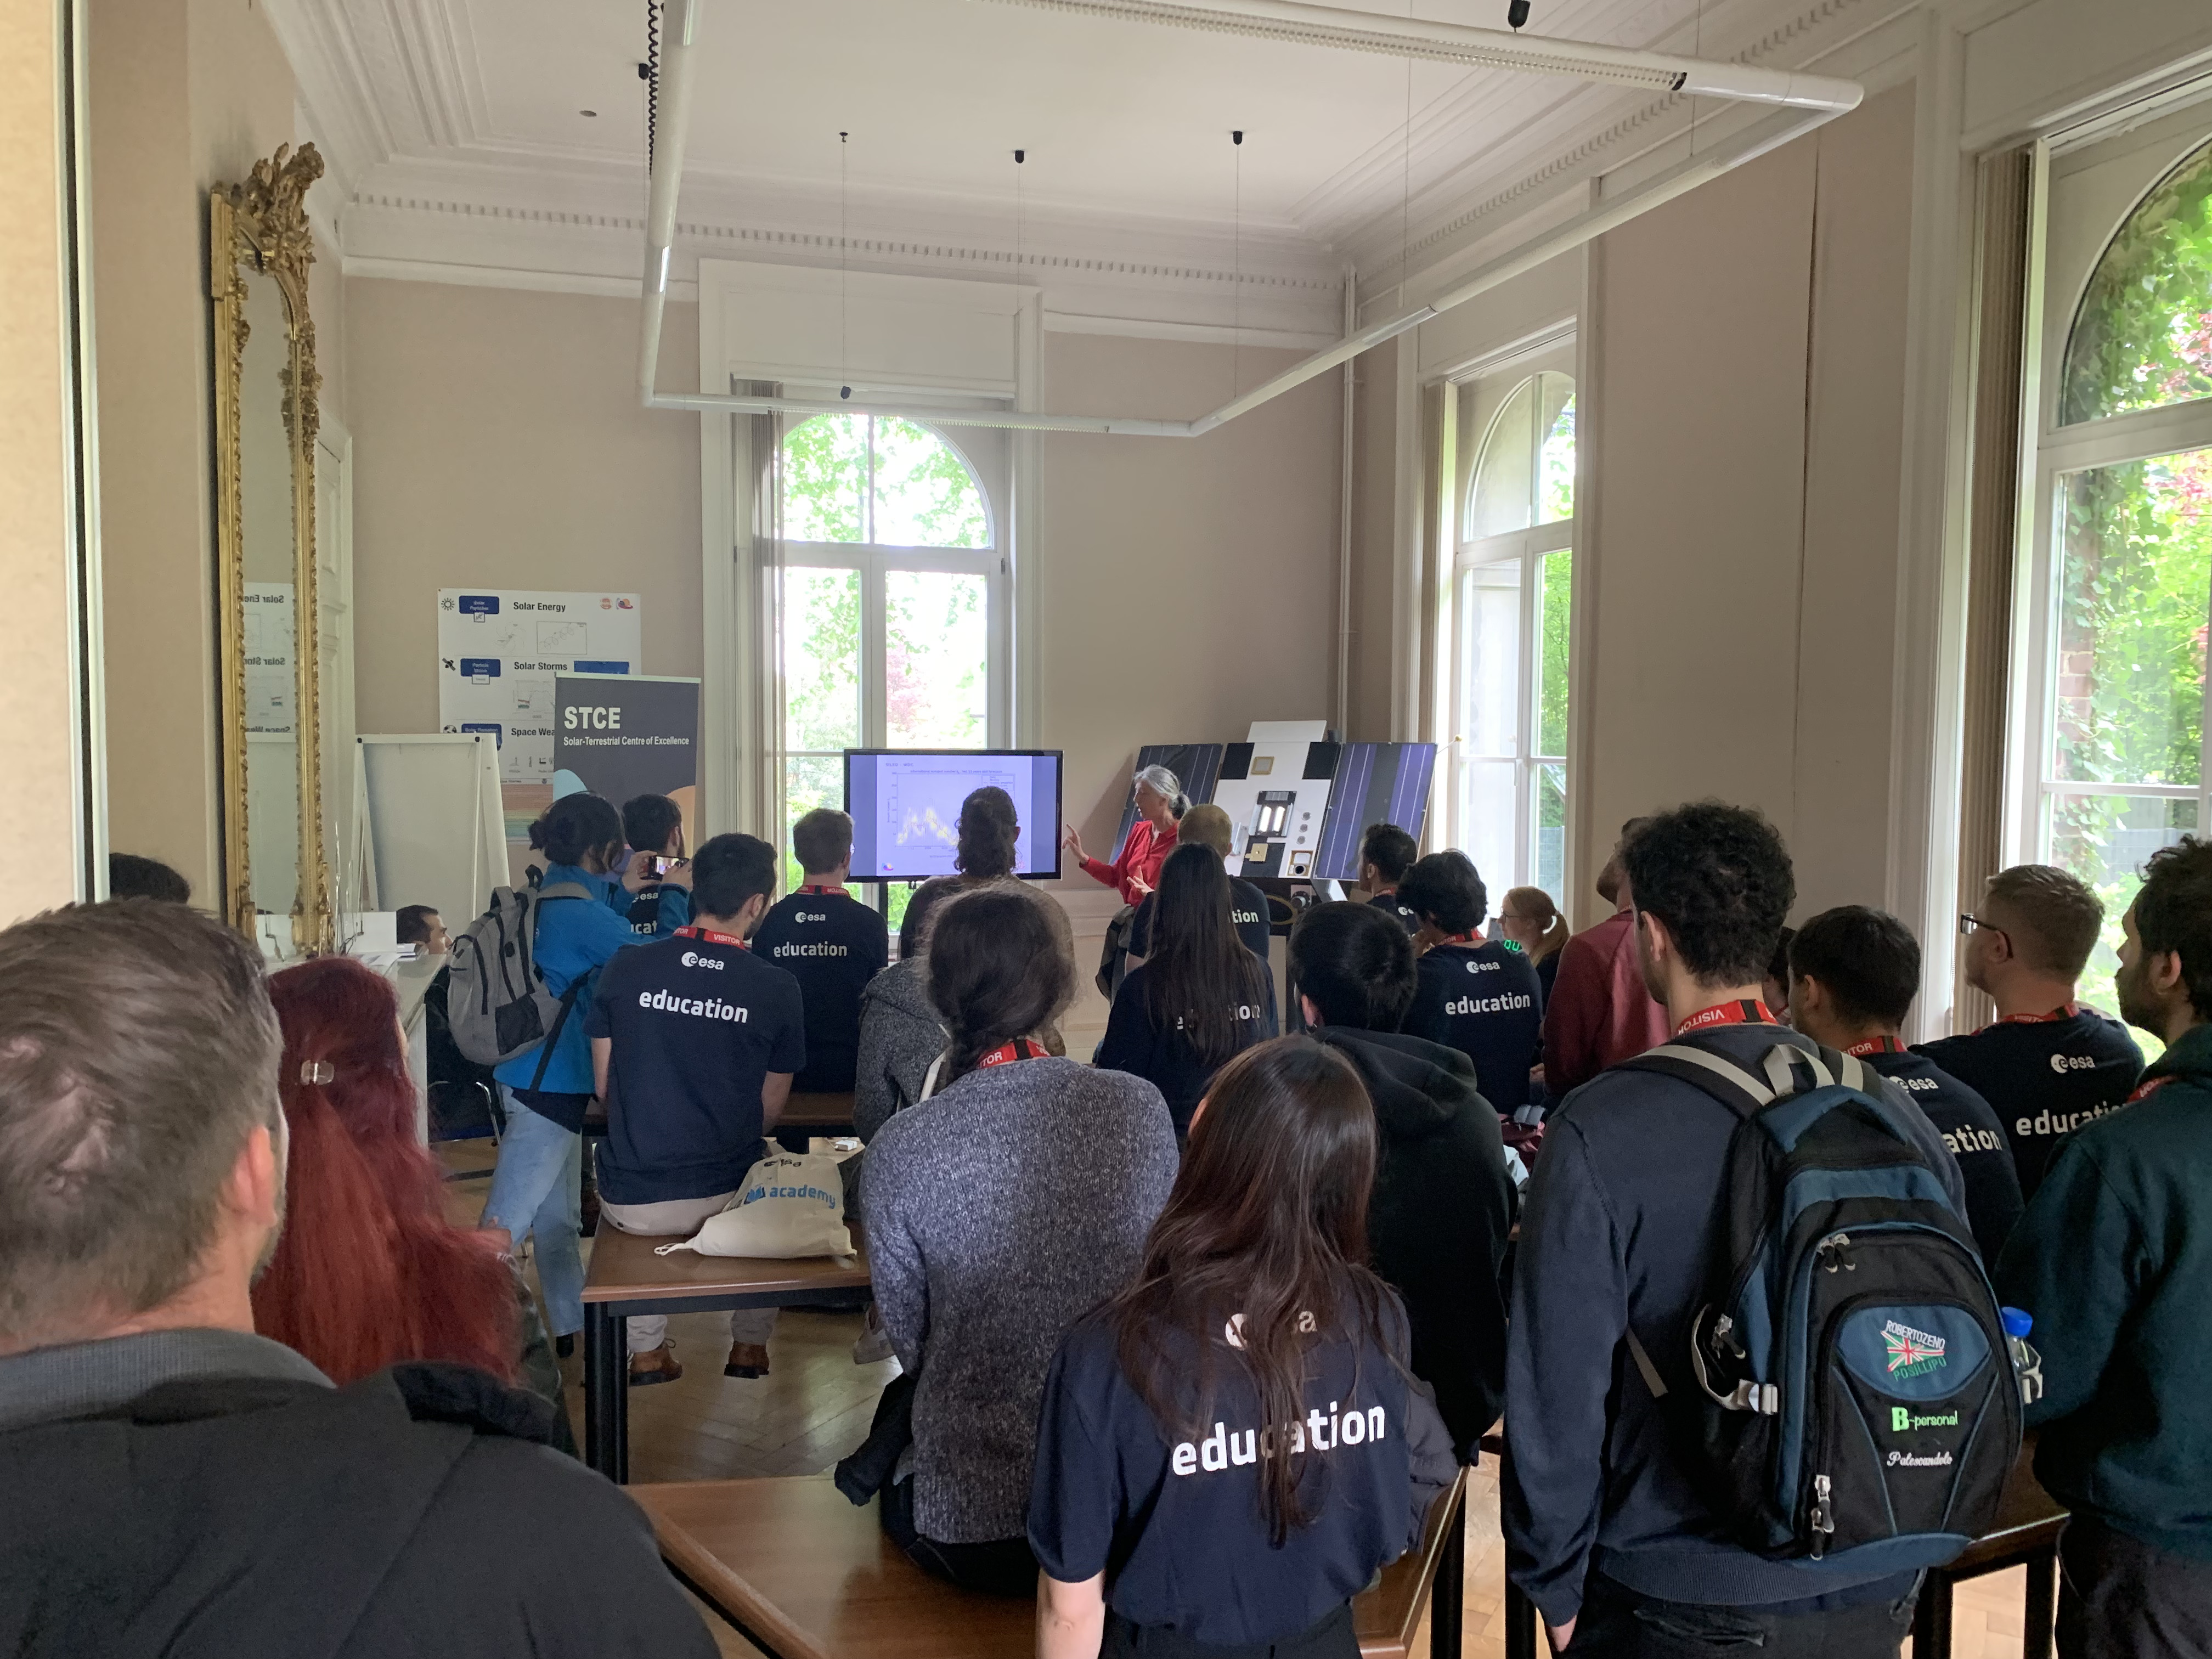
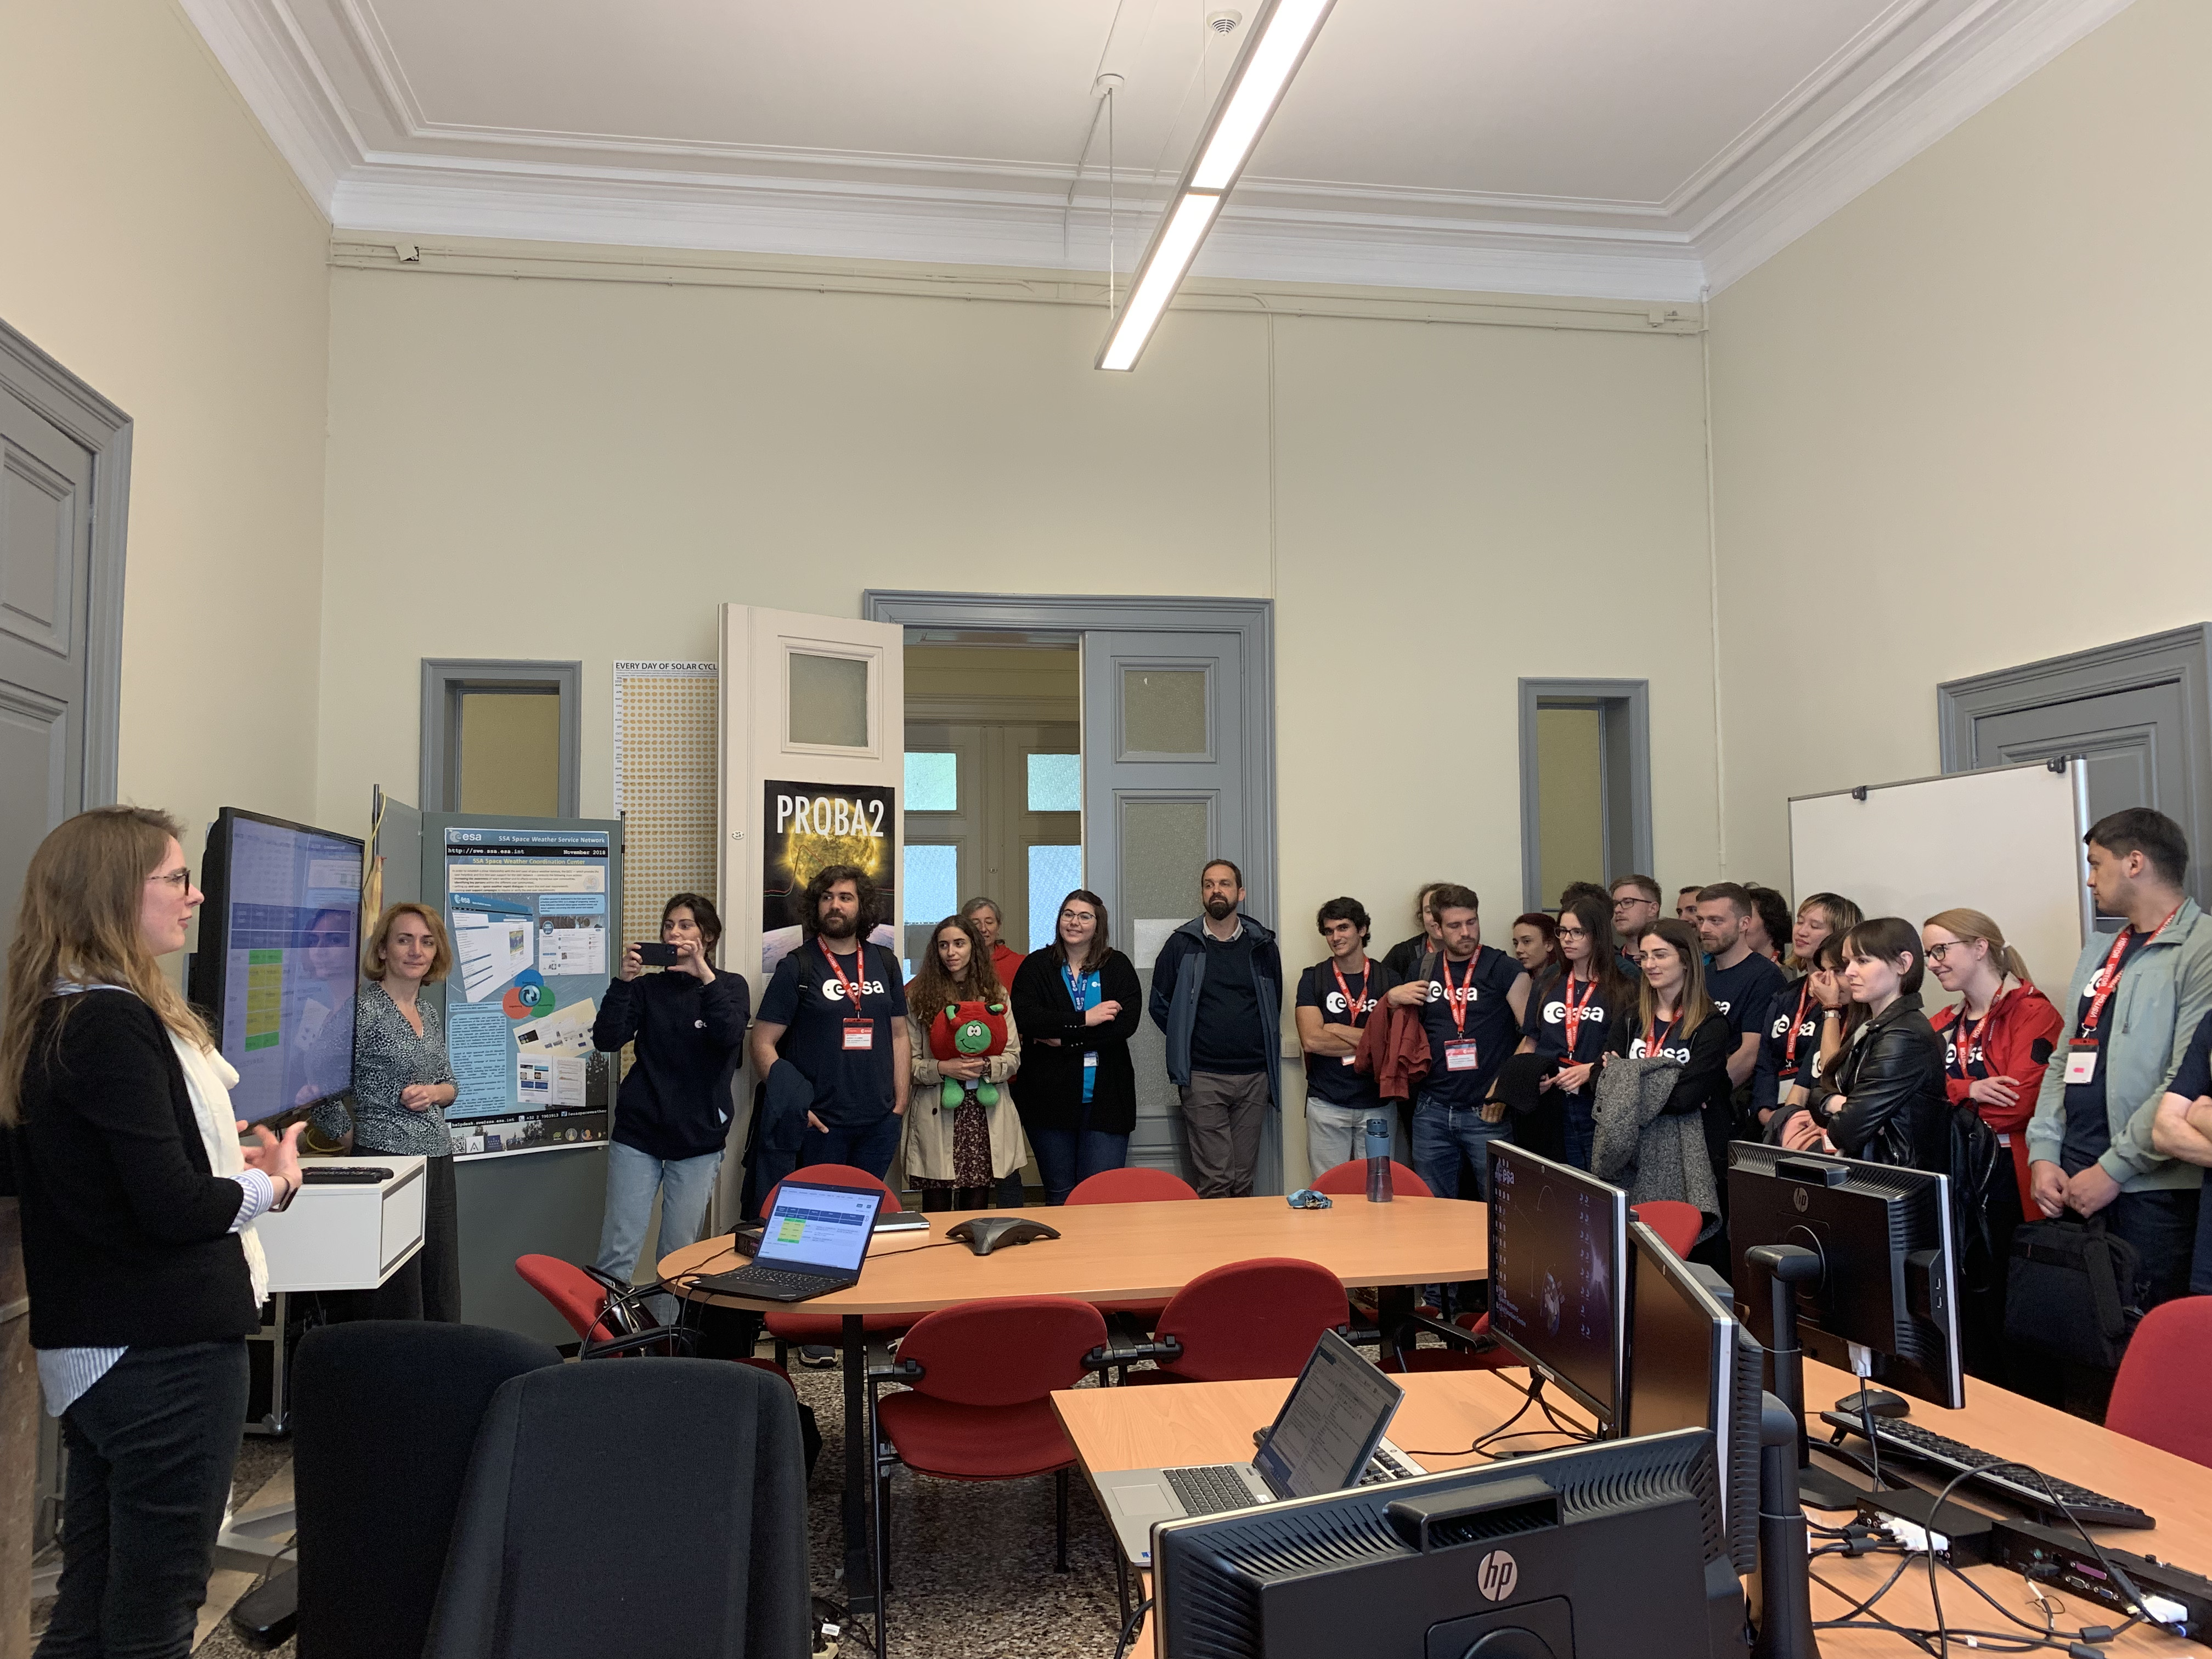
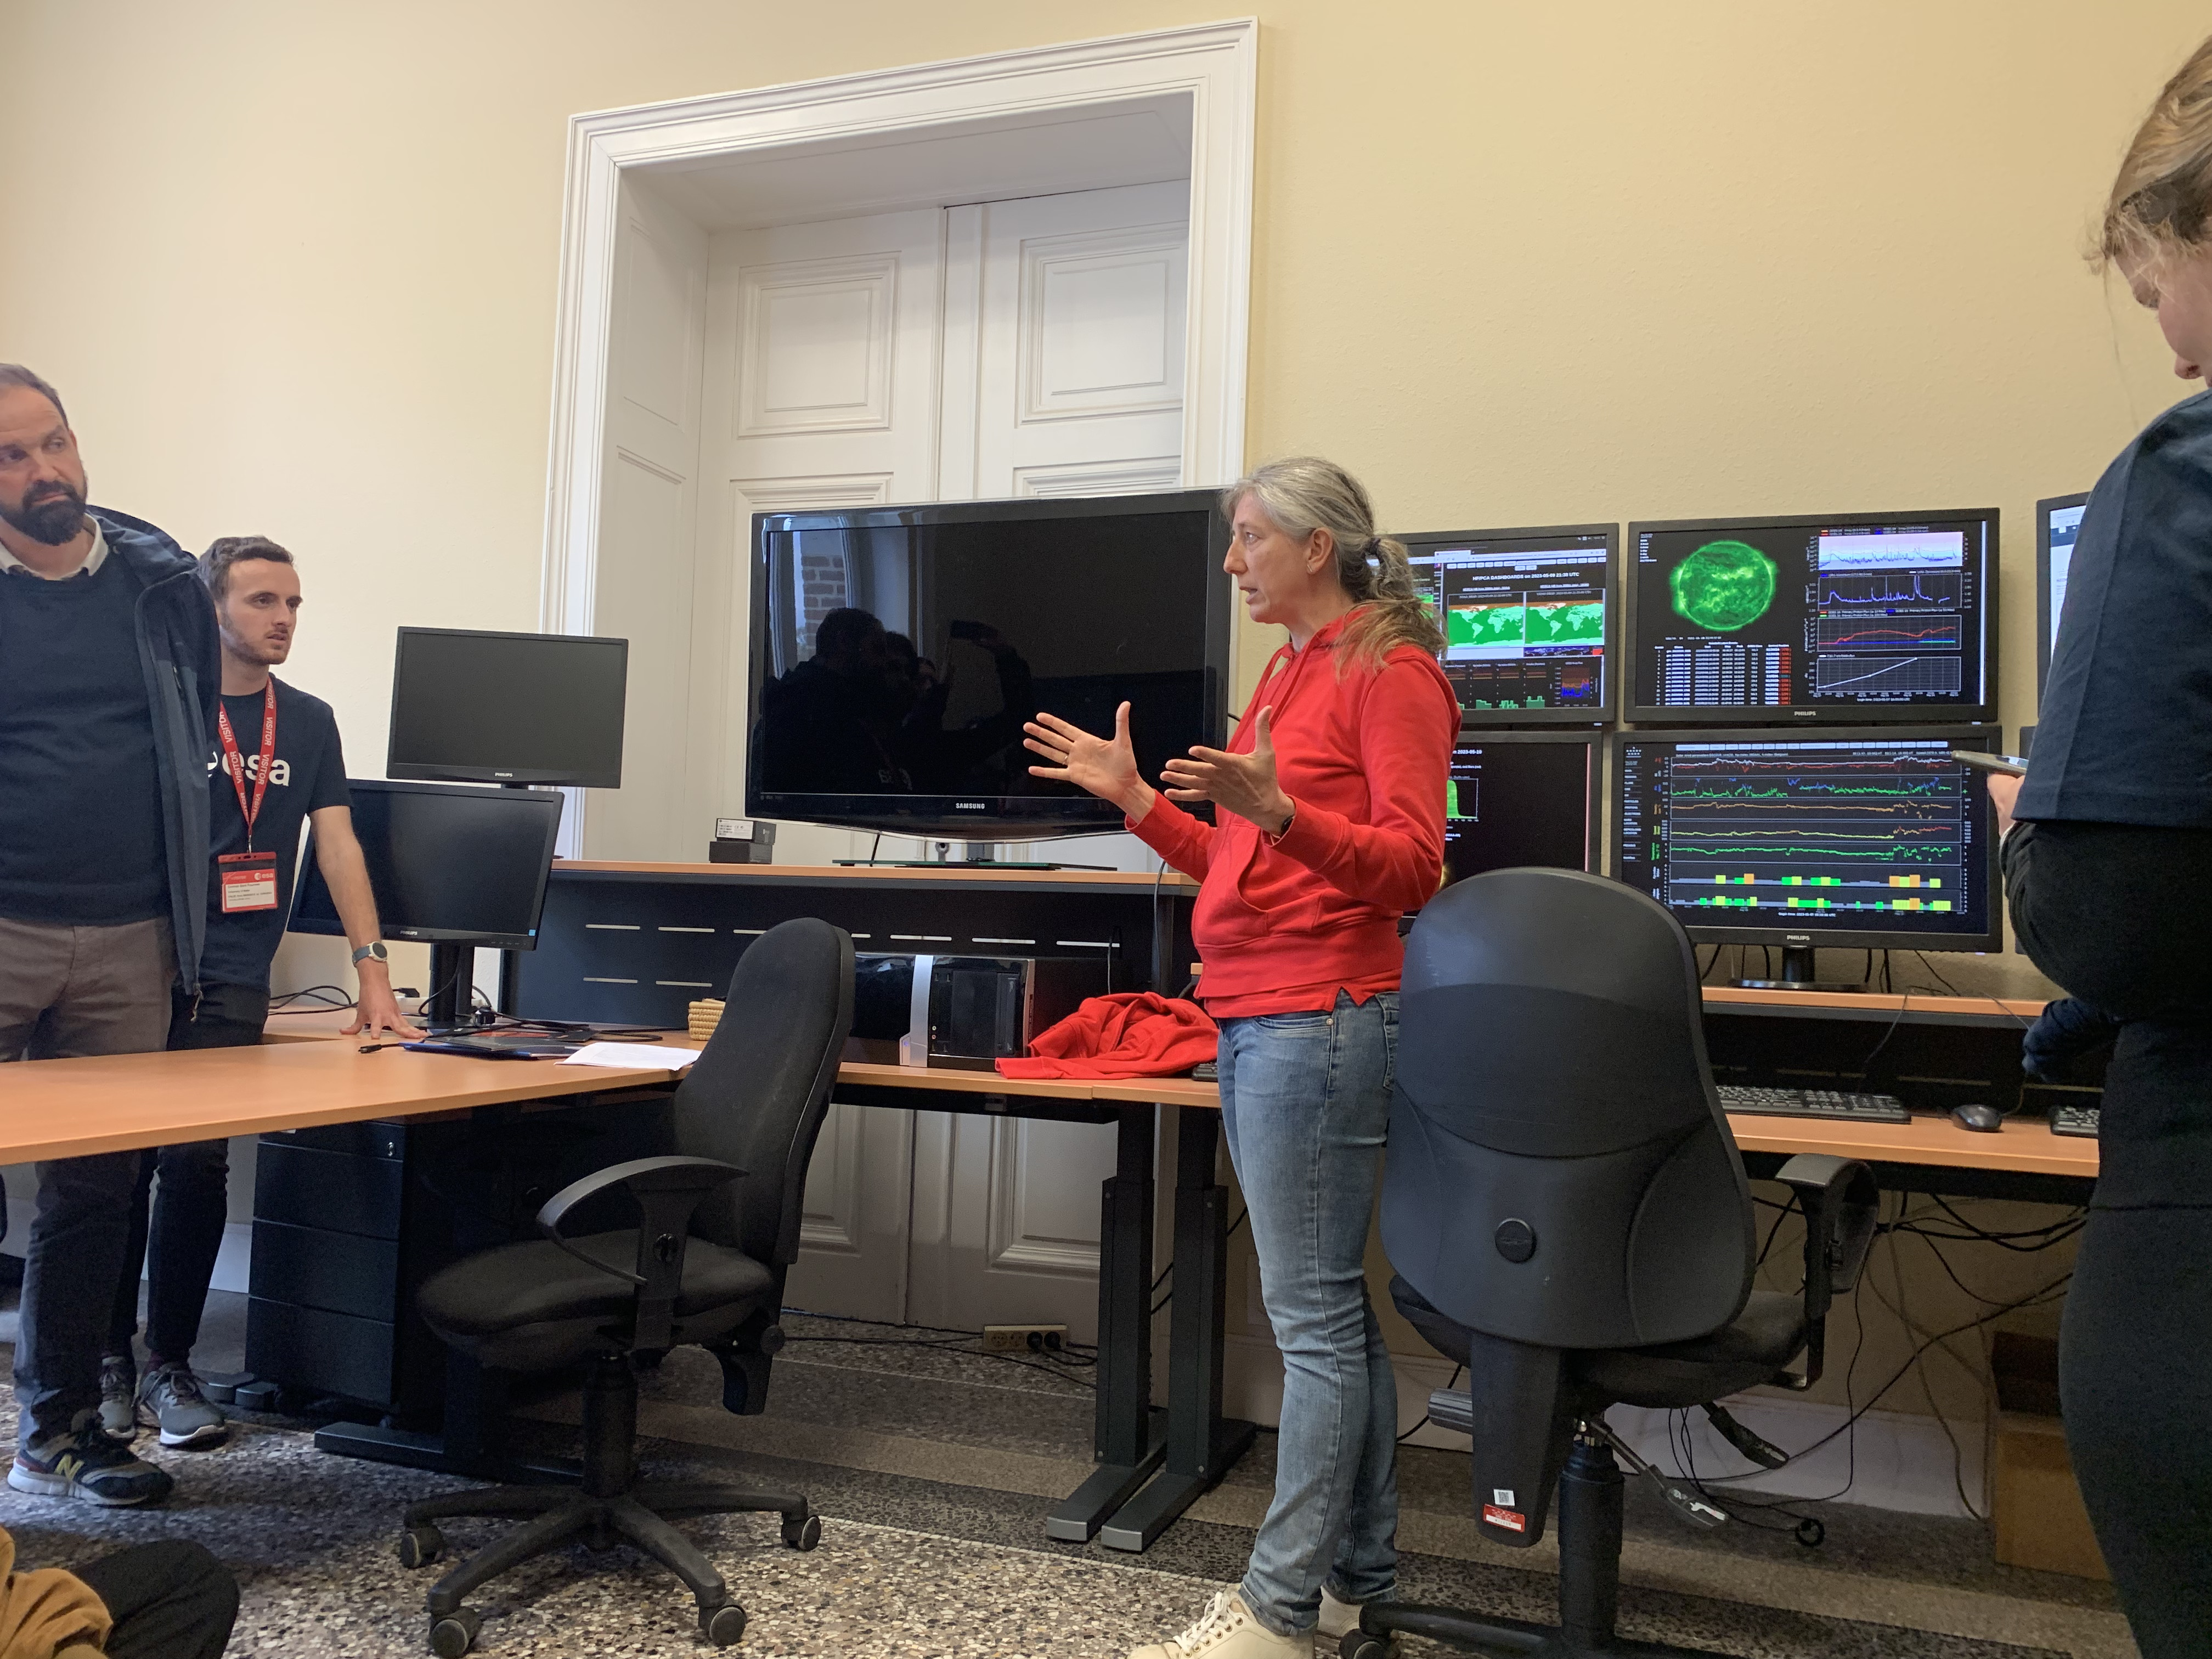
ESA Academy visits the STCE
On May 8, the STCE team was invited to teach at ESA's Academy in Transinne (BE) in a pilot for their new Space Weather Training Course.
30 students were selected for a week-long, in-depth school about space weather and its technological impacts. The STCE was responsible for giving the students a first introduction on how to forecast space weather events and impacts.
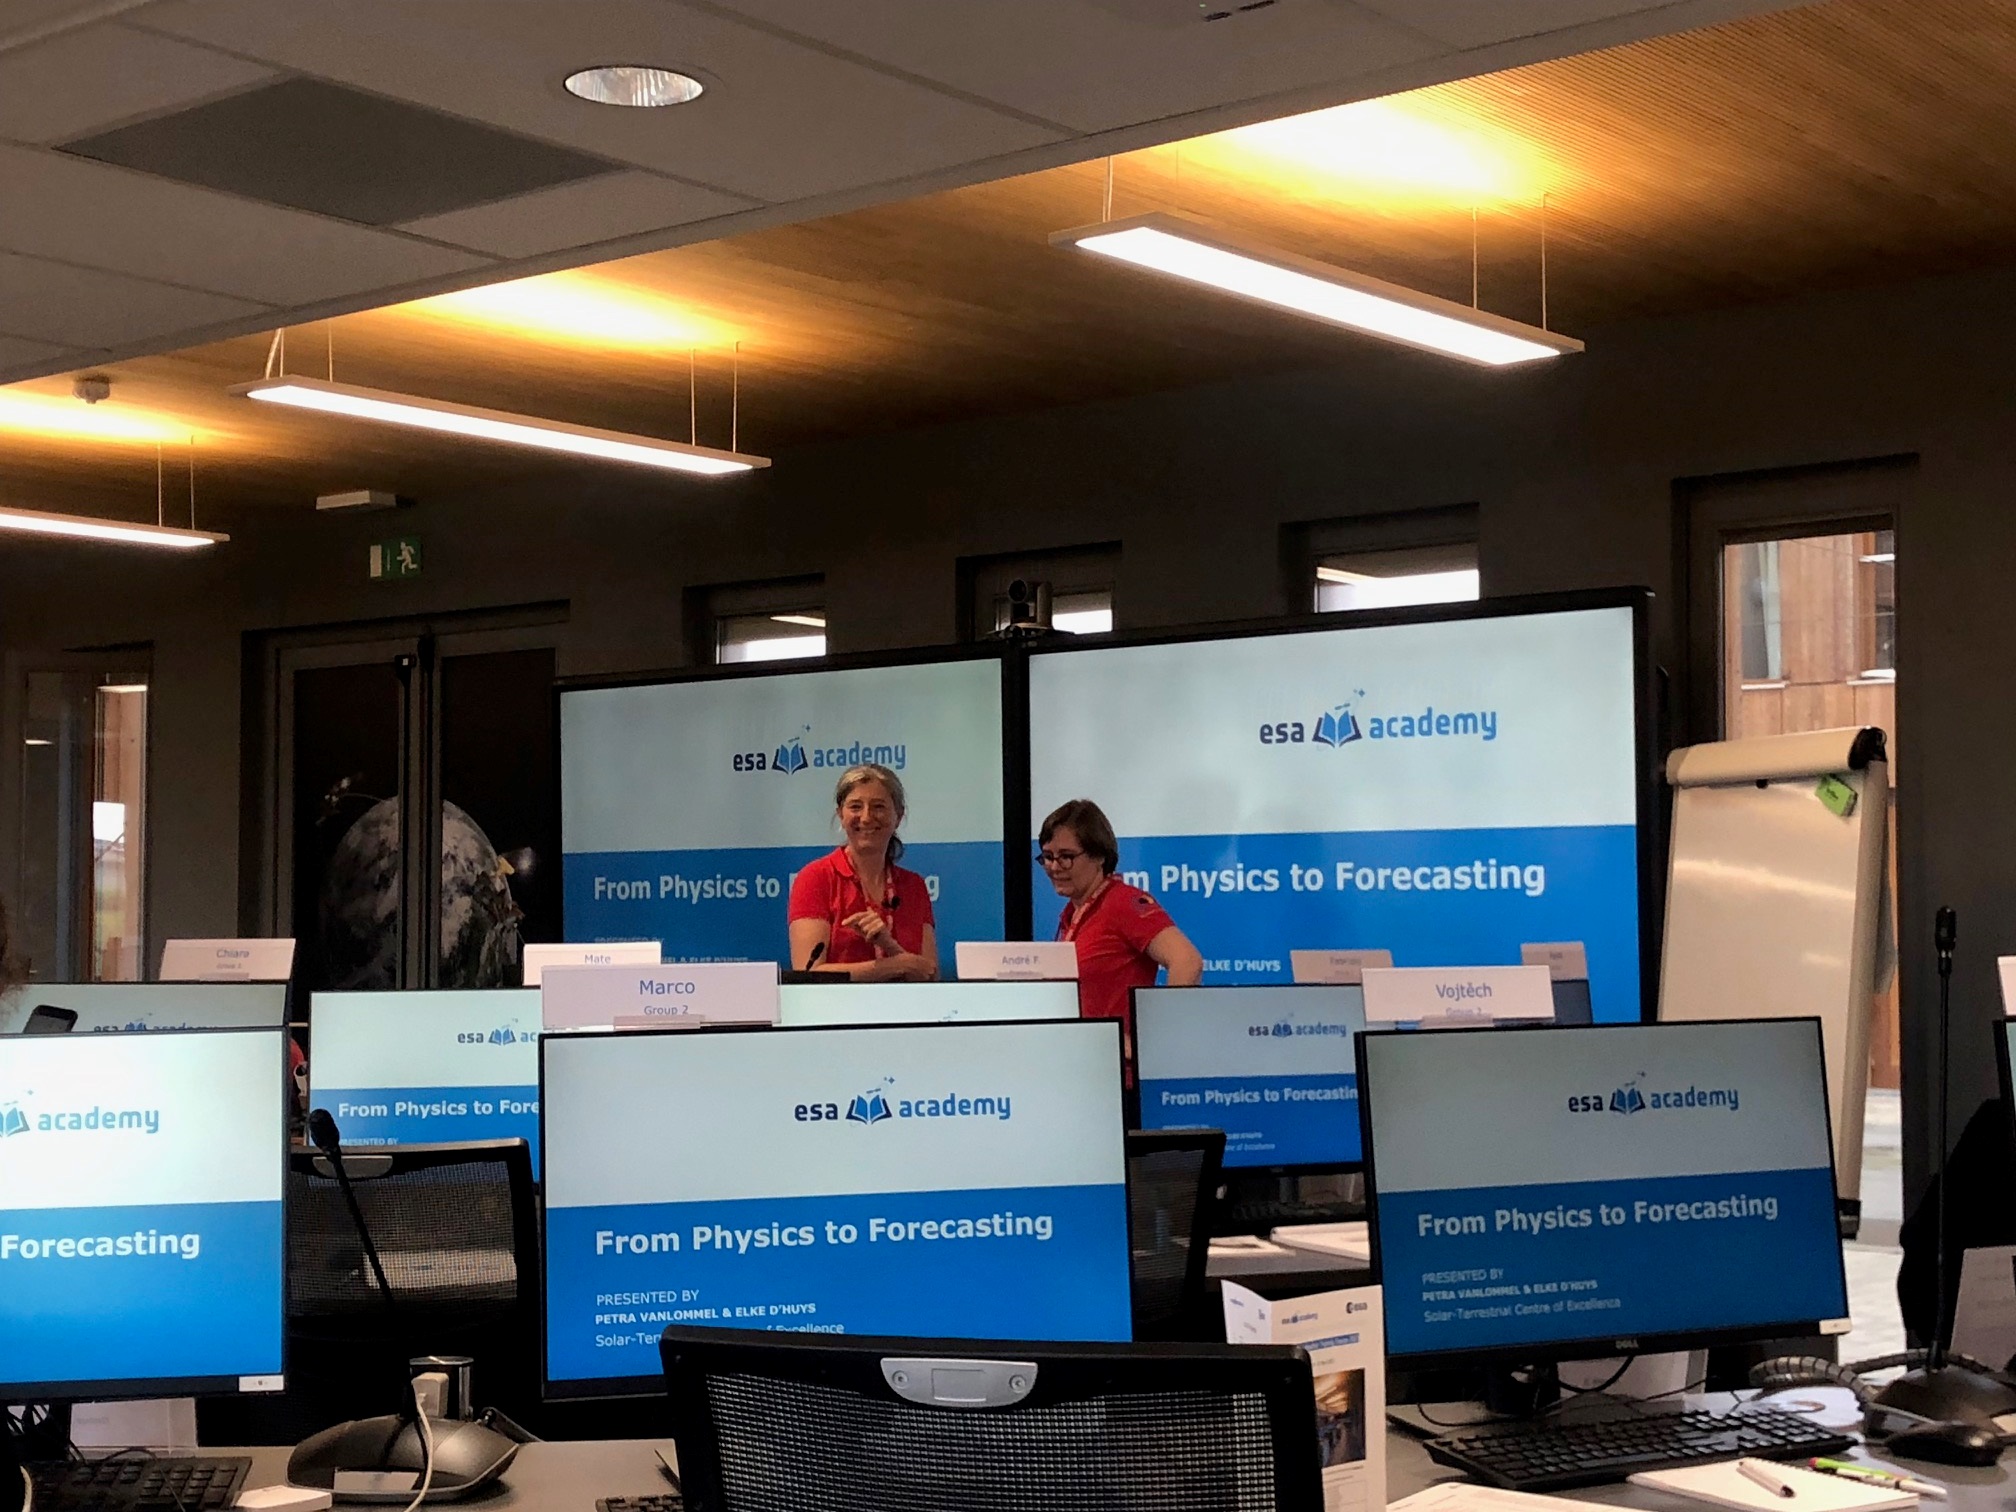
Later in the week, the students hopped on a bus and drove a long way to the Space Pole in Brussels. We took them on a tour of our various activities; ranging from satellite operations, to ground-based observations and of course space weather forecasting. Also a visit to ESA's Space Weather Coordination Centre, that is hosted by the STCE, was on the program.
We met a lot of very enthusiastic and interested students who had a ton of questions for us. All in all, a great experience!
Review of solar activity
Solar Active Regions (ARs) and flares
Solar flaring activity ranged between low and moderate levels. There was a total of 12 active regions observed on the visible side of the solar disk. At the start of the week solar flaring activity was at moderate levels; NOAA AR 3296, NOAA AR 3293 and NOAA AR 3294 were the sources of the majority of the flaring activity. The largest flare was an M6.5 flare, peaking at 03:54 UTC May 09. This flare was associated with a Type II radio burst and originated from NOAA AR 3296. This region also produced multiple lower level M-class flares, which were also associated with CMEs. From May 12, the solar flaring activity reduced to low levels.
Coronal Mass Ejections
There were multiple Coronal Mass Ejections (CMEs) observed over the week, three of which were determined to have a possible Earth directed component. The first was a halo CME that was first observed in the LASCO/C2 coronagraph imagery around 23:25 UTC on May 07. The CME was driven by a long-duration M1 flare from NOAA AR 3296, with peak time 22:34 UTC, located near the central meridian close to the disk-centre. The second was another halo CME that was first observed in the LASCO/C2 coronagraph imagery around 19:00 UTC on May 09. The CME was associated with an M4.2 flare from NOAA AR 3296, with peak time 18:58 UTC. The majority of the CME was directed to the north-west, but a full halo shock is visible. These were predicted to impact Earth on May 11 and May 12, respectively. The third CME, which was first seen in SOHO/LASCO-C2 data at 09:48 UTC, associated with the M2.1 flare on May 11. The bulk of the CME was directed to the west but a glancing blow at Earth was predicted possible from May 14.
Coronal Holes
A laterally-elongated positive polarity coronal hole began to cross the central meridian on May 08.
International Sunspot Number by SILSO
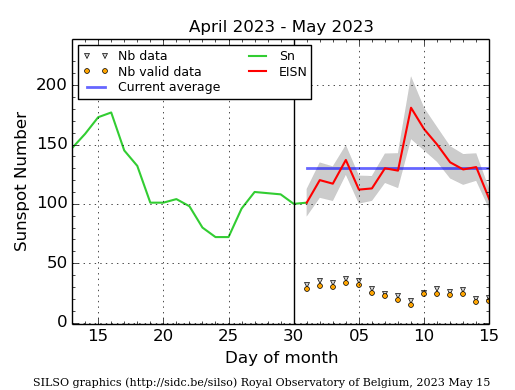
The daily Estimated International Sunspot Number (EISN, red curve with shaded error) derived by a simplified method from real-time data from the worldwide SILSO network. It extends the official Sunspot Number from the full processing of the preceding month (green line), a few days more than one solar rotation. The horizontal blue line shows the current monthly average. The yellow dots give the number of stations that provided valid data. Valid data are used to calculate the EISN. The triangle gives the number of stations providing data. When a triangle and a yellow dot coincide, it means that all the data is used to calculate the EISN of that day.
PROBA2 Observations
Solar Activity
Solar flare activity fluctuated from low to moderate during the week.
In order to view the activity of this week in more detail, we suggest to go to the following website from which all the daily (normal and difference) movies can be accessed: https://proba2.oma.be/ssa
This page also lists the recorded flaring events.
A weekly overview movie can be found at https://proba2.sidc.be/swap/data/mpg/movies/weekly_movies/weekly_movie_2023_05_08.mp4 (SWAP week 685).
Details about some of this week�s events can be found further below.
Tuesday May 09
Thursday May 12
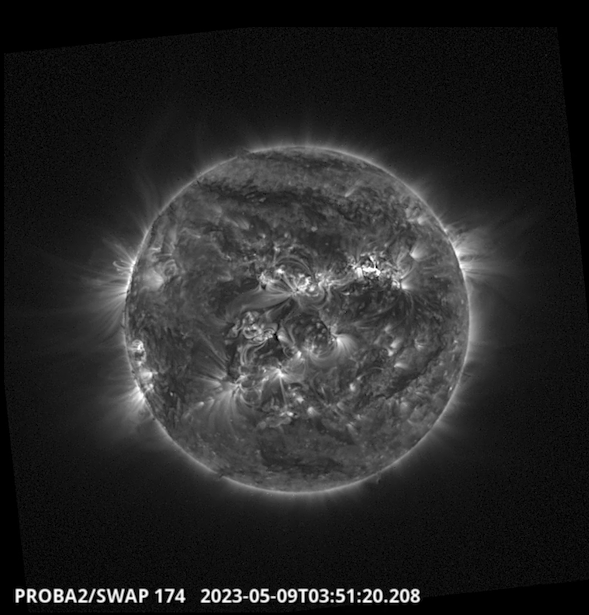
Four magnetically connected active regions, i.e. NOAA AR 3293, 3294, 3296, and 3297 were at the origin of most of the activity of the week and the source of several M-class flares and CMEs. The strongest one, an M6.5 flare peaking at 03:54 on May 9 is shown on the SWAP image below, close to the disk center.
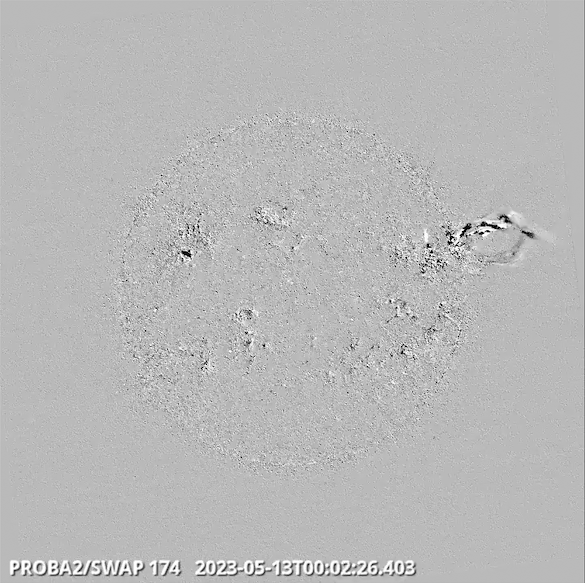
Those four regions remained active until the end of the week, and produced among others a nice eruption at the west limb, starting on May 12 just before midnight. It can be seen in the SWAP running-difference image below.
Noticeable Solar Events
| DAY | BEGIN | MAX | END | LOC | XRAY | OP | 10CM | TYPE | Cat | NOAA |
| 08 | 2011 | 2025 | 2033 | N13W18 | M2.3 | 2B | III/3 | 77 | 3296 | |
| 09 | 0342 | 0354 | 0405 | N12W13 | M6.5 | 1N | 360 | III/2II/2 | 77 | 3296 |
| 09 | 0555 | 0613 | 0628 | M1.2 | 210 | VI/2IV/2 | 77 | 3296 | ||
| 09 | 1000 | 1020 | 1033 | M1.3 | CTM/1 | 77 | 3296 | |||
| 09 | 1820 | 1858 | 1924 | N13W31 | M4.2 | 1B | 1300 | IV/3II/2 | 77 | 3296 |
| 09 | 2032 | 2052 | 2104 | N14W35 | M5.0 | 1N | 180 | VI/2 | 77 | 3296 |
| 10 | 1411 | 1421 | 1433 | N13W51 | M2.2 | SF | III/2 | 75 | 3293 | |
| 11 | 0847 | 0901 | 0911 | S6W41 | M2.1 | 1N | 100 | VI/2V/2II/2 | 78 | 3294 |
| 11 | 1813 | 1829 | 1838 | S5W44 | M1.8 | 1N | 180 | III/2II/2 | 78 | 3294 |
| LOC: approximate heliographic location | TYPE: radio burst type |
| XRAY: X-ray flare class | Cat: Catania sunspot group number |
| OP: optical flare class | NOAA: NOAA active region number |
| 10CM: peak 10 cm radio flux |
Review of geomagnetic activity
Electron fluxes at GEO
The greater than 2 MeV electron flux remained below the 1000 pfu threshold. The 24h electron fluence was at nominal levels for the week.
Solar wind
The solar wind conditions (ACE and DSCOVR) at the start of the week on May 07 reflected ICME and ongoing coronal hole influences, with a solar wind speed around 500 km/s. A shock was observed in the solar wind at 22:07 UTC on May 09. This was likely the arrival of the CME observed on May 07. The total magnetic field increased from 6 to 14 nT and the solar wind speed jumped from 450 to 525 km/s and reached a maximum of 680 km/s. The solar wind speed remained elevated on May 10 and 11. Another shock was observed in the solar wind at 05:48 UTC May 12. At this time the speed increased from 496 to 552 km/s and the magnetic field increased from 6 to 10 nT. This was likely related to the CME from May 09 that was predicted to be Earth-directed. Bz, however, was mostly positive at this time, with a minimum value of -5 nT. On May 13, the solar wind conditions reflected another transient feature passing in the magnetic field, beginning around 17:00 UT. The magnetic field increased to 15 nT with
a minimum Bz of -14 nT. By the end of the week, the solar wind speed levelled out around 500 km/s.
Geomagnetism
The geomagnetic conditions reached minor storm levels on May 10 and 12 in response to the ICME arrivals. Conditions then returned to quiet to unsettled levels from May 14.
Geomagnetic Observations in Belgium
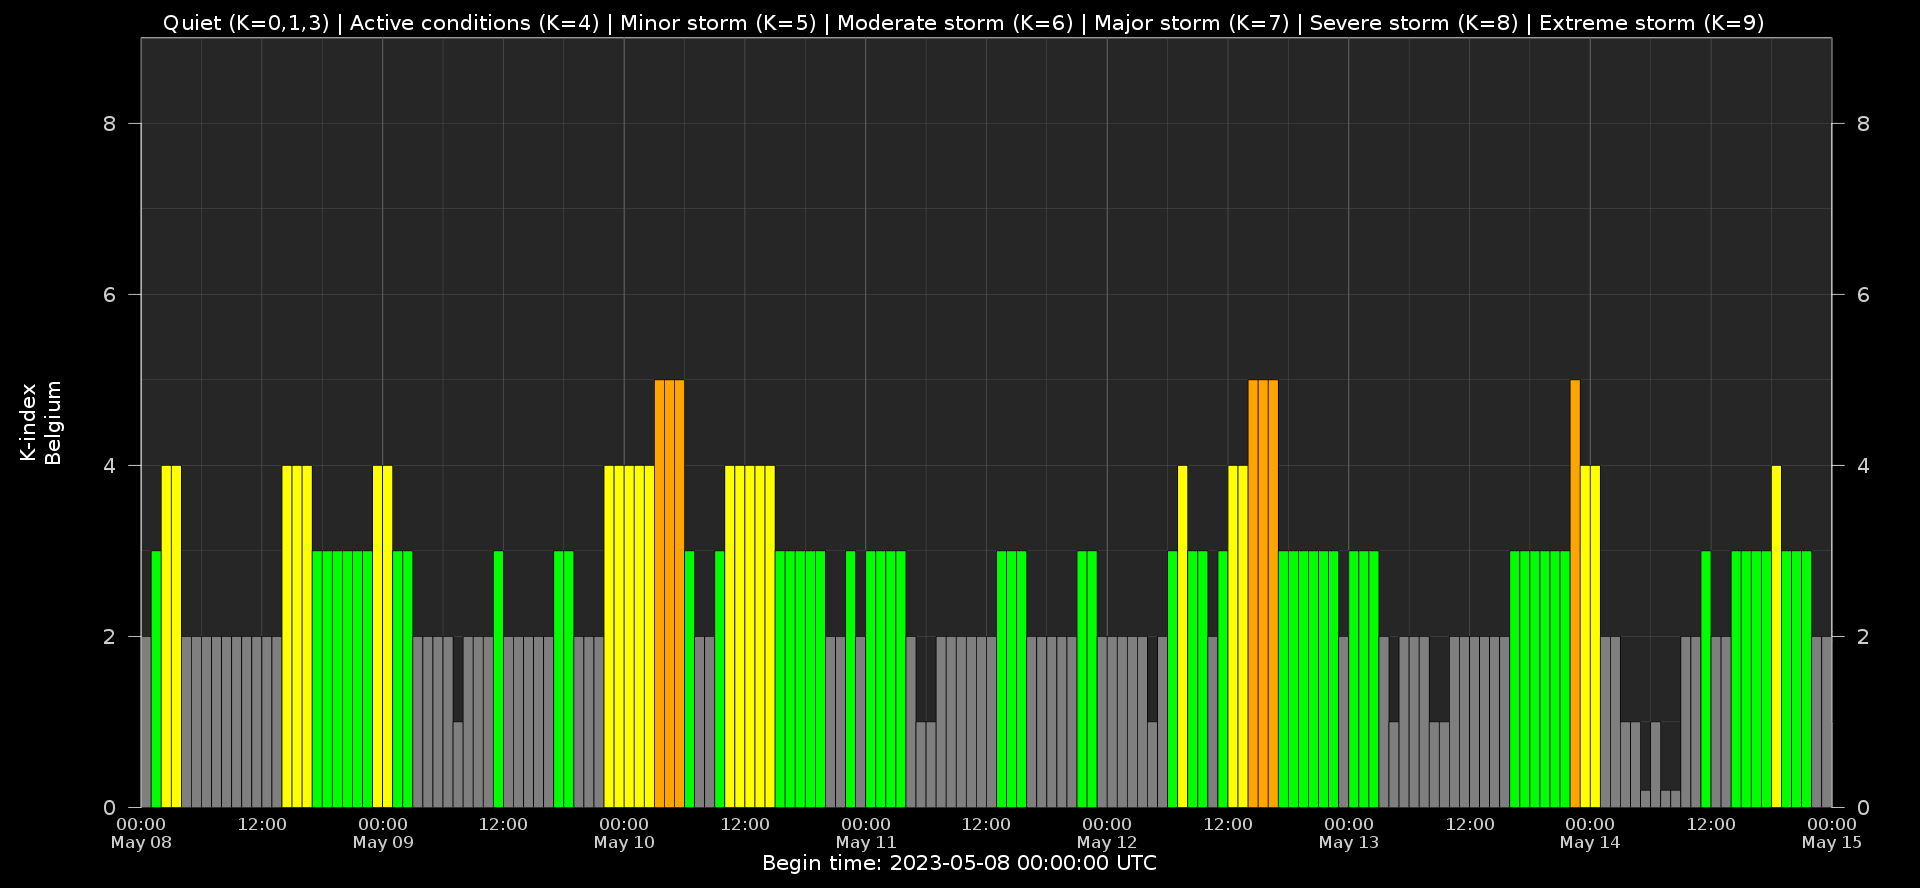
Local K-type magnetic activity index for Belgium based on data from Dourbes (DOU) and Manhay (MAB). Comparing the data from both measurement stations allows to reliably remove outliers from the magnetic data. At the same time the operational service availability is improved: whenever data from one observatory is not available, the single-station index obtained from the other can be used as a fallback system.
Both the two-station index and the single station indices are available here: http://ionosphere.meteo.be/geomagnetism/K_BEL/
Review of Ionospheric Activity

The figure shows the time evolution of the Vertical Total Electron Content (VTEC) (in red) during the last week at three locations:
a) in the northern part of Europe(N 61deg E 5deg)
b) above Brussels(N 50.5deg, E 4.5 deg)
c) in the southern part of Europe(N 36 deg, E 5deg)
This figure also shows (in grey) the normal ionospheric behaviour expected based on the median VTEC from the 15 previous days.
The VTEC is expressed in TECu (with TECu=10^16 electrons per square meter) and is directly related to the signal propagation delay due to the ionosphere (in figure: delay on GPS L1 frequency).
The Sun's radiation ionizes the Earth's upper atmosphere, the ionosphere, located from about 60km to 1000km above the Earth's surface.The ionization process in the ionosphere produces ions and free electrons. These electrons perturb the propagation of the GNSS (Global Navigation Satellite System) signals by inducing a so-called ionospheric delay.
See http://stce.be/newsletter/GNSS_final.pdf for some more explanations ; for detailed information, see http://gnss.be/ionosphere_tutorial.php
STCE Activities
Check out our activity calendar: activities and encounters with the Sun-Space-Earth system and Space Weather as the main theme. We provide occasions to get submerged in our world through educational, informative and instructive activities.
If you want your event in our calendar, contact us: stce_coordination at stce.be
* May 22-24, STCE Space Weather Introductory Course, Brussels, Belgium - FULL
* May 25, STCE seminar: Comparative study of a constant-alpha force-free field and its approximations in an ideal toroid, Meridian room@spacepole and zoom, Brussels, Belgium
* May 25, RMI Seminar: Towards a new hydrometeors identification tool at the RMI, conference room of the RMI, Brussels, Belgium
* May 29 - June 1, PITHIA-NRF Training School, Rome, Italy
* June 12-14, STCE Space Weather Course for BKG, Brussels, Belgium
* June 29, STCE annual meeting, Brussels, Belgium
Check: https://www.stce.be/calendar